Optical Projection Tomography preprocessing plugin for napari
This napari plugin was generated with Cookiecutter using @napari's cookiecutter-napari-plugin template.
Jump to:
Usage
Binning
ROI
-Log
Dark-field and Bright-field
Bad-pixel correction
Intensity correction
Fluorescence Bleaching
Starting point
Global settings
Transmission vs Emission
Corrections
Other
Installation
Troubleshooting installation
Contributing
License
Issues
Acknowledgements
Data input streamed from ImSwitch OPT widget (for details see ImSwitch docs)
Loaded tomography projections as data stack
Other stack 3D volume data formats
Small example data loaded via File -> Open Sample
Two important global settings are available: Inplace operations and Tracking.
To save memory, default mode performs operations on the image stack Inplace, rewriting the original image stack. If this option is not selected, a new layer with the modified version of the image will be created and added to the viewer.
When Inplace operations is selected, the Tracking option becomes available in the widget. This option allows tracking of the last operation performed on the stack/image. By pressing the Undo button, the last operation performed on the image is reverted. Only single undo is possible.
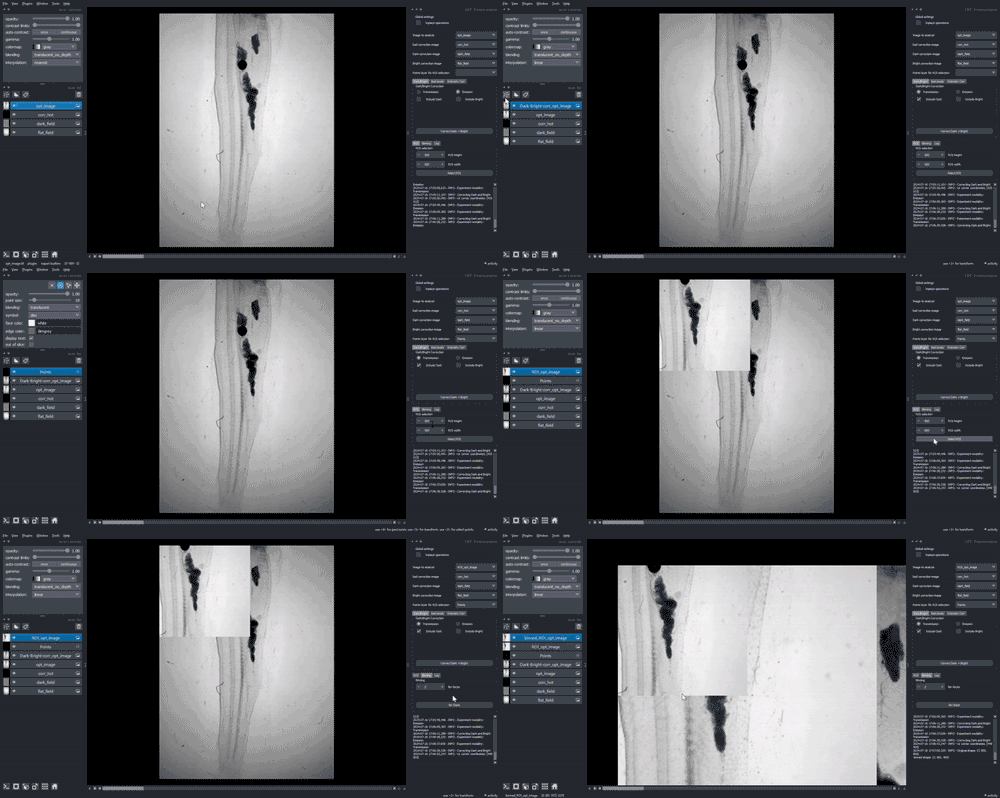
Currently, images are kept or casted to numpy.int16 after the operations, except for the -log calculation. We strongly recommend to perform the operation in top to bottom and left to right order, as they appear in the widget, otherwise there is a high chance of running into exceptions or unpredictable behavior. Please file an issue, if some of the widget logic should be fixed for your pipelines.
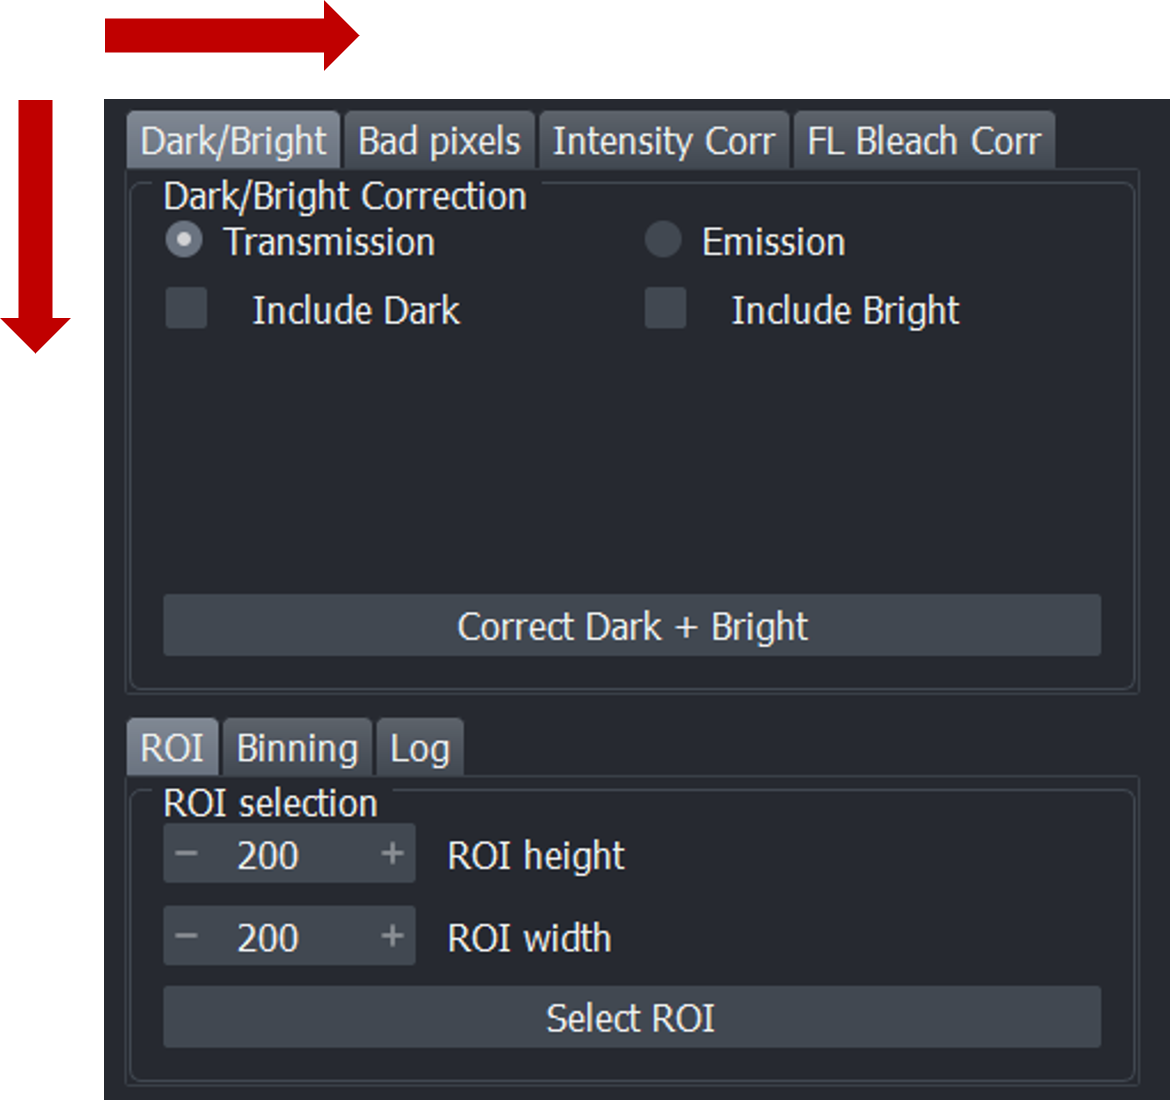
Transmission experiments are envisioned to be quantitative in the approximation of the Beer-Lambert law, this means that using the bright and dark measurement one can calculate the absorbance, or rather transmittance as

, where I is the measured signal, is the bright field intensity and are the dark counts.
Emission is typically far from quantitative, because of unknown staining concentration, quenching effects, bleaching, detection path calibration, quantum yields, to name some.
Dark-field, Bright-field and Bad-pixel corrections are directly related to the camera acquisition. Intensity correction deals on the other hand with the instability of the light source. The corrected image is shown in the viewer using the original image contrast limits. You may need to adjust the contrast limits to effectively see the result of the performed correction.
Combinations of Dark-field and Bright-field corrections are possible for both transmission and emission experiments.
The user must select the experiment modality and then decide whether to include only one correction (either Dark-field or Bright-field) or both. Once the correction is completed, depending on the Inplace setting, either a new layer with the corrected image will appear in the viewer, or the original image layer will be updated.Dark-field correction alone performs subtraction of the dark (int operation) image from each image in the image stack, it is always worth applying it. This operation is the same regardless of Transmission or Emission experimental modality.
Bright-field correction is particularly useful for transmission experiments, to correct varying intensity of the bright background of the images. The bright layer can also be used to identify dead pixels. If applied alone, images are divided by bright intensity (float division) and then converted to numpy.int16 for the case of Transmission experiment. For Emission data, bright field intensity is subtracted from the each image in the stack (int operation).
Dark + Bright field correction performed together is calculated for Transmission
(image - dark) / (bright - dark)
, which is float operation, casted subsequently to numpy.int16.
For the Emission data, the combined dark and bright correction applied to Emission experiment is simply
(image - dark) - (bright - dark) = image - bright
See section above for additional explanation on difference between transmission and emission.
Pixel correction is available for both hot pixels and dead pixels. Once the Bad pixel correction button is pressed, bad pixels are identified, and the user can choose to either correct them or visualize them as a new layer in the viewer.
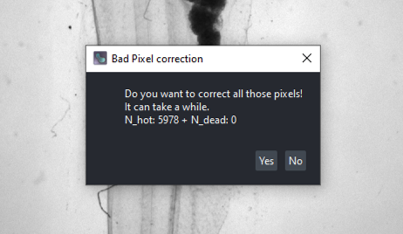
Correction is performed by considering the values of neighboring pixels. Two options are available for correction: n4 and n8. The n4 option uses the 4 neighboring pixels (up, down, left, and right), while the n8 option considers all 8 neighboring pixels. If a neighboring pixel is a bad pixel itself, it is not considered for correction. The bad pixel value is calculated as mean of the neighboring pixel values.
Once Dark-field, Bright-field and Bad pixels corrections have been applied, it is possible to apply an Intensity correction to correct light inhomogeneities along the stack generated by the instability of the illumination source.
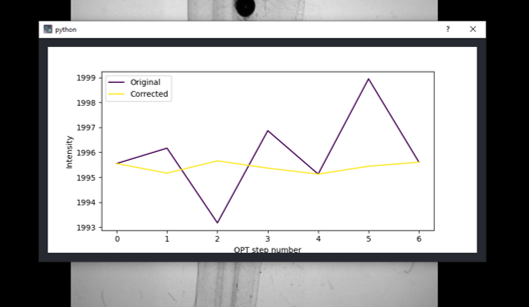
The user chooses the rectangle size and presses the Intensity correction button. The average of the pixels in four corners of the image (with side equal to the rectangle size) will be calculated over the stack and a corrected image will appear in the viewer (if the Inplace operations option is not selected) or the original image will be updated. Additionally, a plot showing the intensities over the stack (mean intensity over the 4 rectangular areas of the image) before and after the intensity correction will be shown.
If you want to correct for fluorescence photo-bleaching, see the next section.
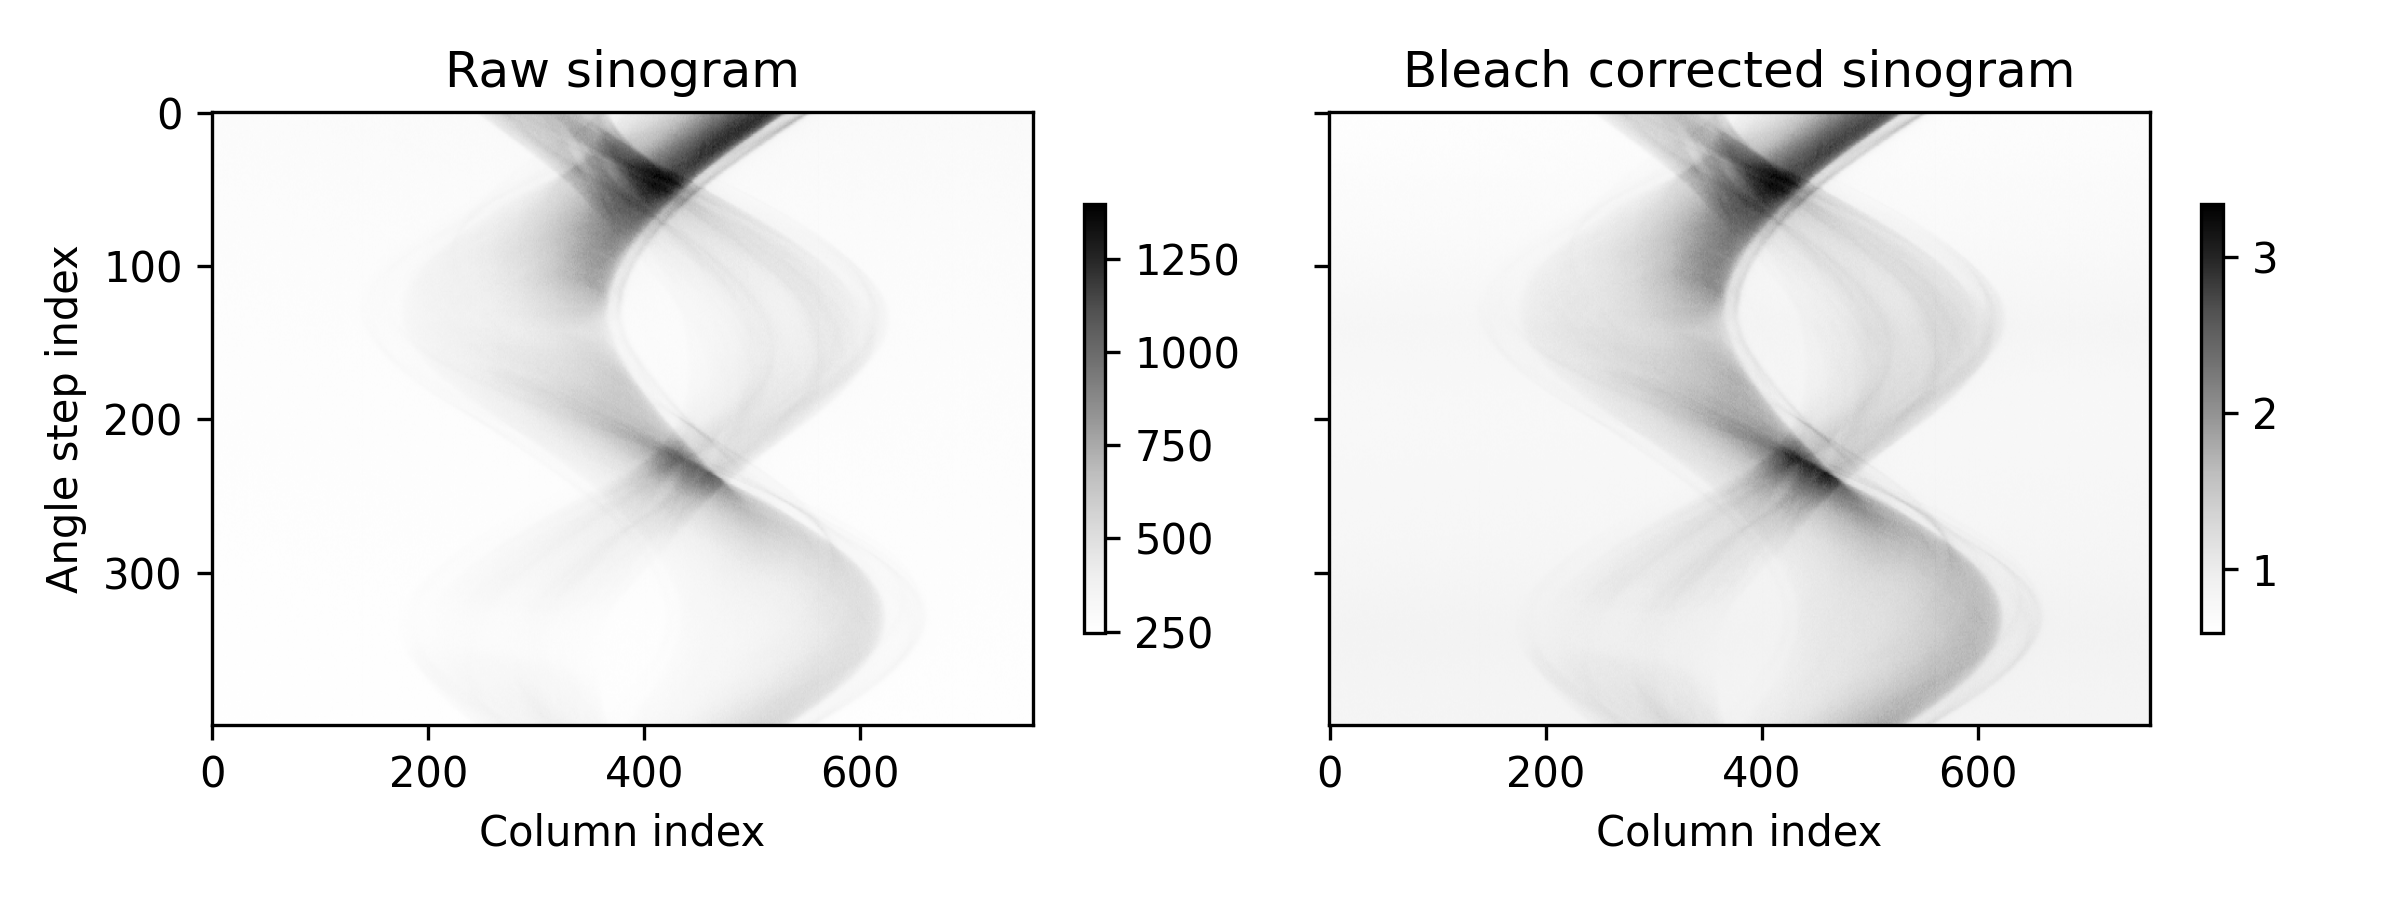
For each angle, the mean intensity values along the columns are calculated and then used as correction factors to divide the intensity values of each row in respect to first projection. Once the correction is done, a plot showing the calculated mean values for each angle appears in the viewer. This feature assumes that the stack is in the form (angles, rows, columns).
Note that this correction does not take care of shadowing effects which are apparent in the sinograms above, taken from a single camera row.The fluorescence excitation light comes from the right in this case, therefore the right side of sinogams show higher FL intensity.
Binning of the stack is possible. Choose the binning factor and press the Bin Stack button. The binned stack will be displayed and a notification with the original and new stack shapes will appear. The shape is (height // bin_factor, width // bin _factor), so edge pixels might be missing if your image dimensions are not devisable by bin_factor. Pixel values are calculated as a mean of the binned pixels and casted to numpy.int16. Binning factor of 1 results in no action.
For tomography reconstruction, selecting ROI can greatly reduce the computation time of the reconstruction algorithm.
Select a Points layer and add a point, which defines upper-left corner of the ROI. From that point width and height in pixels are selected by the user.
If more than one point is added, only the last point will be considered for ROI selection.
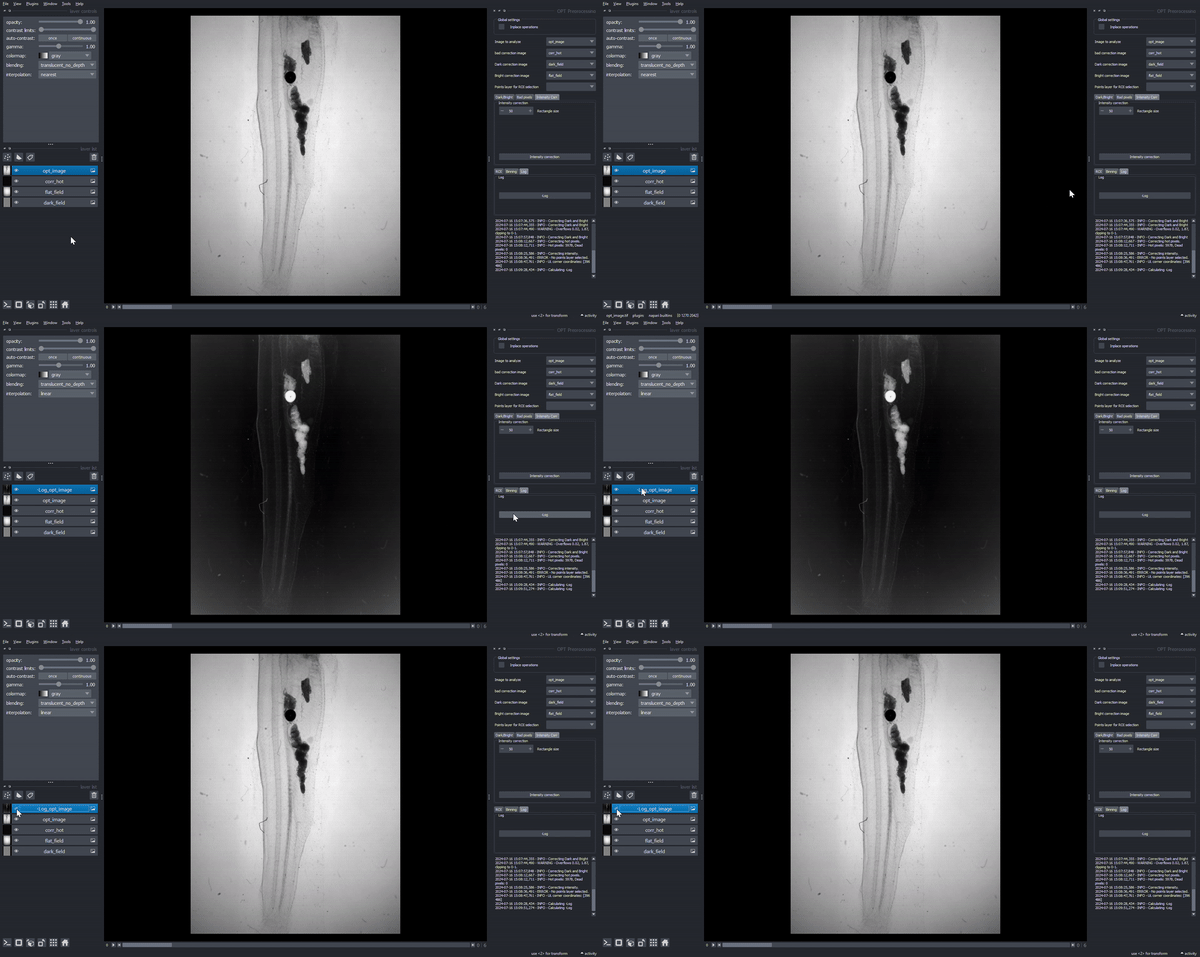
It is possible to calculate the logarithm of the image using the -Log function of the widget making details in dark and light areas more visible. This is a physically justified transformation in transmission experiments, because it converts counts to transmittance. For Emission measurements, it is just a transformation to increase contrast non-linearly for visualization.
You can install napari-opt-handler via pip:
pip install napari-opt-handler
To install latest development version :
pip install git+https://github.com/QBioImaging/napari-opt-handler.git
Contributions are very welcome. Tests can be run with tox, please ensure the coverage at least stays the same before you submit a pull request.
Distributed under the terms of the BSD-3 license, "napari-opt-handler" is free and open source software
Many people have contributed to this project. The main ones are:
Giorgia Tortora and Andrea Bassi (Politecnico Milan)
Teresa Correia (CCMAR-Algarve)
If you encounter any problems, please file an issue along with a detailed description.