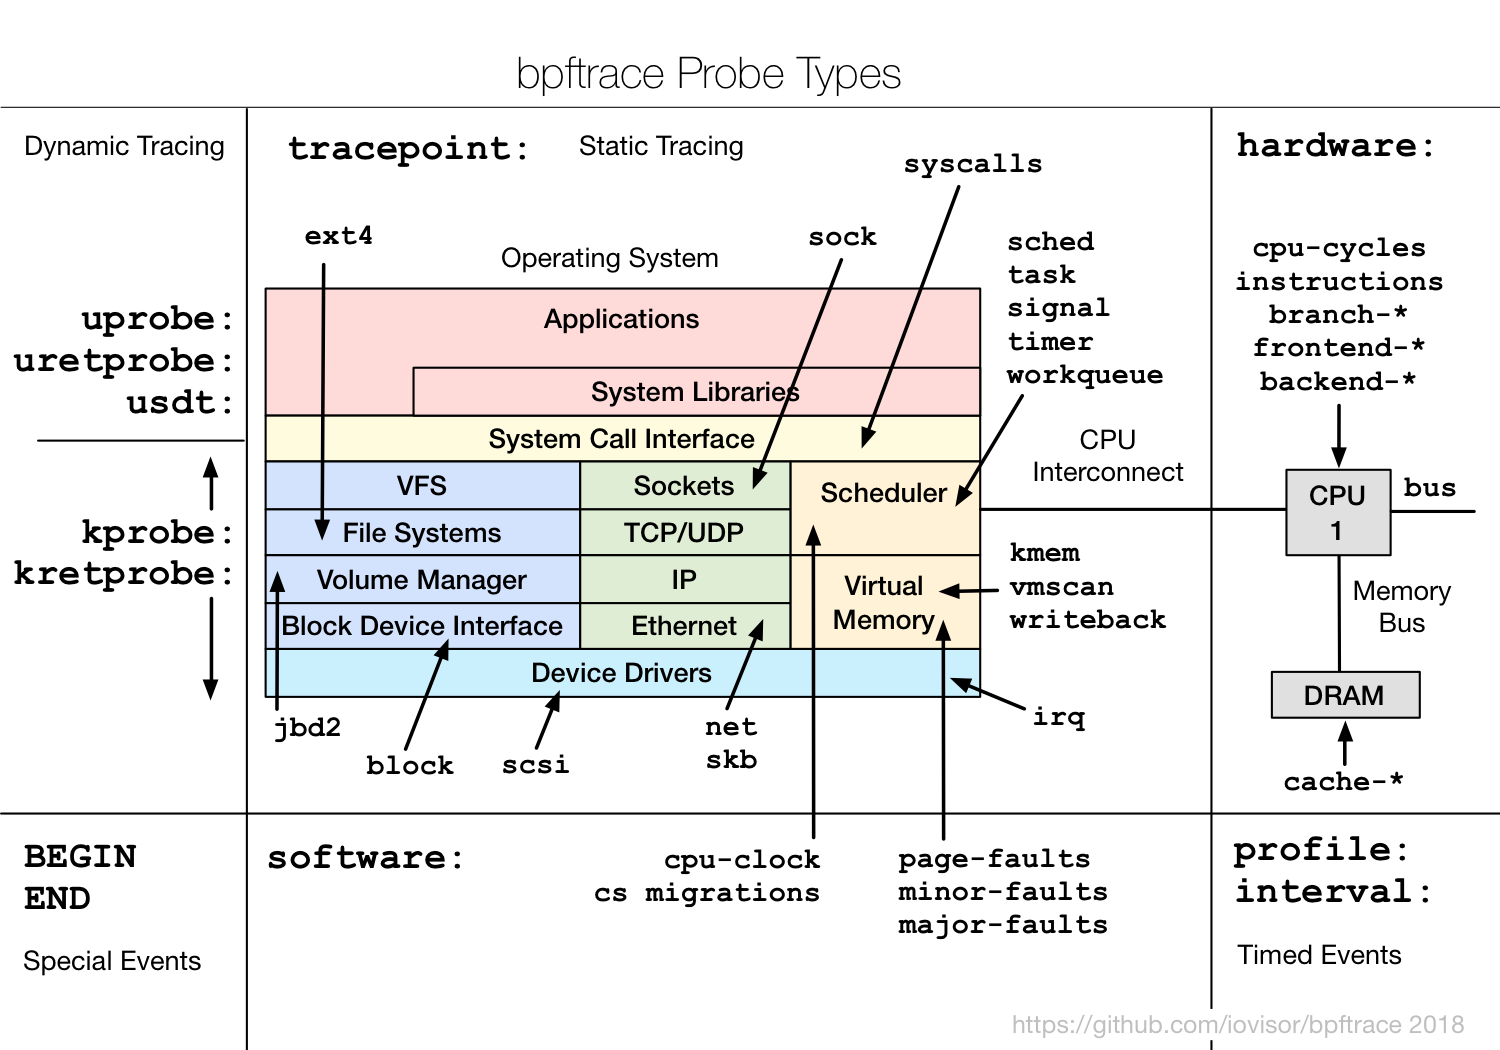
bpftrace is a high-level tracing language for Linux. bpftrace uses LLVM as a backend to compile scripts to eBPF-bytecode and makes use of libbpf and bcc for interacting with the Linux BPF subsystem, as well as existing Linux tracing capabilities: kernel dynamic tracing (kprobes), user-level dynamic tracing (uprobes), tracepoints, etc. The bpftrace language is inspired by awk, C, and predecessor tracers such as DTrace and SystemTap. bpftrace was created by Alastair Robertson.
How to Install and Build
Manual / Reference Guide
Tutorial
Example One-Liners
Videos
Tools
Contribute
Development
Support
Migration guide
Probe types
Plugins
License
The following one-liners demonstrate different capabilities:
# Files opened by thread name
bpftrace -e 'tracepoint:syscalls:sys_enter_open { printf("%s %sn", comm, str(args->filename)); }'

# Syscall count by thread name
bpftrace -e 'tracepoint:raw_syscalls:sys_enter { @[comm] = count(); }'

# Read bytes by thread name:
bpftrace -e 'tracepoint:syscalls:sys_exit_read /args->ret/ { @[comm] = sum(args->ret); }'

# Read size distribution by thread name:
bpftrace -e 'tracepoint:syscalls:sys_exit_read { @[comm] = hist(args->ret); }'

# Show per-second syscall rates:
bpftrace -e 'tracepoint:raw_syscalls:sys_enter { @ = count(); } interval:s:1 { print(@); clear(@); }'

# Trace disk size by PID and thread name
bpftrace -e 'tracepoint:block:block_rq_issue { printf("%d %s %dn", pid, comm, args->bytes); }'

# Count page faults by thread name
bpftrace -e 'software:faults:1 { @[comm] = count(); }'

# Count LLC cache misses by thread name and PID (uses PMCs):
bpftrace -e 'hardware:cache-misses:1000000 { @[comm, pid] = count(); }'

# Profile user-level stacks at 99 Hertz for PID 189:
bpftrace -e 'profile:hz:99 /pid == 189/ { @[ustack] = count(); }'

# Files opened in the root cgroup-v2
bpftrace -e 'tracepoint:syscalls:sys_enter_openat /cgroup == cgroupid("/sys/fs/cgroup/unified/mycg")/ { printf("%sn", str(args->filename)); }'
More powerful scripts can easily be constructed. See Tools for examples.
Note: some of the content in these videos may be out of date, the current reference guide is the source of truth.
Making bpftrace more powerful - 2023
Bpftrace Recipes: 5 Real Problems Solved - 2023
Linux tracing made simpler with bpftrace - 2022
Ahead-of-time compiled bpftrace programs - 2021
Getting Started with BPF observability - 2021
bpftrace internals - 2020
Using bpftrace with Performance Co-Pilot & Grafana - 2020
An introduction to bpftrace tracing language - 2020
Contributions are welcome! Please see the development section below for more information. For new bpftrace tools, please add them to the new user-tools repository. The tools that exist in this repository are a small collection curated by the bpftrace maintainers.
Bug reports and feature requests: Issue Tracker
Development IRC: #bpftrace at irc.oftc.net
Good first issues
Coding Guidelines
Development Guide
Development Roadmap
Fuzzing
Nix
Release Process
Tests
For additional help / discussion, please use our discussions page.
We are also holding regular office hours open to the public.

See the Manual for more details.
bpftrace has several plugins/definitions, integrating the syntax into your editor.
Emacs
Vim
VS Code
Copyright 2019 Alastair Robertson
Licensed under the Apache License, Version 2.0 (the "License"); you may not use this file except in compliance with the License. You may obtain a copy of the License at
http://www.apache.org/licenses/LICENSE-2.0
Unless required by applicable law or agreed to in writing, software distributed under the License is distributed on an "AS IS" BASIS, WITHOUT WARRANTIES OR CONDITIONS OF ANY KIND, either express or implied. See the License for the specific language governing permissions and limitations under the License.