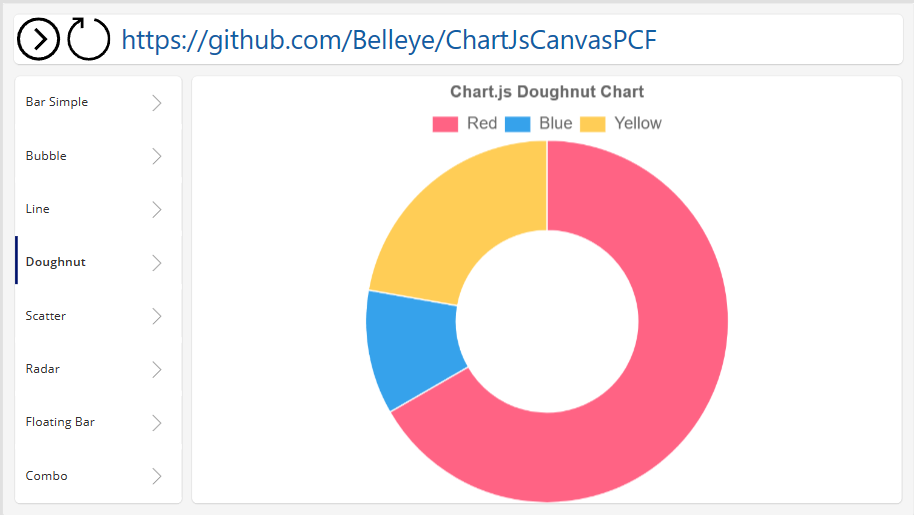
ChartJsCanvasPCF is a custom Power Apps component framework (PCF) control that uses Chart.js, an open-source JavaScript library for creating interactive charts on web pages. This control allows users to visualize and interact with data within Power Apps Canvas. Demo Video
Chart.js is a flexible JavaScript charting library for the modern web. It provides developers with the ability to create eight different types of animated and customizable charts. Chart.js uses the HTML5 canvas element for rendering, which offers great performance across all modern browsers.
The PCF control accepts several inputs and provides outputs. Capabilities are best viewed in the ChartJsDemo.msapp.
data (Refer to Example Data folder)
options (Refer to Example Data folder)
type (Chart type ie bar)
labelSize (Font size for labels ie 15)
fontType (Font Type ie Arial)
selectedItem (returns the selected data point's index)
lastSelected (Epoch time of the last selection, refer to demo app for usage)
Download the PowerAppsToolsTemp_dev.zip file and follow these instuctions: Speed Run Install PCF
Node.js
Power Apps CLI
Clone the repository:
git clone https://github.com/Belleye/ChartJsCanvasPCF.git
Navigate to the project directory:
cd src
Install dependencies:
npm install
To start the development server:
npm start watch
To build the project:
npm run build
To push the control to Power Apps:
pac pcf push
After deployment, add the ChartJsCanvasPCF control to your Power Apps Canvas and bind it to your data source.
Contributions are welcome.
This project is licensed under the MIT License - see the LICENSE file for details.
Chart.js library for providing the foundational chart functionality.