vzi is the spiritual successor to viz
vzi command line is (now) implemented using deno, and rendering requires the Chrome DevTools Protocol. vzi has only been tested for Mac, although it should trivially work on Linux (just tell it the path to the Chrome binary).
Many of us have been using the command line for decades. The success of the command line interface is intimately tied to the idea of Unix pipes. Pipes give us the ability to compose complex functions on the fly, tailored to the needs of the input data we are manipulating. For this purpose, the shell is the highest bandwidth input mechanism that humans have yet invented to instruct machines.
And yet, we have no good way of piping data into that other highly dynamic environment in which we spend a great deal of time: the browser. The goal of vzi is to bridge that gap, so we can include web-based compositions as part of our cherished data pipelines.
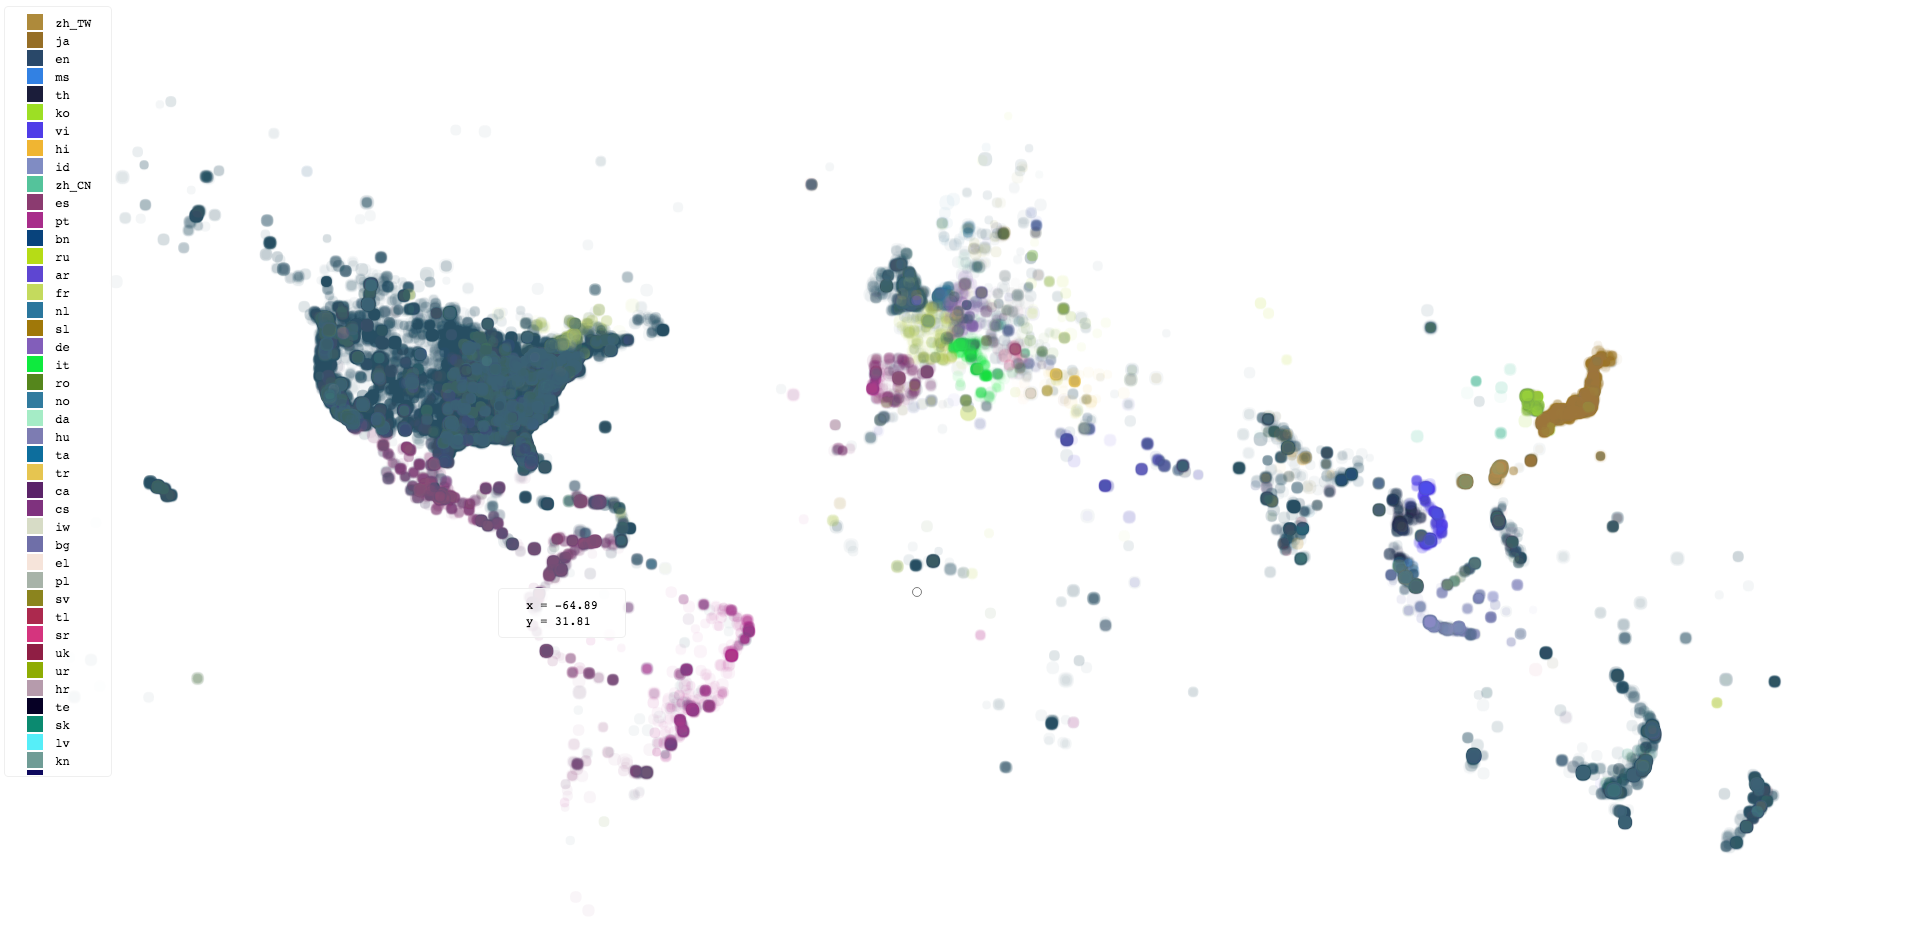
Looking at data in the terminal, we often have no good way to interpret it, yet with some slight transformation, our eyes are able to comprehend deep patterns. Given a source of data that contains latitude and longitude coordinates, a natural way to explore this data is using a map. You can do that with vzi by piping the data to it, e.g.:
$ your data source | vzi -m scatter -d 'y=lat($[0])' -d 'x=lng($[1])' -d c=2
Here is a screenshot of the state produced by using the above command with lines of data of the form latitude longitude language:

The actual report state produced by vzi at any given time is a complete and full-fledged web page, much richer than a static image. If you choose, the final (or intermediate) report state(s) can be saved, or you may simply wish to interact with it temporarily inside the browser, ignoring the output. Either way, vzi makes data analysis sessions more fun and productive.
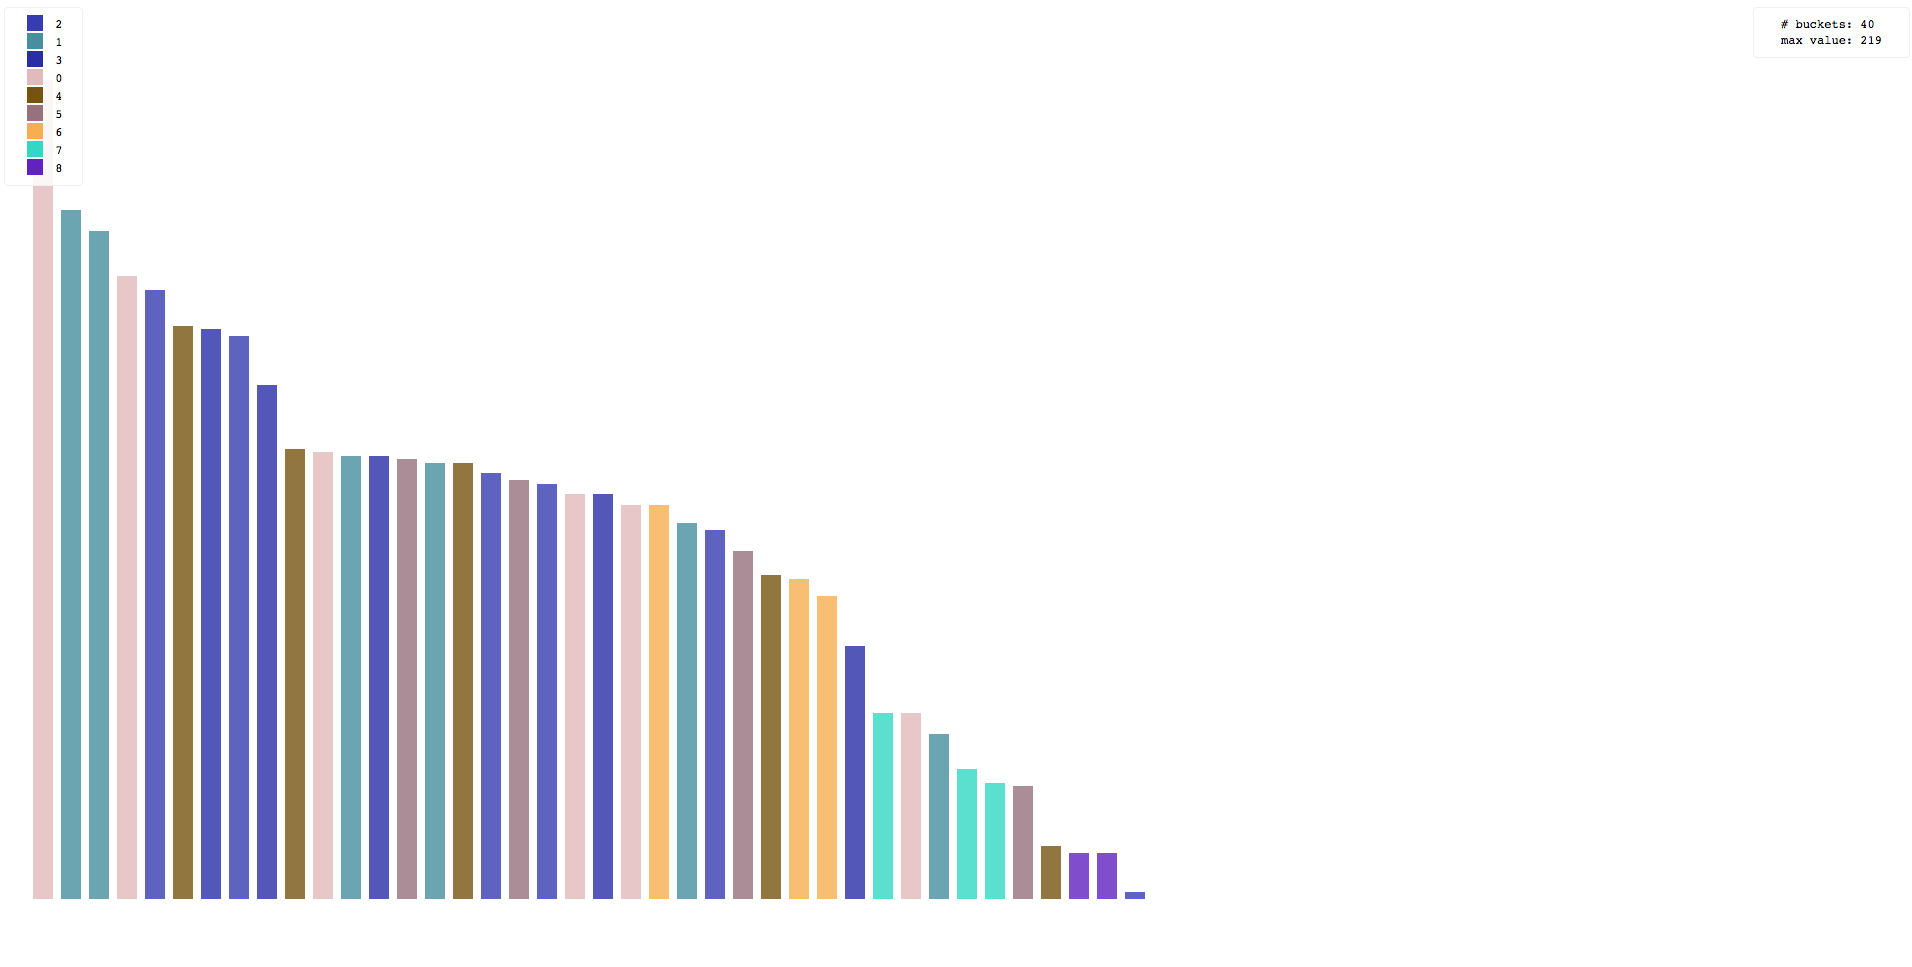
Another type of visualization that comes builtin is the bucket module.
Below is a screenshot of the report produced by the command:
$ bin/gen-yxz | vzi -m hist -d c=2

Modules can reuse code from each other. The above command is actually equivalent to the command:
$ bin/gen-yxz | vzi -m bucket -d c=2 -d orderBy=freq
The scatter and bucket modules are rather general and can be used to great effect in any number of situations.
However, it is easy to write other pipe modules, and doing so can in fact be quite an enjoyable exercise.
First, install Chrome Canary. It's not strictly required, but its the best and easiest way to use vzi currently.
You can install the command line tool globally with deno using:
deno install -A -f https://raw.githubusercontent.com/jflatow/vzi/master/bin/vzi
A better method for developers is to clone the repository and install it:
$ git clone https://github.com/jflatow/vzi.git
$ cd vzi && make install
Quickly test it works:
$ vzi
It should open a window in the browser.
If not, you may need to use the -b option to tell vzi where the browser executable path is.
For a complete list of options: vzi -h.
If Canary is already launched without the remote debugging port open, you may get an error when vzi requests a new page (i.e. /json/new).
In that case, just quit Chrome and let vzi launch it the way it wants, or re-open it yourself with the port open.
The default port used by vzi is 9222, but you can specify it using the -p option.
With the browser window still open, on the stdin pipe that is open to the browser, you can type a message:
> hello, world!
Make sure you enter a newline at the end, so that the line is complete.
Back in the open browser window, you should see your message in the document body.
Enter as many lines as you like, each one updates the document.
When you are done, close the pipe using ^D.
If you've cloned the vzi repo directory, you can try this from inside it:
$ bin/gen-yxz | vzi -m scatter -d c=2
By default vzi will produce a single, final, report document on stdout. The pipe that gets executed by vzi (via Chrome) defines what happens to the browser state as new events are received.
There are three ways to tell vzi how to execute its pipe:
-c, --cli option-m, --module option$ cat events | vzi pipe.js
$ cat events | vzi -c '...'
$ cat events | vzi -m module
If the -K, --keep-alive option is given, vzi will not attempt to close the browser.
The -OK can be used together for a quiet, interactive session.
If the -O, --no-output option is given, output will be disabled.
If the -o, --output option is given, vzi will write its report state to the output path after every batch of events.
In this way, one can watch the output file for changes in order to observe the recent state of the pipeline (e.g. when running headless).
If neither -o nor -O are specified, only the final state is written to stdout.
$ cat events | vzi pipe.js -O
$ cat events | vzi pipe.js -o report.html
$ cat events | vzi pipe.js > report.html
One may also control the mechanism vzi uses for rendering the events using the -p, --port option.
If given, the port is assumed to speak the DevTools wire protocol (e.g. a browser with remote-debugging enabled).
If the -p option is not given, vzi will create its own browser for rendering.
$ cat events | vzi pipe.js
$ cat events | vzi pipe.js -p PORT
$ cat events | vzi pipe.js -p PORT > report.html
The -H, --headless option may be given to force vzi to create a headless browser.
This requires a browser capable of being run headlessly (NB: Chrome Canary at the time of this writing).
$ cat events | vzi pipe.js -H
Running headlessly is considered a rather advanced mode of operation, though it works quite well. In general, there are 2 modes of operation for the browser: attached and detached. When you run detached (default if not headless), things are a bit easier and smoother to get started. Especially when you run without headless, since you can see exactly what's happening. In the attached mode, interrupts end up killing the browser, so unless you send a proper EOF you won't get an output report. This is still fine without headless, since you still see the output in the browser as its generated. However, when you run in headless mode attached, you generally don't want to pipe an infinite stream. This is because without an EOF you won't be able to kill the process gracefully, so you will neither see the output nor get a report.
Some of the available options may be confusing without an understanding of how the tool works. The overall setup is complex yet straightforward. Once the DevTools implementation is known, a page is opened and the events are sent via a layer on top of the Chrome debugging protocol. Within this context, the user-defined pipe handler functions are executed.
There are two key interfaces that vzi provides. One is the specification of how an output report gets produced. The other is the environment in which user-defined functions are run, and the callbacks that are used. We call the user-defined logic that executes in this environment the pipe. The pipe handles the visualization logic for the Unix pipe that it runs inside.
The pipe interface is currently defined in index.js. The best examples are the builtin modules, listed here in order of complexity:
Here are some other quick examples you can try, assuming you've cloned the repository:
bin/gen-yxz | vzi -m scatter -d y='log($[0])' -d ys='exp(_)'
bin/gen-line | vzi -m hist -d v=1 -d k='second((new Date - 0) / 1000, 3)'