This is the public repository of the Traffic Cameras analysis project as published on the Office for National Statistics Data Science Campus Blog as part of the ONS Coronavirus Faster Indicators (for example - Traffic Camera Activity - 10th September 2020) and the underlying methodology. The project utilised Google Compute Platform (GCP) to enable a scalable solution, but the underlying methodology is platform agnostic; this repository contains our GCP orientated implementation.
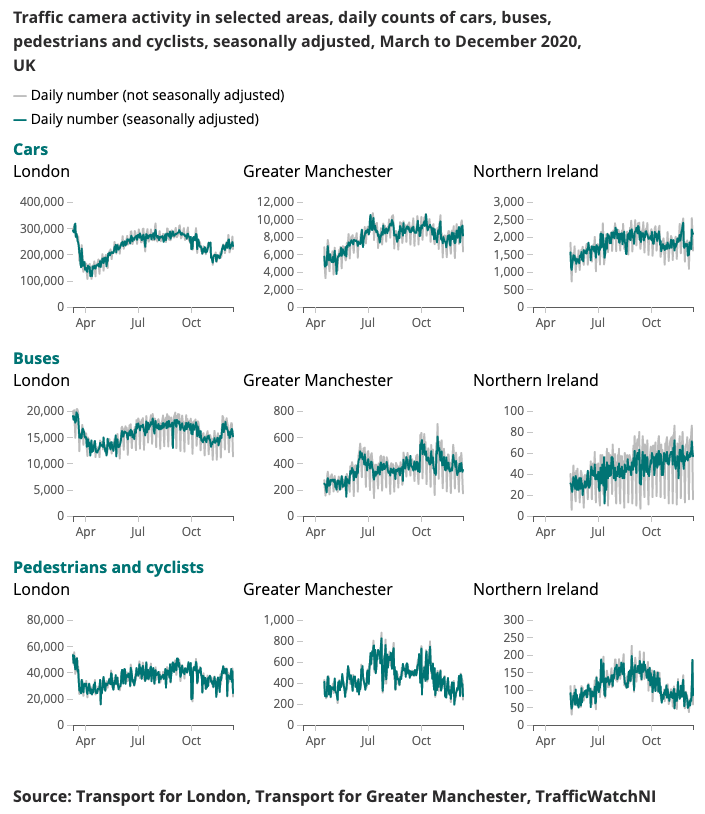
An example output produced for the Coronavirus Faster Indicator is presented below.
Understanding changing patterns in mobility and behaviour in real time has been a major focus of the government response to the coronavirus (COVID-19). The Data Science Campus has been exploring alternative data sources that might give insights on how to estimate levels of social distancing, and track the upturn of society and the economy as lockdown conditions are relaxed.
Traffic cameras are a widely and publicly available data source allowing transport professionals and the public to assess traffic flow in different parts of the country via the internet. The images traffic cameras produce are publicly available, low resolution, and do not permit people or vehicles to be individually identified. They differ from CCTV used for public safety and law enforcement for Automatic Number Plate Recognition (ANPR) or for monitoring traffic speed.
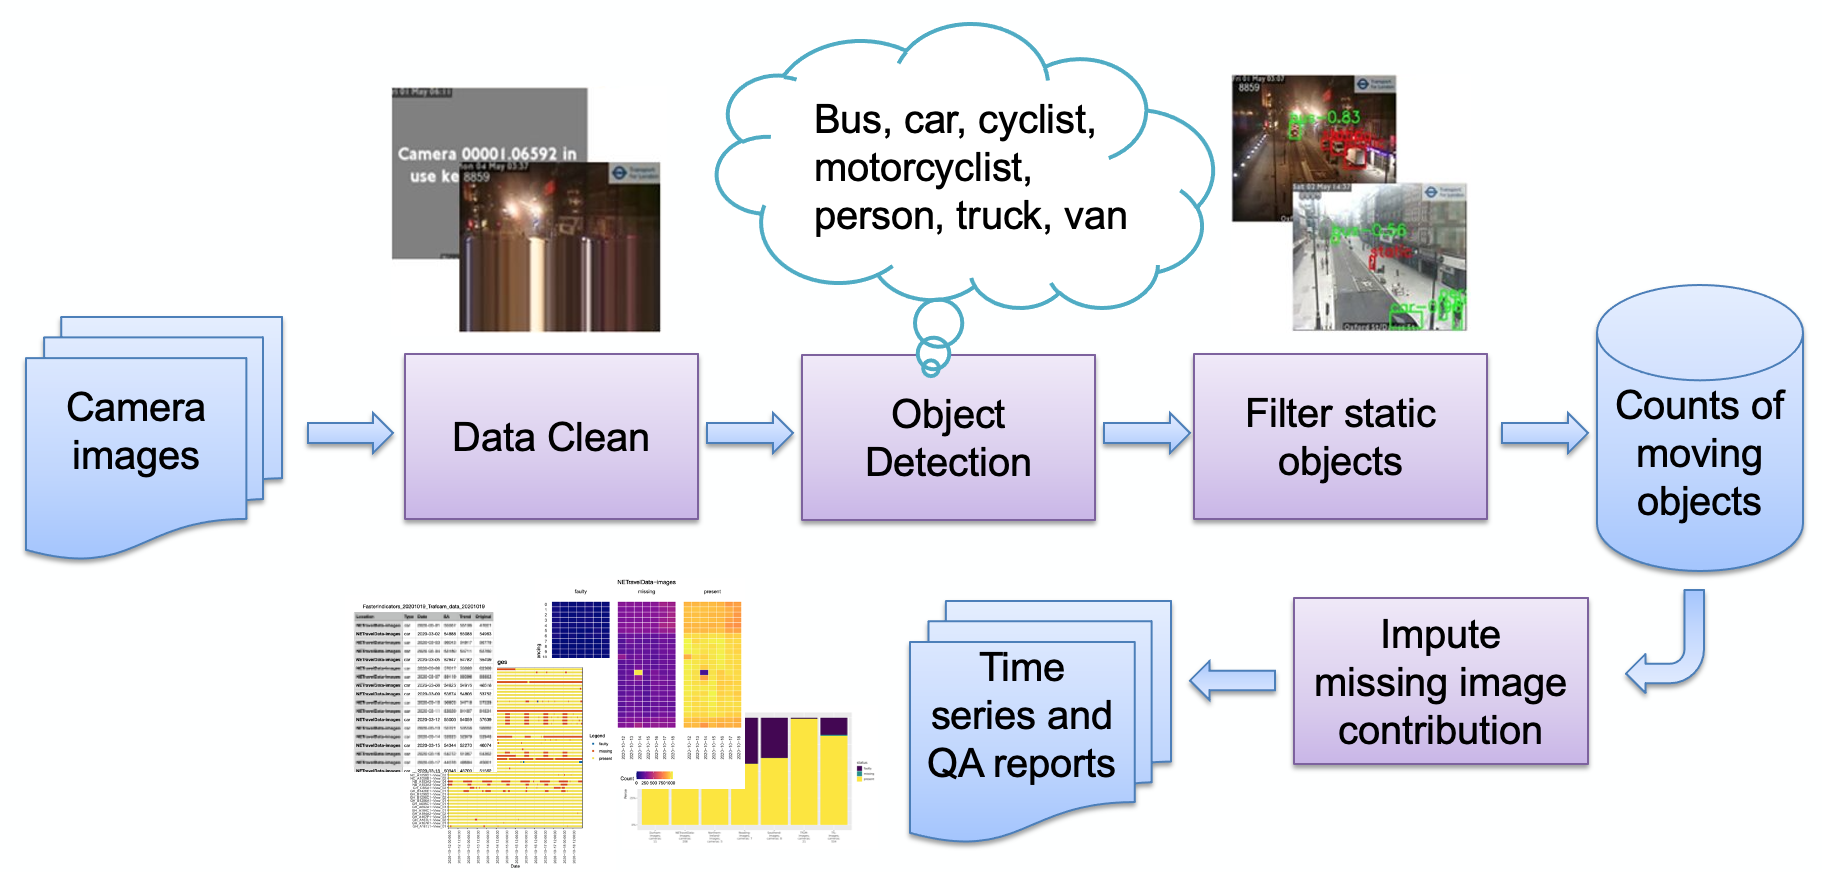
The main stages of the pipeline, as outlined in the image, are:
Image ingestion
Faulty image detection
Object detection
Static object detection
Storage of resulting counts
The counts can then be further processed (seasonal adjustment, missing value imputation) and transformed into reports as required. We will briefly review the main pipeline stages.
A set of camera sources (web hosted JPEG images) is selected by the user, and provided as a list of URLs to the user. Example code is provided to obtain public images from Transport for London, and specialist code to pull NE Traffic Data directly from Newcastle University's Urban Observatory.
Cameras may be unavailable for various reasons (system fault, feed disabled by local operator, etc.) and these
could cause the model to generate spurious object counts (e.g. a small blob may look like a distant bus). An example of
such an image is:
These images have so far all followed a pattern of a very synthetic image, consisting of a flat background colour and
text overlaid (compared to an image of a natural scene). These images are currently detected by reducing the colour
depth (snapping similar colours together) and then looking at the highest fraction of the image
occupied by a single colour. Once this is over a threshold, we determine the image is synthetic and mark it
as faulty. Other faults may occur due to encoding, such as: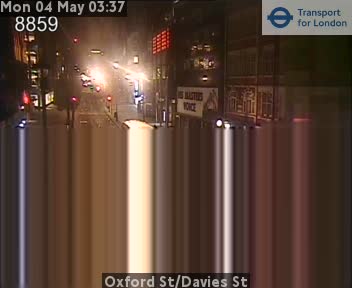
Here, the camrera feed has stalled and the last "live" row has been repeated; we detect this by checking if the bottom row of image matches the row above (within threshold). If so, then the next row above is checked for a match and so on until rows no longer match or we run out of rows. If the number of matching rows is above a threshold, then the image is unlikely to generate useful data and hence is flagged as faulty.
Note different image providers use different ways of showing that a camera is unavailable; our detection technique relies on few colours being used - i.e. a purely synthetic image. If a more natural image is used, our technique may not work. An alternative is to keep a "library" of failing images and look for similarity, which may work better with more natural images.
The object detection process identifies both static and moving objects, using a pre-trained Faster-RCNN provided by Newcastle University's Urban Observatory. The model has been trained on 10,000 traffic camera images from North East England, and further validated by the ONS Data Science Campus to confirm the model was usable with camera imagery from other areas of the UK. It detects the following object types: car, van, truck, bus, pedestrian, cyclist, motorcyclist.
As we are aiming to detect activity, it is important to filter out static objects using temporal information. The images are sampled at 10-minute intervals, so traditional methods for background detection in video, such as mixture of Gaussians, are not suitable.
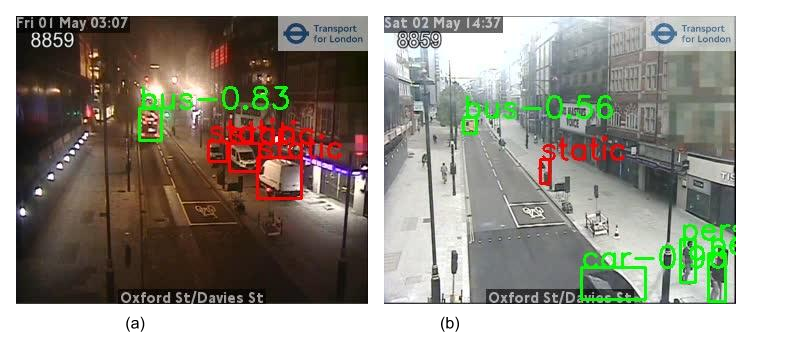
Any pedestrians and vehicles classified during object detection will be set as static and removed from the final counts if they also appear in the background. The below image shows example results of the static mask, where the parked cars in image (a) are identified as static and removed. An extra benefit is that the static mask can help remove false alarms. For example, in image (b), the rubbish bin is misidentified as a pedestrian in the object detection but filtered out as static background.
The results are simply stored as a table, the schema recording camera id, date, time, related counts per object type (car, van, pedestrian, etc.), if an image is faulty or if an image is missing.
Initially, the system was designed to be cloud native, to enable scalability; however, this introduces a barrier to entry - you need to have an account with a cloud provider, know how to secure the infrastructure, etc. With this in mind, we have also back-ported the code to work on a stand-alone machine (or "local host") to enable an interested user to simply run the system on their own laptop. Both implementations are now described below.
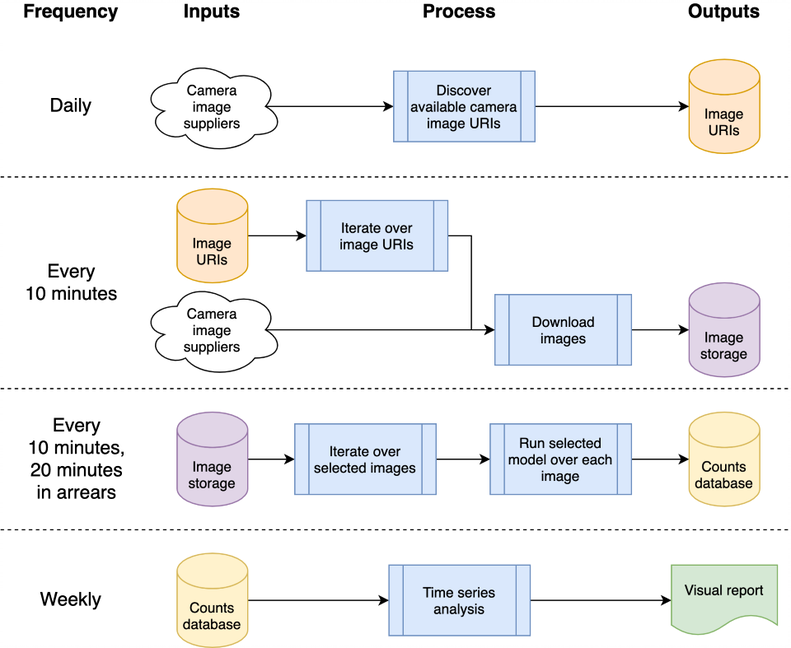
This architecture can be mapped to a single machine or a cloud system; we opted to use Google Compute Platform (GCP), but other platforms such as Amazon Web Services (AWS) or Microsoft’s Azure would provide relatively equivalent services.
The system is hosted as “cloud functions”, which are stand-alone, stateless code that can be called repeatedly without causing corruption – a key consideration to increase the robustness of the functions. The daily and “every 10 minutes” processing bursts are orchestrated using GCP’s Scheduler to trigger a GCP Pub/Sub Topic according to the desired schedule. GCP cloud functions are registered against the topic and are started whenever the topic is triggered.
Processing the images to detect vehicles and pedestrians results in counts of objects being written into a database for later analysis as a time series. The database is used to share data between the data collection and time series analysis, reducing coupling. We use BigQuery within GCP as our database given its wide support in other GCP products, such as Data Studio for data visualisation; the local host implementation stores daily CSVs by comparison, to remove any dependence on a particular database or other infrastructure.
The GCP related source code is stored in the cloud folder; this downloads the imagery, processes it to count objects,
stores the counts in a database and (weekly) produces time-series analysis. All documentation and source code
are stored in the cloud folder; refer to the Cloud README.md for an overview of the architecture
and how to install your own instance using our scripts into your GCP project space. The project can be integrated
into GitHub, enabling auto-deployment and test execution automatically from commits to a local GitHub project; this is
also documented in the Cloud README.md. Cloud support code is also stored in thechrono_lens.gcloud module, enabling command line scripts to support GCP, alongside the Cloud Function code
in the cloud folder.
Stand-alone, single machine ("localhost") code is contained in the chrono_lens.localhost module. The process
follows the same flow as the GCP variant, albeit using a single machine and each python file in chrono_lens.localhostmaps to the Cloud Functions of GCP. Refer to README-localhost.md for further details.
We now describe the various steps and pre-requisites to install the system, given that both GCP & local hos implementations require at lesat some local installation.
The creation of a virtual environment is strongly advised allowing for an isolated working environment. Examples of good working environments include conda, pyenv, and poerty.
Note that dependencies
are already contained in requirements.txt, so please install this via pip:
pip install -r requirements.txt
To prevent accidentally committing passwords, pre-commit hooks are recommended that prevent git commits from being processed before sensitive information has landed in the repository. We've used the pre-commit hooks from https://github.com/ukgovdatascience/govcookiecutter
Installing requirements.txt will install the pre-commit tool, which now needs to be connected to git:
pre-commit install
...which will then pull configuration from .pre-commit-config.yaml.
NOTE the check-added-large-files pre-commit test has its maximum kB size in.pre-commit-config.yaml is temporarily increased to 60Mb when adding the RCNN model file/tests/test_data/test_detector_data/fig_frcnn_rebuscov-3.pb.
The limit is then reverted to 5Mb as a sensible "normal" upper limit.
Its recommended to run a sweep across all files before proceeding, just to ensure nothing is already present by mistake:
pre-commit run --all-files
This will report any existing issues - useful as the hook is otherwise only run on edited files.
The project is designed to be used primarily via cloud infrastructure, but there are utility scripts for local access
and updates to the time series in the cloud. These scripts are located in the scripts/gcloud folder, with each script now described in
separate following sections. Further information can be found in scripts/gcloud/README.md,
and their use by an optional virtual machine is described in cloud/README.md.
Non-cloud use is supported by the scripts in the scripts/localhost folder, and detail of how to use the chrono_lenssystem on a stand-alone machine is described in README-localhost.md. Further information
on using the scripts can be found in scripts/localhost/README.md.
Note that scripts make use of code in the chrono_lens folder.
| Version | Date | Notes |
|---|---|---|
| 1.0.0 | 2021-06-08 | First release of public repository |
| 1.0.1 | 2021-09-21 | Bug fix for isolated images, tensorflow version bump |
| 1.1.0 | ? | Added limited support for stand-alone single machine |
Areas of potential future work are presented here; these changes may not be investigated, but are here to make people aware of potential improvements we have considered.
At present, bash shell scripts are used to create the GCP infrastructure; an improvement would be to use IaC, such as Terraform. This simplifies the changing of (e.g.) Cloud Function configurations without having to manually remove the Cloud Build Trigger and re-creating it when the runtime environment or memory limits are changed.
The current design stems from its initial use case of acquiring images before the models were finalised, hence all available images are downloaded rather than just those that are analysed. To save ingestion costs, the ingest code should cross-check against the analysis JSON files and only download those files; an alert should be raised when any of these sources are no longer available, or if new sources become available.
The nightly back-fill of images for NETravelData appears to refresh around 40% of NETravelData images;
the advantage of a regular refresh is diminished if the numbers are only required daily,
and hence the Cloud Function distribute_ne_travel_data may be removed.
http async to PubSubThe initial design uses manually operated scripts when testing new models - namely, batch_process_images.py.
This reports the success (or not) and numbers of images processed. To do this,
a Cloud Function works well as it returns a result. However, a more efficient
architecture would be to use a PubSub queue internally with the distribute_json_sources andprocessed_scheduled functions adding work to PubSub queues which are consumed by a single worker
function, rather than the current hierarchy of async calls (using two extra functions to scale out).
Newcastle University's Urban Observatory supplied the
pre-trained Faster-RCNNN
which we use (a local copy is stored in /tests/test_data/test_detector_data/fig_frcnn_rebuscov-3.pb).
Data is provided by the North East Urban Traffic Management and Control Open Data Service, licensed under the Open Government Licence 3.0. Images are attributed to Tyne and Wear Urban Traffic Management and Control.
The North East data is further processed and hosted by Newcastle University's Urban Observatory, whose support and advice we gratefully acknowledge.
Data is provided by TfL and is powered by TfL Open Data. The data is licensed under version 2.0 of the Open Government Licence. TfL data contains OS data © Crown copyright and database rights 2016 and Geomni UK Map data © and database rights (2019).
Various 3rd party libraries are used in this project; these are listed on the dependencies page, whose contributions we gratefully acknowledge.