Documentation
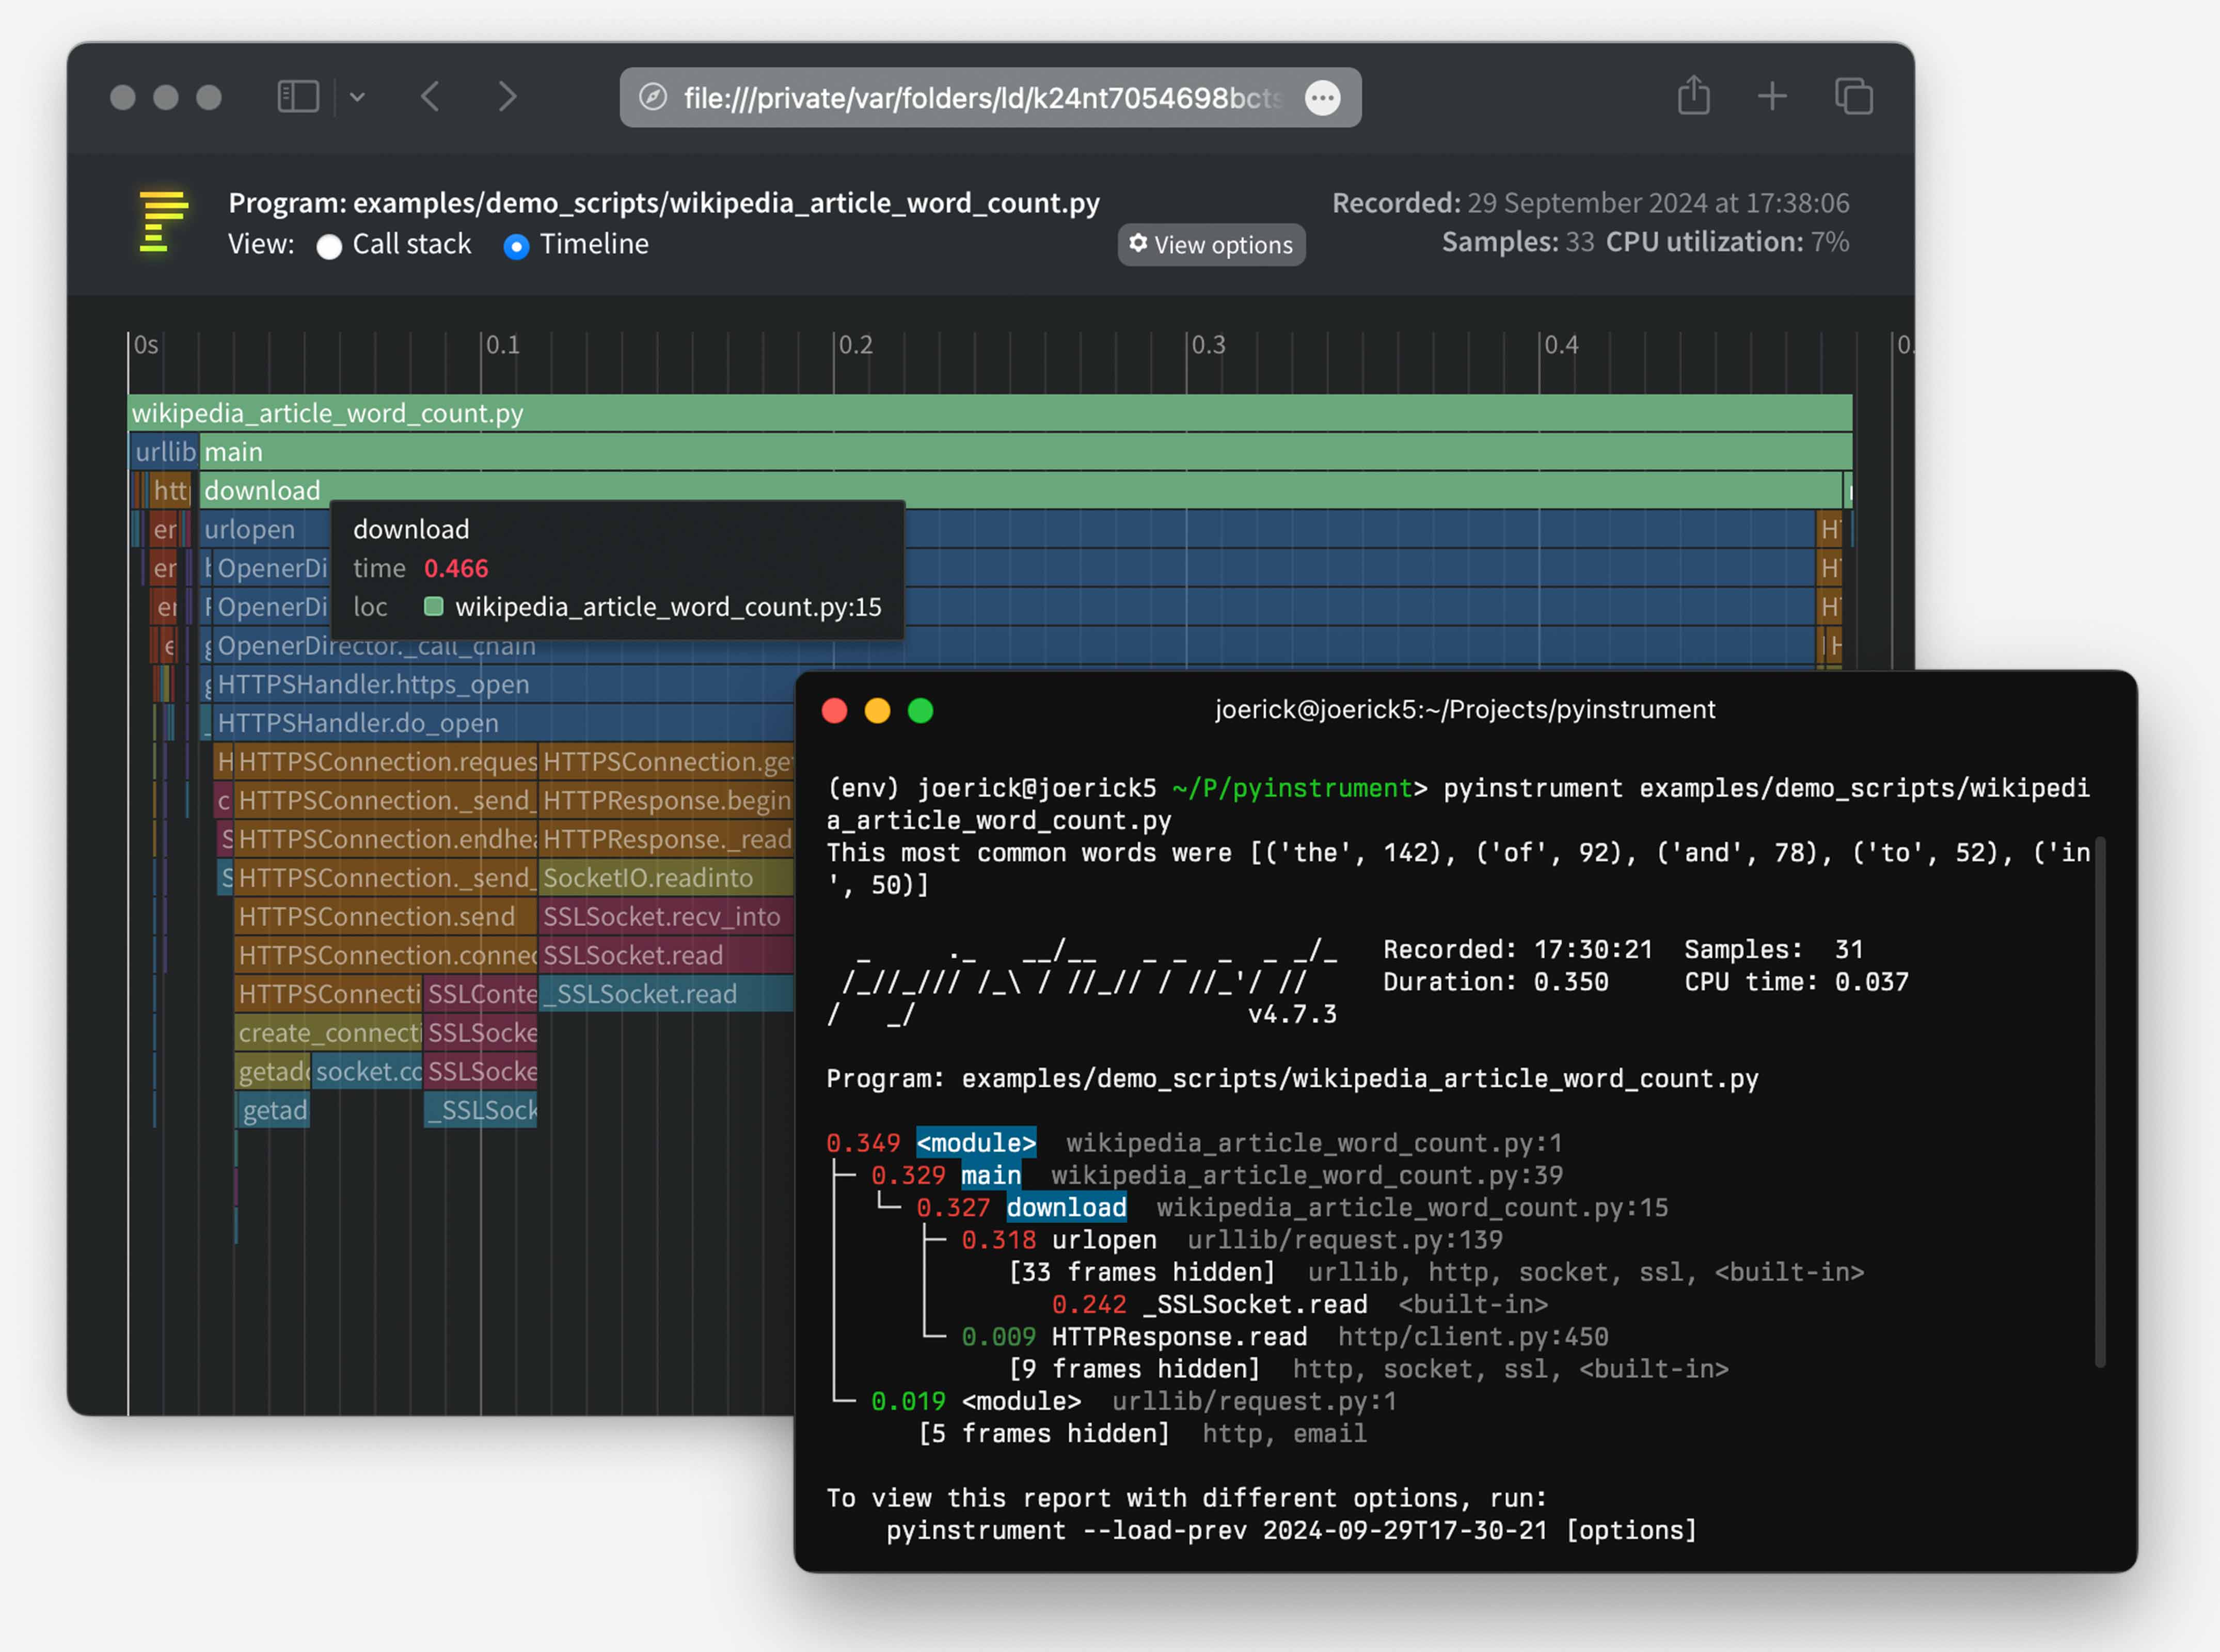
Pyinstrument is a Python profiler. A profiler is a tool to help you optimize your code - make it faster. To get the biggest speed increase you should focus on the slowest part of your program. Pyinstrument helps you find it!
☕️ Not sure where to start? Check out this video tutorial from calmcode.io!
pip install pyinstrument
Pyinstrument supports Python 3.8+.
To run Pyinstrument from a git checkout, there's a build step. Take a look at Contributing for more info.
To learn how to use pyinstrument, or to check the reference, head to the documentation.
pyinstrument script.py where script.py contains a class
serialized with pickle, you might encounter errors because the
serialisation machinery doesn't know where __main__ is. See this issue
for workarounds11 October 2024
Loads of improvements to the HTML renderer!
Timeline mode - see and zoom into an interactive linear timeline!
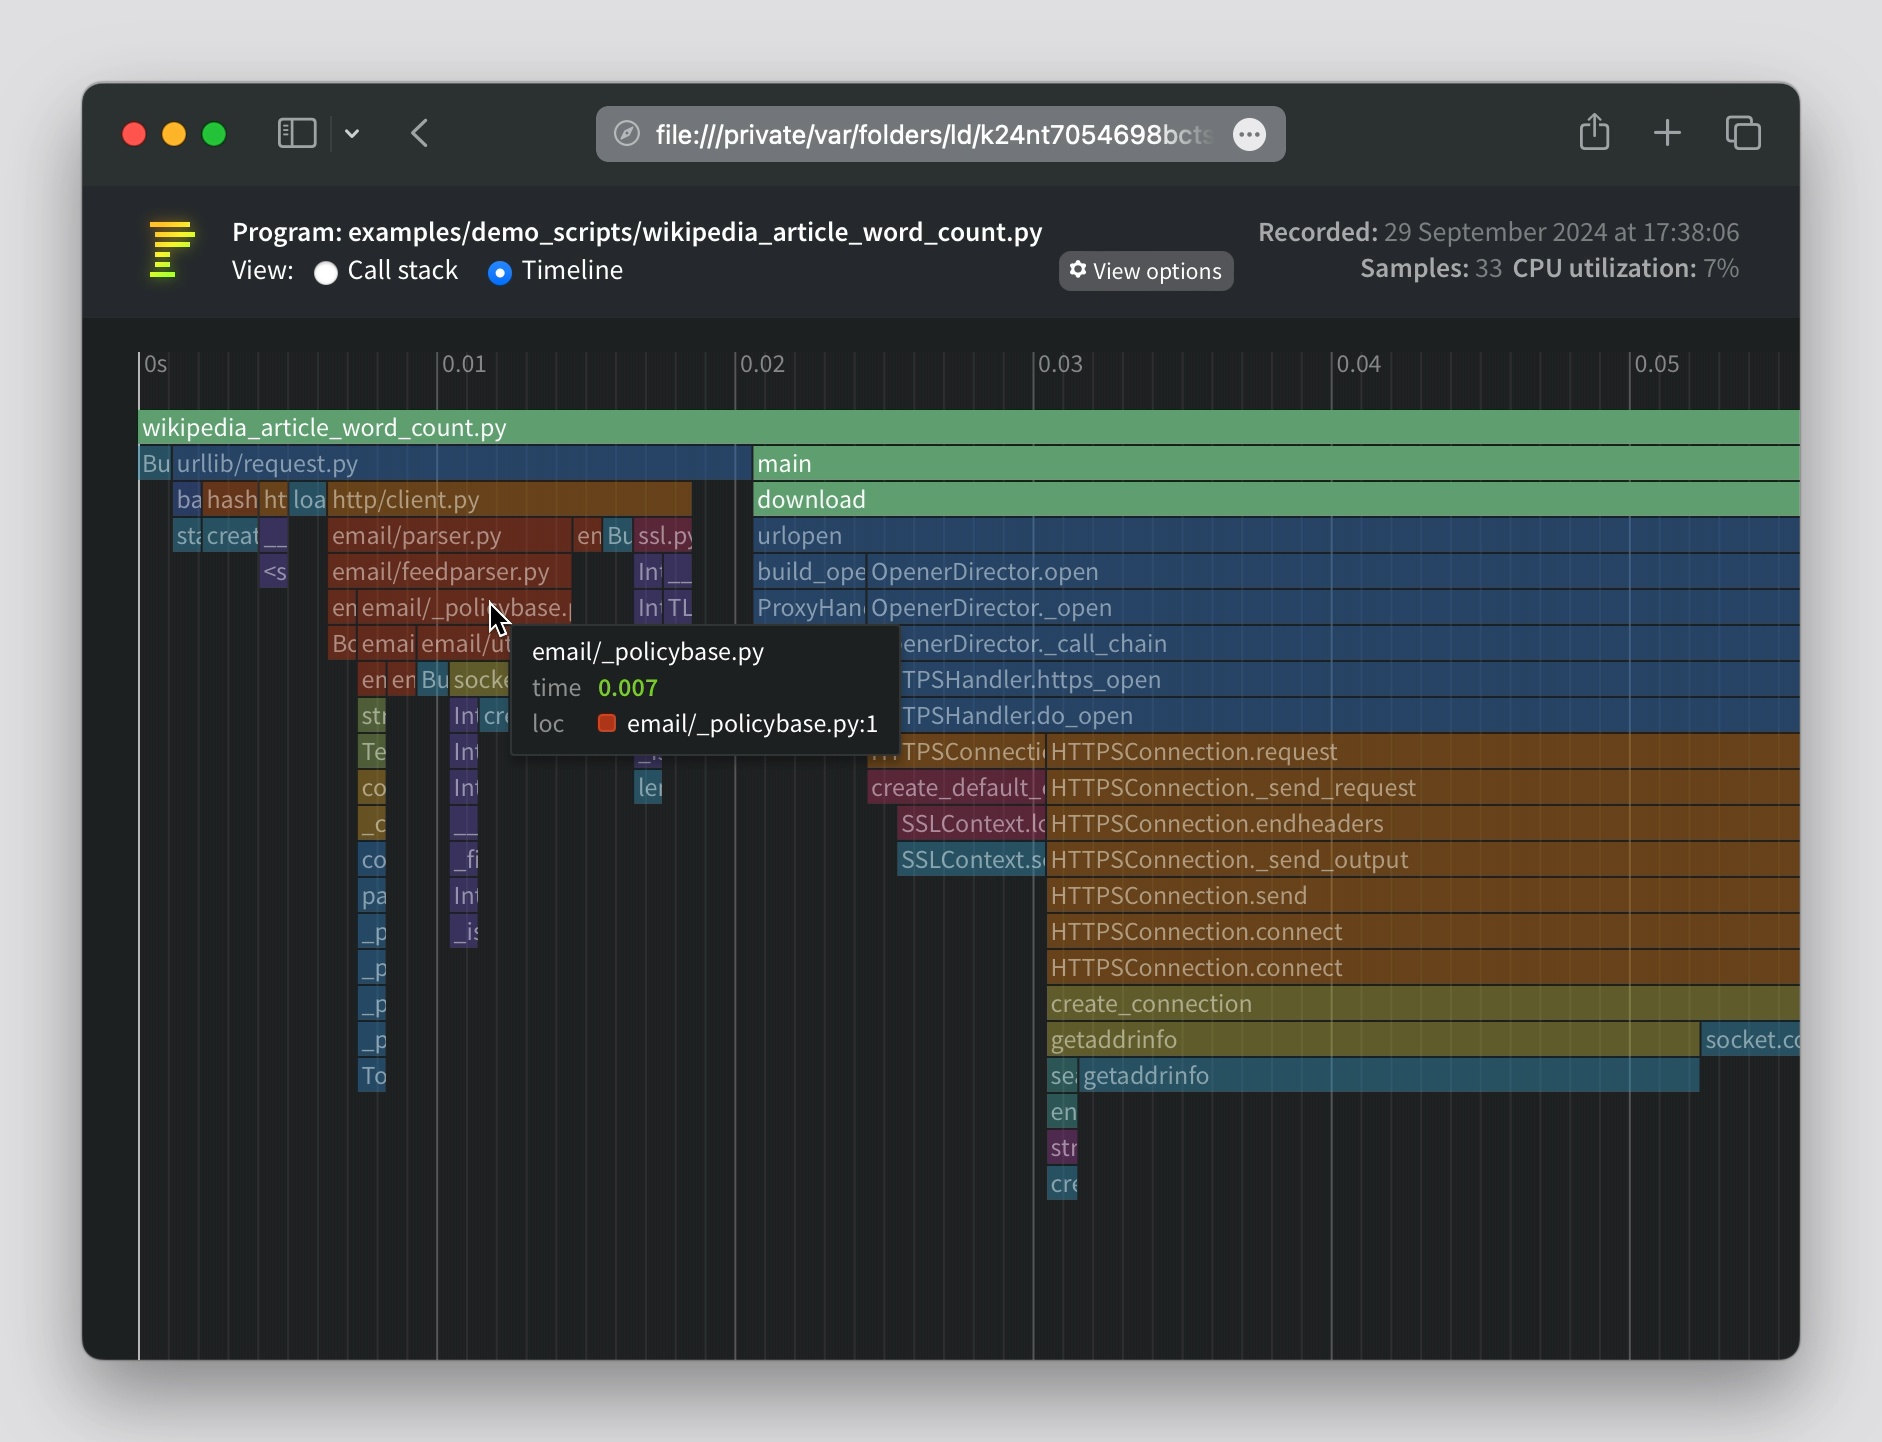
HTML mode now has interactive options, rather than needing to set the upfront.
Streamlined the design of the HTML page header.
HTML Call stack view supports arrow key navigation.
The way ‘library’ code is detected has been changed. Previously, if the string ‘/lib/’ occurred in the file path, that was considered library code (and collapsed by default). Now, pyinstrument captures the paths of the Python install and any active virtualenv/conda env at profile time. Files that are stored there are considered library. That should give fewer false positives.
Calls to profiler.start() can now pass a target_description parameter, which is displayed in the profile readout.
Check my blog post for more info on the new features.
6 September 2024
glom on Python 3.12 or later, which mutate the locals() dict. (#336)UnicodeDecodeError on some platforms (#330)5 August 2024
2 August 2024
1 August 2024
with block, or a function/method decorator. This will profile the code and print a short readout into the terminal. (#327)flat argument to the console output, to present a flat list of functions (#294)26 January 2024
show_all option to Profiler.output_html8 November 2023
%pyinstrument (#278)12 October 2023
-c, which allows profiling code directly from the command line, like python -c. (#271)Profiler.write_html, for writing HTML output to a file directly. (#266)7 September 2023
1 September 2023
22 July 2023
[X frames hidden] in the output when frames were deleted due to __tracebackhide__ (#255)None in the console output (#254)5 June 2023
-p flat on the command line. This mode shows the heaviest frame as measured by self-time, which can be useful in some codebases. (#240)pstats files. This is the file format used by cprofile in the stdlib. It's less detailed than pyinstrument profiles, but it's compatible with more tools. (#236)--show-all option - pyinstrument will no longer remove Python-internal frames when this option is supplied. (#239)5 November 2022
__traceback_hide__ local variable will now be removed from the output (#217)--async_mode=enabled flag. (#212)21 August 2022
--interval (seconds, default 0.001) to change the interval that
pyinstrument samples a program. This is useful for long-running programs,
where increasing the interval reduces the memory overhead.Adds a command-line option -p --render-option that allows arbitrary
setting of render options. This lets you set options like
filter_threshold from the command line, by doing something like
pyinstrument -p processor_options.filter_threshold=0.
Here's the help output for the option:
  -p RENDER_OPTION, --render-option=RENDER_OPTION
                    options to pass to the renderer, in the format
                    'flag_name' or 'option_name=option_value'. For
                    example, to set the option 'time', pass '-p
                    time=percent_of_total'. To pass multiple options, use
                    the -p option multiple times. You can set processor
                    options using dot-syntax, like '-p
                    processor_options.filter_threshold=0'. option_value is
                    parsed as a JSON value or a string.
Adds the ability to view times in the console output as percentages,
rather than absolute times. Use the ConsoleRenderer option
time='percent_of_total', or on the command line, use -p, like
pyinstrument -p time=percent_of_total.
Adds command line options for loading and saving pyinstrument sessions.
You can save the raw data for a pyinstrument session with -r session,
like pyinstrument -r session -o session.pyisession myscript.py. Loading
is via --load, e.g. pyinstrument --load session.pyisession.
Command line output format is inferred from the -o output file
extension. So if you do pyinstrument -o profile.html myscript.py, you
don't need to supply -r html, pyinstrument will automatically use the
HTML renderer. Or if you do
pyinstrument -o profile.pyisession myscript.py, it will save a raw
session object.
Adds usage examples for FastAPI and pytest to the documentation.
Fixes a bug causing NotImplementedError when using async_mode=strict.
Adds support for Python 3.11
%load_ext pyinstrument at the top of your notebook, and then
%%pyinstrument in the cell you want to profile.pyinstrument -r speedscope, and upload to the
speedscope web app.PYINSTRUMENT_PROFILE_DIR_RENDERER option.Async support! Pyinstrument now detects when an async task hits an await, and tracks time spent outside of the async context under this await.
So, for example, here's a simple script with an async task that does a sleep:
import asyncio
from pyinstrument import Profiler

async def main():
    p = Profiler(async_mode='disabled')

    with p:
        print('Hello ...')
        await asyncio.sleep(1)
        print('... World!')

    p.print()

asyncio.run(main())
Before Pyinstrument 4.0.0, we'd see only time spent in the run loop, like this:
  _     ._   __/__   _ _  _  _ _/_   Recorded: 18:33:03  Samples:  2
 /_//_/// /_ / //_// / //_'/ //     Duration: 1.006     CPU time: 0.001
/   _/                      v3.4.2

Program: examples/async_example_simple.py

1.006 _run_once  asyncio/base_events.py:1784
└─ 1.005 select  selectors.py:553
      [3 frames hidden]  selectors,
         1.005 kqueue.control  :0
Now, with pyinstrument 4.0.0, we get:
  _     ._   __/__   _ _  _  _ _/_   Recorded: 18:30:43  Samples:  2
 /_//_/// /_ / //_// / //_'/ //     Duration: 1.007     CPU time: 0.001
/   _/                      v4.0.0

Program: examples/async_example_simple.py

1.006 main  async_example_simple.py:4
└─ 1.005 sleep  asyncio/tasks.py:641
      [2 frames hidden]  asyncio
         1.005 [await]
For more information, check out the async profiling documentation and the Profiler.async_mode property.
Pyinstrument has a documentation site, including full Python API docs!
--show, --show-regex, --show-all to be ignored
on the command line.timeline option (boolean) to Profiler methods output_html() and
open_in_browser().pyinstrument -m module, where pyinstrument wouldn't find
modules in the current directory.Python -> C -> Python is recorded as
Python -> Python, but Python -> Python -> C will be attributed correctly.
(#103)<__array_function__ internals> frames appearing as app code in reports--show and --show-regex options, to mark certain files to be
displayed. This helps to profile inside specific modules, while hiding
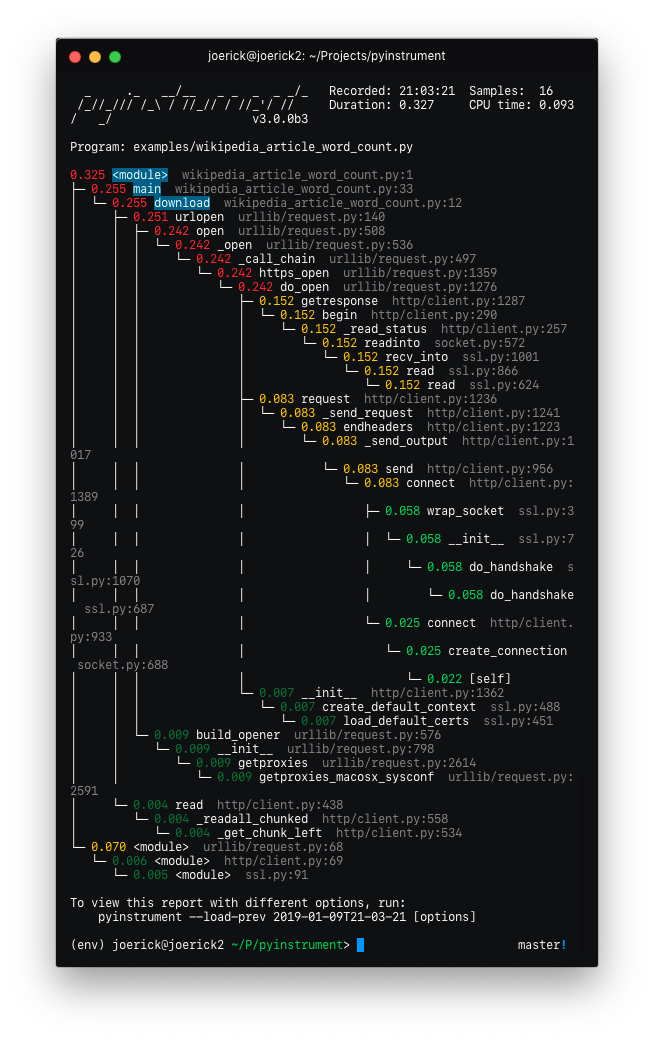
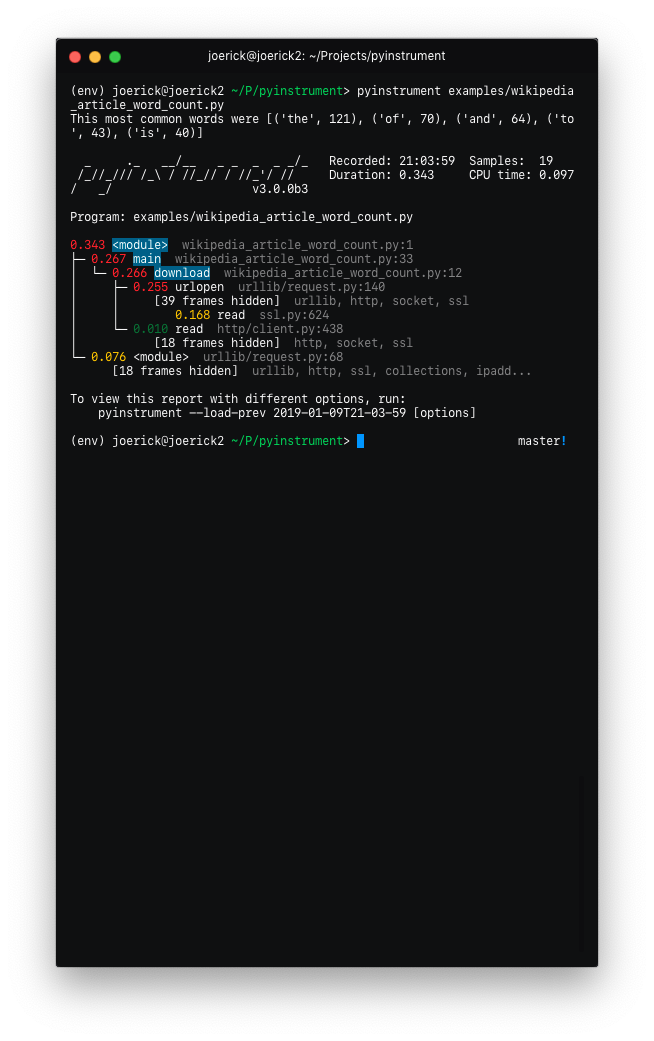
others. For example, pyinstrument --show '*/sympy/*' script.py.Pyinstrument will now hide traces through libraries that you're using by default. So instead of showing you loads of frames going through the internals of something external e.g. urllib, it lets you focus on your code.
| Before | After |
|---|---|
 |
 |
To go back to the old behaviour, use --show-all on the command line.
'Entry' frames of hidden groups are shown, so you know which call is the problem
Really slow frames in the groups are shown too, e.g. the 'read' call on the socket
Application code is highlighted in the console
Additional metrics are shown at the top of the trace - timestamp, number of samples, duration, CPU time
Hidden code is controlled by the --hide or --hide-regex options - matching on the path of the code files.
  --hide=EXPR           glob-style pattern matching the file paths whose
                        frames to hide. Defaults to '*/lib/*'.
  --hide-regex=REGEX    regex matching the file paths whose frames to hide.
                        Useful if --hide doesn't give enough control.
Outputting a timeline is supported from the command line.
  -t, --timeline        render as a timeline - preserve ordering and don't
                        condense repeated calls
Because there are a few rendering options now, you can load a previous profiling session using --load-prev - pyinstrument keeps the last 10 sessions.
Hidden groups can also call back into application code, that looks like this:
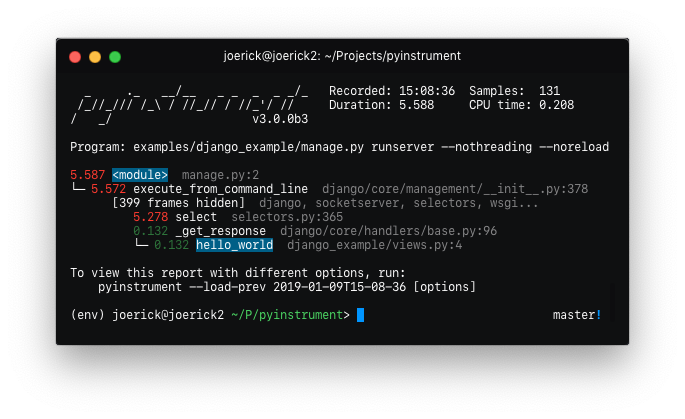
(internal) When recording timelines, frame trees are completely linear now, allowing for the creation of super-accurate frame charts.
(internal) The HTML renderer has been rewritten as a Vue.js app. All the console improvements apply to the HTML output too, plus it's interactive.
(internal) A lot of unit and integration tests added!
Yikes! See #49 for the gory details. I hope you like it.
Recorders have been removed. The frame recording is now internal to the Profiler object.
This means the 'frame' objects are more general-purpose, which paves the way for...--version command line optionAdded support for JSON output. Use pyinstrument --renderer=json scriptfile.py.
PR
@iddan has put together an interactive viewer using the JSON output!
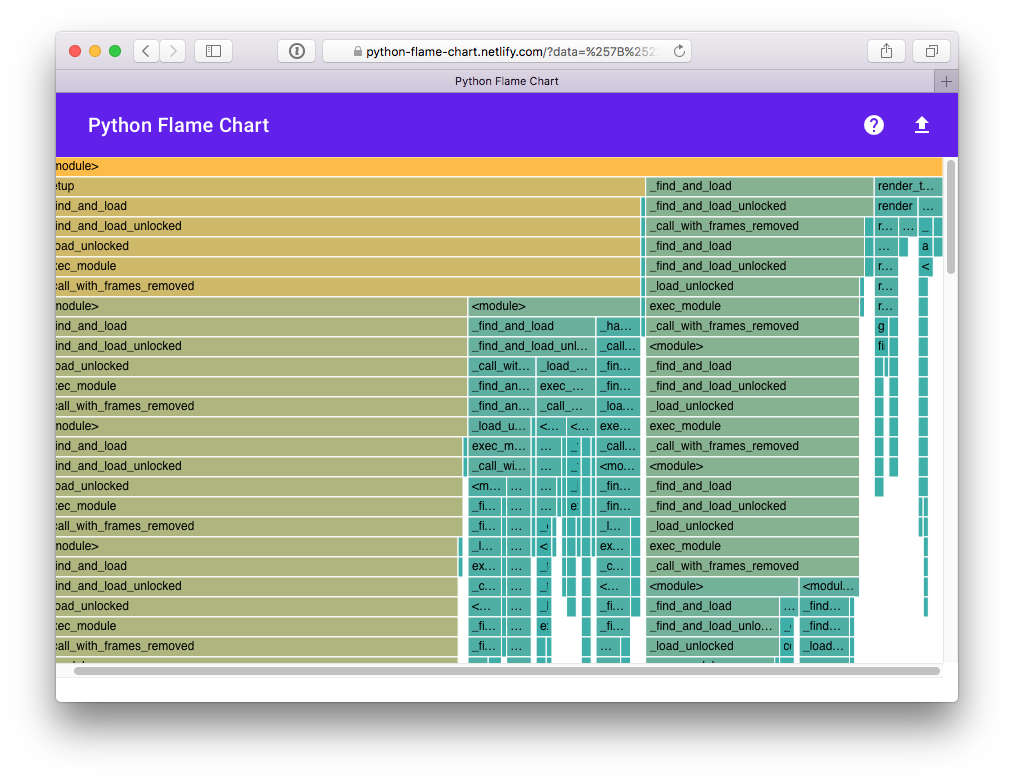
When running pyinstrument --html and you don't pipe the output to a file, pyinstrument will write the console output to a temp file and open that in a browser.
-m flag e.g. pyinstrument -m module_name! PRPyinstrument can now be used in a with block.
For example:
profiler = pyinstrument.Profiler()
with profiler:
    # do some work here...
print(profiler.output_text())
Middleware fix for older versions of Django
Pyinstrument uses a new profiling mode. Rather than using signals, pyintrument uses a new statistical profiler built on PyEval_SetProfile. This means no more main thread restriction, no more IO errors when using Pyinstrument, and no need for a separate more 'setprofile' mode!
Renderers. Users can customize Pyinstrument to use alternative renderers
with the renderer argument on Profiler.output(), or using the --renderer
argument on the command line.
Recorders. To support other use cases of Pyinstrument (e.g. flame charts), pyinstrument now has a 'timeline' recorder mode. This mode records captured frames in a linear way, so the program execution can be viewed on a timeline.
pyinstrument command. You can now profile python scripts from the shell
by running $ pyinstrument script.py. This is now equivalent to
python -m pyinstrument. Thanks @asmeurer!Application code is highlighted in HTML traces to make it easier to spot
Added PYINSTRUMENT_PROFILE_DIR option to the Django interface, which
will log profiles of all requests to a file the specified folder. Useful
for profiling API calls.
Added PYINSTRUMENT_USE_SIGNAL option to the Django interface, for use
when signal mode presents problems.
To setup a dev environment:
virtualenv --python=python3 env
. env/bin/activate
pip install --upgrade pip
pip install -r requirements-dev.txt
pre-commit install --install-hooks
To get some sample output:
pyinstrument examples/wikipedia_article_word_count.py
To run the tests:
pytest
To run linting checks locally:
pre-commit run --all-files
Some of the pre-commit checks, like isort or black, will auto-fix
the problems they find. So if the above command returns an error, try
running it again, it might succeed the second time :)
Running all the checks can be slow, so you can also run checks
individually, e.g., to format source code that fails isort or black
checks:
pre-commit run --all-files isort
pre-commit run --all-files black
To diagnose why pyright checks are failing:
pre-commit run --all-files pyright
The HTML renderer works by embedding a JSON representation of the sample with a Javascript 'bundle' inside an HTML file that can be viewed in any web browser.
To edit the html renderer style, do:
cd html_renderer
npm ci
npm run serve
When launched without a top-level window.profileSession object, it will
fetch a sample profile so you can work with it.
To compile the JS app and bundle it back into the pyinstrument python tool:
bin/build_js_bundle.py [--force]