devextreme chart configure svg patterns
1.0.0
This example demonstrates how to customize the Chart appearance by configuring different SVG patterns:
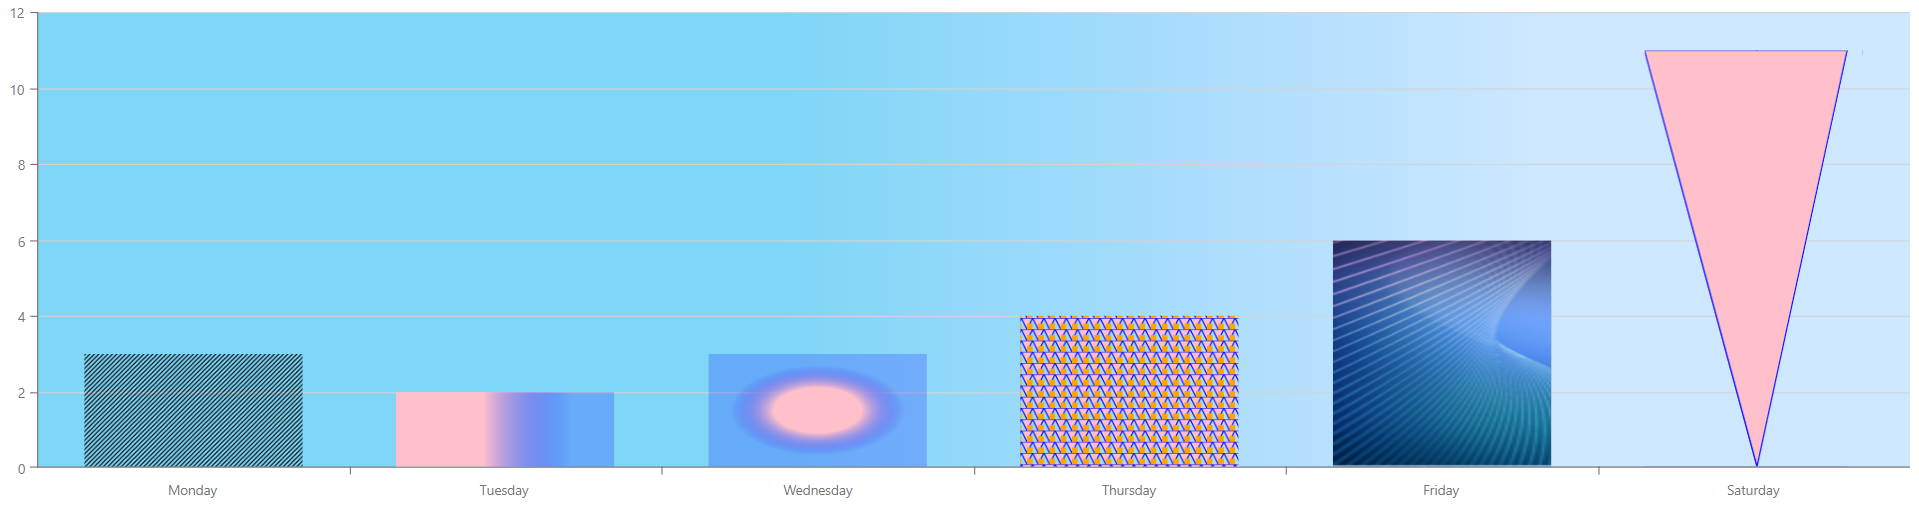
You can implement this functionality in various ways. For example, add the customizePoint function and assign the pattern reference to the required point color.
You can also add patterns directly to the Chart color options. For example, use the series.color property.
If it's necessary to add a gradient pattern as a background color, pass it to the commonPaneSettings.backgroundColor property.
(you will be redirected to DevExpress.com to submit your response)


