shelly_pro3em_monitoring
1.0.0
This Python script is designed to collect metrics from a Shelly Shelly Pro 3EM device
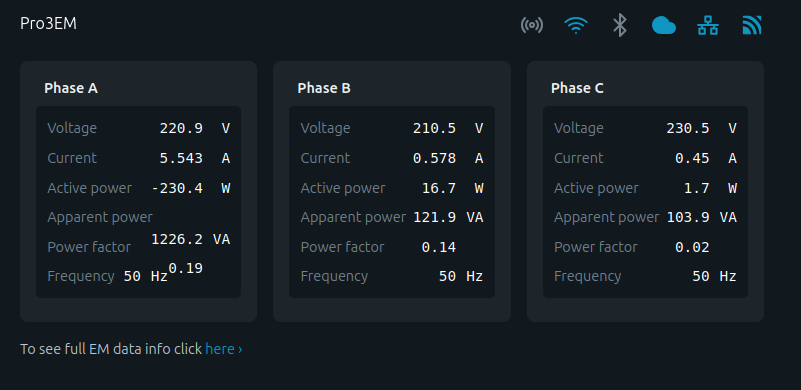
and expose them to Prometheus for monitoring. The script uses Flask to create a web server that Prometheus can scrape for metrics, and the Prometheus client library to define and update the metrics.
Python 3.6 or higher
Flask
prometheus_client
requests
Install required packages:
pip install flask prometheus_client requests
Run the script:
python shelly_exporter.py
Verify the script is running: Open a web browser and navigate to http://<your_server_ip>:8004/metrics. You should see the Prometheus metrics being exposed.
Add the following job to your Prometheus configuration file (prometheus.yml):
scrape_configs:
  - job_name: 'shelly'
    static_configs:
      - targets: ['<your_server_ip>:8004']
sudo systemctl restart prometheus
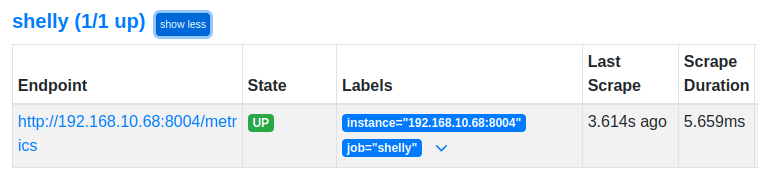
Open Prometheus' web interface and navigate to the "Targets" page (http://<your_prometheus_ip>:9090/targets). Ensure the Shelly exporter target is listed and marked as "UP."
Open Grafana and navigate to "Configuration" > "Data Sources." Click "Add data source" and select "Prometheus." Set the URL to http://<your_prometheus_ip>:9090 and click "Save & Test."
To import the pre-configured Grafana dashboard for monitoring your Shelly Pro 3EM device, follow these steps:
Ensure that your Grafana instance is up and running. The Prometheus data source should be configured in Grafana with metrics from your Shelly Pro 3EM exporter.
Import the Dashboard: In the left-hand menu, click on Create > Import. You will be prompted to either paste the dashboard JSON, upload a JSON file, or enter a Grafana dashboard ID ( 21725 ). Choose the option to upload the shelly_pro_3em_dashboard.json file from your local system.
Configure Data Source: After uploading, you might be prompted to select the Prometheus data source. Choose the correct data source configured for your Shelly Pro 3EM metrics.
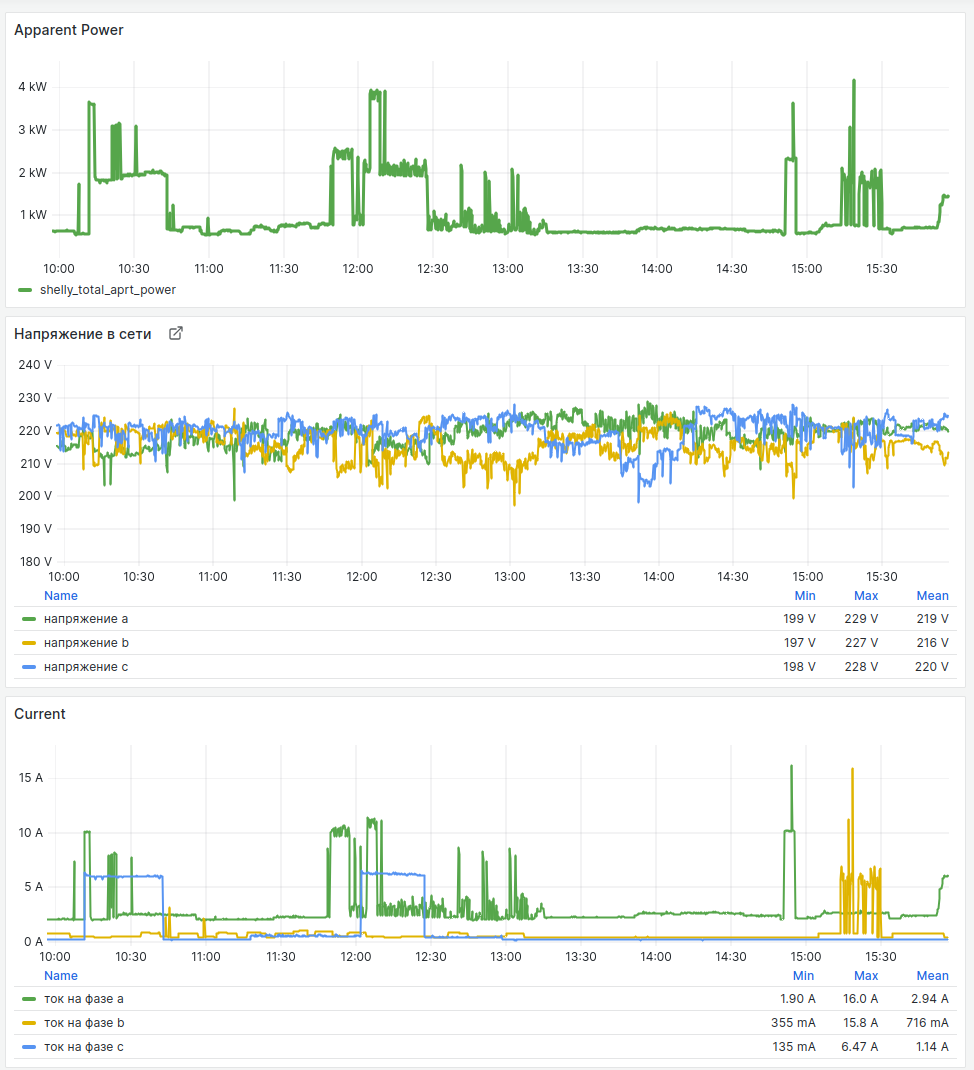
Save and View the Dashboard: Once imported, click Save to save the dashboard. You can now view real-time metrics and historical data from your Shelly Pro 3EM device on the Grafana dashboard.
Customizing the Dashboard The dashboard is fully customizable. You can add, remove, or modify panels according to your needs. For additional configurations or to contribute improvements, feel free to submit a pull request or open an issue.
Click "Save" and give your dashboard a name. You can now monitor your Shelly device metrics in Grafana.
By following these steps, you can monitor the metrics from your Shelly device using Prometheus and Grafana.