pandas ta
v0.3.14b
Pandas Technical Analysis (Pandas TA) is an easy to use library that leverages the Pandas package with more than 130 Indicators and Utility functions and more than 60 TA Lib Candlestick Patterns. Many commonly used indicators are included, such as: Candle Pattern(cdl_pattern), Simple Moving Average (sma) Moving Average Convergence Divergence (macd), Hull Exponential Moving Average (hma), Bollinger Bands (bbands), On-Balance Volume (obv), Aroon & Aroon Oscillator (aroon), Squeeze (squeeze) and many more.
Note: TA Lib must be installed to use all the Candlestick Patterns. pip install TA-Lib. If TA Lib is not installed, then only the builtin Candlestick Patterns will be available.
talib=False.
ta.stdev(df["close"], length=30, talib=False).import_dir documentation under /pandas_ta/custom.py.ta.tsignals method.lookahead=False to disable.Pandas TA checks if the user has some common trading packages installed including but not limited to: TA Lib, Vector BT, YFinance ... Much of which is experimental and likely to break until it stabilizes more.
help(ta.ticker) and help(ta.yf) and examples below.The pip version is the last stable release. Version: 0.3.14b
$ pip install pandas_taBest choice! Version: 0.3.14b
$ pip install -U git+https://github.com/twopirllc/pandas-taThis is the Development Version which could have bugs and other undesireable side effects. Use at own risk!
$ pip install -U git+https://github.com/twopirllc/pandas-ta.git@developmentimport pandas as pd
import pandas_ta as ta
df = pd.DataFrame() # Empty DataFrame
# Load data
df = pd.read_csv("path/to/symbol.csv", sep=",")
# OR if you have yfinance installed
df = df.ta.ticker("aapl")
# VWAP requires the DataFrame index to be a DatetimeIndex.
# Replace "datetime" with the appropriate column from your DataFrame
df.set_index(pd.DatetimeIndex(df["datetime"]), inplace=True)
# Calculate Returns and append to the df DataFrame
df.ta.log_return(cumulative=True, append=True)
df.ta.percent_return(cumulative=True, append=True)
# New Columns with results
df.columns
# Take a peek
df.tail()
# vv Continue Post Processing vvSome indicator arguments have been reordered for consistency. Use help(ta.indicator_name) for more information or make a Pull Request to improve documentation.
import pandas as pd
import pandas_ta as ta

# Create a DataFrame so 'ta' can be used.
df = pd.DataFrame()

# Help about this, 'ta', extension
help(df.ta)

# List of all indicators
df.ta.indicators()

# Help about an indicator such as bbands
help(ta.bbands)Thanks for using Pandas TA!
$ pip install -U git+https://github.com/twopirllc/pandas-taThank you for your contributions!
Pandas TA has three primary "styles" of processing Technical Indicators for your use case and/or requirements. They are: Standard, DataFrame Extension, and the Pandas TA Strategy. Each with increasing levels of abstraction for ease of use. As you become more familiar with Pandas TA, the simplicity and speed of using a Pandas TA Strategy may become more apparent. Furthermore, you can create your own indicators through Chaining or Composition. Lastly, each indicator either returns a Series or a DataFrame in Uppercase Underscore format regardless of style.
You explicitly define the input columns and take care of the output.
sma10 = ta.sma(df["Close"], length=10)
SMA_10
donchiandf = ta.donchian(df["HIGH"], df["low"], lower_length=10, upper_length=15)
DC_10_15 and column names: DCL_10_15, DCM_10_15, DCU_10_15
ema10_ohlc4 = ta.ema(ta.ohlc4(df["Open"], df["High"], df["Low"], df["Close"]), length=10)
EMA_10. If needed, you may need to uniquely name it.Calling df.ta will automatically lowercase OHLCVA to ohlcva: open, high, low, close, volume, adj_close. By default, df.ta will use the ohlcva for the indicator arguments removing the need to specify input columns directly.
sma10 = df.ta.sma(length=10)
SMA_10
ema10_ohlc4 = df.ta.ema(close=df.ta.ohlc4(), length=10, suffix="OHLC4")
EMA_10_OHLC4
close=df.ta.ohlc4().donchiandf = df.ta.donchian(lower_length=10, upper_length=15)
DC_10_15 and column names: DCL_10_15, DCM_10_15, DCU_10_15
Same as the last three examples, but appending the results directly to the DataFrame df.
df.ta.sma(length=10, append=True)
df column name: SMA_10.df.ta.ema(close=df.ta.ohlc4(append=True), length=10, suffix="OHLC4", append=True)
close=df.ta.ohlc4().df.ta.donchian(lower_length=10, upper_length=15, append=True)
df with column names: DCL_10_15, DCM_10_15, DCU_10_15.A Pandas TA Strategy is a named group of indicators to be run by the strategy method. All Strategies use mulitprocessing except when using the col_names parameter (see below). There are different types of Strategies listed in the following section.
# (1) Create the Strategy
MyStrategy = ta.Strategy(
    name="DCSMA10",
    ta=[
        {"kind": "ohlc4"},
        {"kind": "sma", "length": 10},
        {"kind": "donchian", "lower_length": 10, "upper_length": 15},
        {"kind": "ema", "close": "OHLC4", "length": 10, "suffix": "OHLC4"},
    ]
)

# (2) Run the Strategy
df.ta.strategy(MyStrategy, **kwargs)The Strategy Class is a simple way to name and group your favorite TA Indicators by using a Data Class. Pandas TA comes with two prebuilt basic Strategies to help you get started: AllStrategy and CommonStrategy. A Strategy can be as simple as the CommonStrategy or as complex as needed using Composition/Chaining.
df.See the Pandas TA Strategy Examples Notebook for examples including Indicator Composition/Chaining.
{"kind": "indicator name"} attribute. Remember to check your spelling.# Running the Builtin CommonStrategy as mentioned above
df.ta.strategy(ta.CommonStrategy)
# The Default Strategy is the ta.AllStrategy. The following are equivalent:
df.ta.strategy()
df.ta.strategy("All")
df.ta.strategy(ta.AllStrategy)# List of indicator categories
df.ta.categories
# Running a Categorical Strategy only requires the Category name
df.ta.strategy("Momentum") # Default values for all Momentum indicators
df.ta.strategy("overlap", length=42) # Override all Overlap 'length' attributes# Create your own Custom Strategy
CustomStrategy = ta.Strategy(
name="Momo and Volatility",
description="SMA 50,200, BBANDS, RSI, MACD and Volume SMA 20",
ta=[
{"kind": "sma", "length": 50},
{"kind": "sma", "length": 200},
{"kind": "bbands", "length": 20},
{"kind": "rsi"},
{"kind": "macd", "fast": 8, "slow": 21},
{"kind": "sma", "close": "volume", "length": 20, "prefix": "VOLUME"},
]
)
# To run your "Custom Strategy"
df.ta.strategy(CustomStrategy)The Pandas TA strategy method utilizes multiprocessing for bulk indicator processing of all Strategy types with ONE EXCEPTION! When using the col_names parameter to rename resultant column(s), the indicators in ta array will be ran in order.
# VWAP requires the DataFrame index to be a DatetimeIndex.
# * Replace "datetime" with the appropriate column from your DataFrame
df.set_index(pd.DatetimeIndex(df["datetime"]), inplace=True)

# Runs and appends all indicators to the current DataFrame by default
# The resultant DataFrame will be large.
df.ta.strategy()
# Or the string "all"
df.ta.strategy("all")
# Or the ta.AllStrategy
df.ta.strategy(ta.AllStrategy)

# Use verbose if you want to make sure it is running.
df.ta.strategy(verbose=True)

# Use timed if you want to see how long it takes to run.
df.ta.strategy(timed=True)

# Choose the number of cores to use. Default is all available cores.
# For no multiprocessing, set this value to 0.
df.ta.cores = 4

# Maybe you do not want certain indicators.
# Just exclude (a list of) them.
df.ta.strategy(exclude=["bop", "mom", "percent_return", "wcp", "pvi"], verbose=True)

# Perhaps you want to use different values for indicators.
# This will run ALL indicators that have fast or slow as parameters.
# Check your results and exclude as necessary.
df.ta.strategy(fast=10, slow=50, verbose=True)

# Sanity check. Make sure all the columns are there
df.columnsRemember These will not be utilizing multiprocessing
NonMPStrategy = ta.Strategy(
    name="EMAs, BBs, and MACD",
    description="Non Multiprocessing Strategy by rename Columns",
    ta=[
        {"kind": "ema", "length": 8},
        {"kind": "ema", "length": 21},
        {"kind": "bbands", "length": 20, "col_names": ("BBL", "BBM", "BBU")},
        {"kind": "macd", "fast": 8, "slow": 21, "col_names": ("MACD", "MACD_H", "MACD_S")}
    ]
)
# Run it
df.ta.strategy(NonMPStrategy)# Set ta to default to an adjusted column, 'adj_close', overriding default 'close'.
df.ta.adjusted = "adj_close"
df.ta.sma(length=10, append=True)
# To reset back to 'close', set adjusted back to None.
df.ta.adjusted = None# List of Pandas TA categories.
df.ta.categories# Set the number of cores to use for strategy multiprocessing
# Defaults to the number of cpus you have.
df.ta.cores = 4
# Set the number of cores to 0 for no multiprocessing.
df.ta.cores = 0
# Returns the number of cores you set or your default number of cpus.
df.ta.cores# The 'datetime_ordered' property returns True if the DataFrame
# index is of Pandas datetime64 and df.index[0] < df.index[-1].
# Otherwise it returns False.
df.ta.datetime_ordered# Sets the Exchange to use when calculating the last_run property. Default: "NYSE"
df.ta.exchange
# Set the Exchange to use.
# Available Exchanges: "ASX", "BMF", "DIFX", "FWB", "HKE", "JSE", "LSE", "NSE", "NYSE", "NZSX", "RTS", "SGX", "SSE", "TSE", "TSX"
df.ta.exchange = "LSE"# Returns the time Pandas TA was last run as a string.
df.ta.last_run# The 'reverse' is a helper property that returns the DataFrame
# in reverse order.
df.ta.reverse# Applying a prefix to the name of an indicator.
prehl2 = df.ta.hl2(prefix="pre")
print(prehl2.name) # "pre_HL2"
# Applying a suffix to the name of an indicator.
endhl2 = df.ta.hl2(suffix="post")
print(endhl2.name) # "HL2_post"
# Applying a prefix and suffix to the name of an indicator.
bothhl2 = df.ta.hl2(prefix="pre", suffix="post")
print(bothhl2.name) # "pre_HL2_post"# Returns the time range of the DataFrame as a float.
# By default, it returns the time in "years"
df.ta.time_range
# Available time_ranges include: "years", "months", "weeks", "days", "hours", "minutes". "seconds"
df.ta.time_range = "days"
df.ta.time_range # prints DataFrame time in "days" as float# Sets the DataFrame index to UTC format.
df.ta.to_utcimport numpy as np
# Add constant '1' to the DataFrame
df.ta.constants(True, [1])
# Remove constant '1' to the DataFrame
df.ta.constants(False, [1])
# Adding constants for charting
import numpy as np
chart_lines = np.append(np.arange(-4, 5, 1), np.arange(-100, 110, 10))
df.ta.constants(True, chart_lines)
# Removing some constants from the DataFrame
df.ta.constants(False, np.array([-60, -40, 40, 60]))# Prints the indicators and utility functions
df.ta.indicators()
# Returns a list of indicators and utility functions
ind_list = df.ta.indicators(as_list=True)
# Prints the indicators and utility functions that are not in the excluded list
df.ta.indicators(exclude=["cg", "pgo", "ui"])
# Returns a list of the indicators and utility functions that are not in the excluded list
smaller_list = df.ta.indicators(exclude=["cg", "pgo", "ui"], as_list=True)# Download Chart history using yfinance. (pip install yfinance) https://github.com/ranaroussi/yfinance
# It uses the same keyword arguments as yfinance (excluding start and end)
df = df.ta.ticker("aapl") # Default ticker is "SPY"
# Period is used instead of start/end
# Valid periods: 1d,5d,1mo,3mo,6mo,1y,2y,5y,10y,ytd,max
# Default: "max"
df = df.ta.ticker("aapl", period="1y") # Gets this past year
# History by Interval by interval (including intraday if period < 60 days)
# Valid intervals: 1m,2m,5m,15m,30m,60m,90m,1h,1d,5d,1wk,1mo,3mo
# Default: "1d"
df = df.ta.ticker("aapl", period="1y", interval="1wk") # Gets this past year in weeks
df = df.ta.ticker("aapl", period="1mo", interval="1h") # Gets this past month in hours
# BUT WAIT!! THERE'S MORE!!
help(ta.yf)Patterns that are not bold, require TA-Lib to be installed: pip install TA-Lib
# Get all candle patterns (This is the default behaviour)
df = df.ta.cdl_pattern(name="all")

# Get only one pattern
df = df.ta.cdl_pattern(name="doji")

# Get some patterns
df = df.ta.cdl_pattern(name=["doji", "inside"])ta.linreg(series, r=True)
lazybear=True
df.ta.strategy().| Moving Average Convergence Divergence (MACD) |
|---|
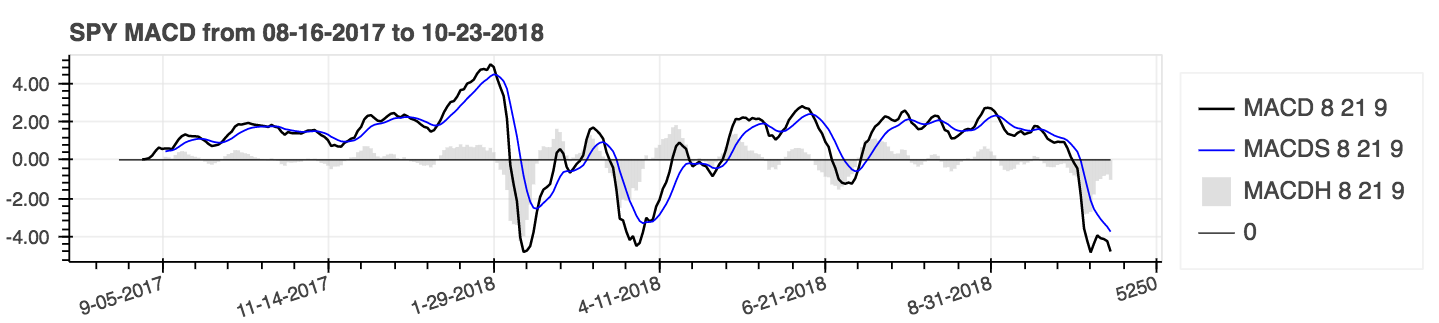 |
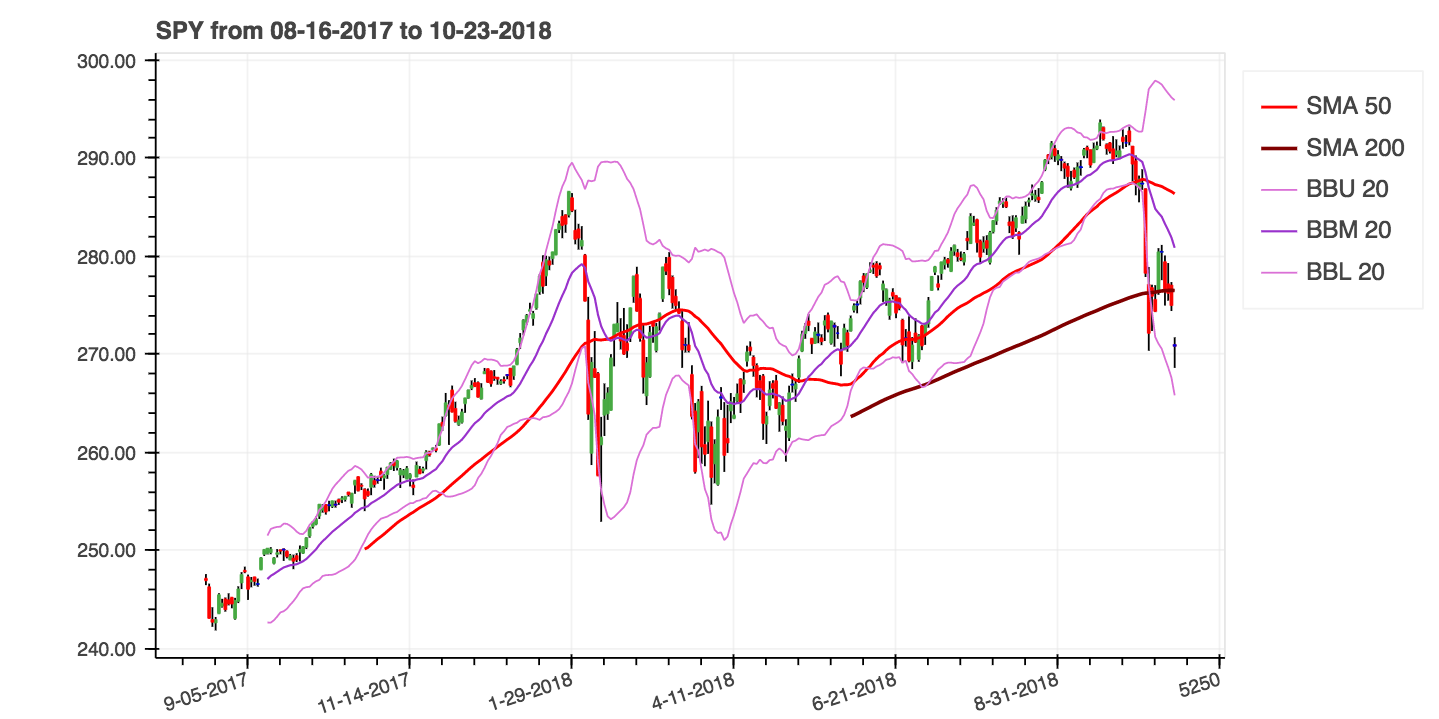
help(ta.ichimoku).lookahead=False drops the Chikou Span Column to prevent potential data leak.| Simple Moving Averages (SMA) and Bollinger Bands (BBANDS) |
|---|
|
Use parameter: cumulative=True for cumulative results.
| Percent Return (Cumulative) with Simple Moving Average (SMA) |
|---|
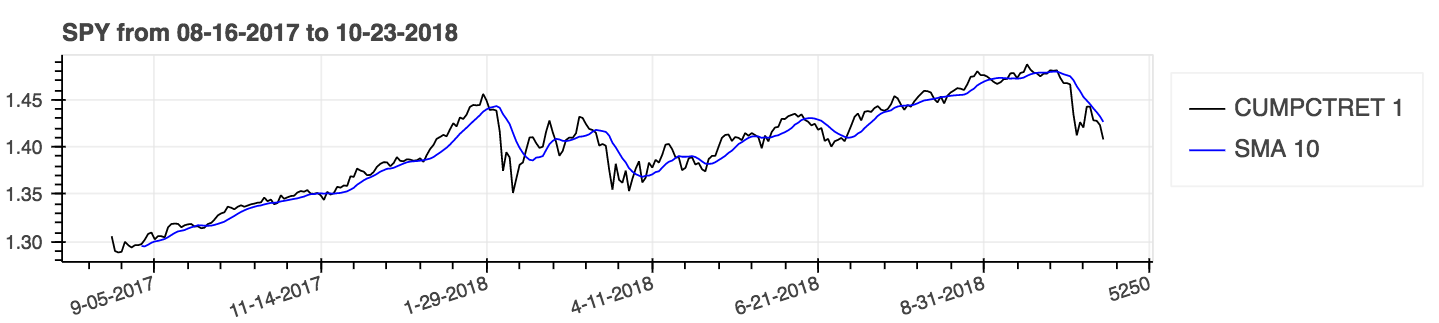 |
| Z Score |
|---|
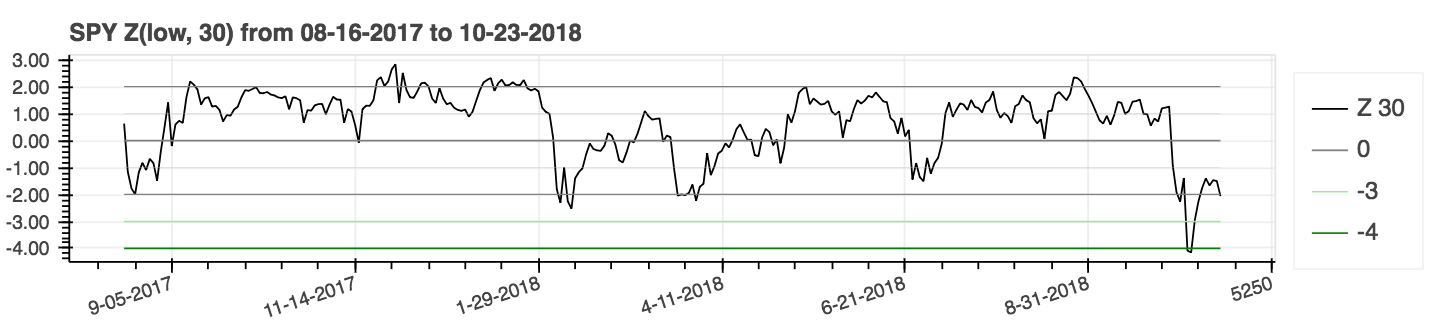 |
lookahead=False to disable centering and remove potential data leak.| Average Directional Movement Index (ADX) |
|---|
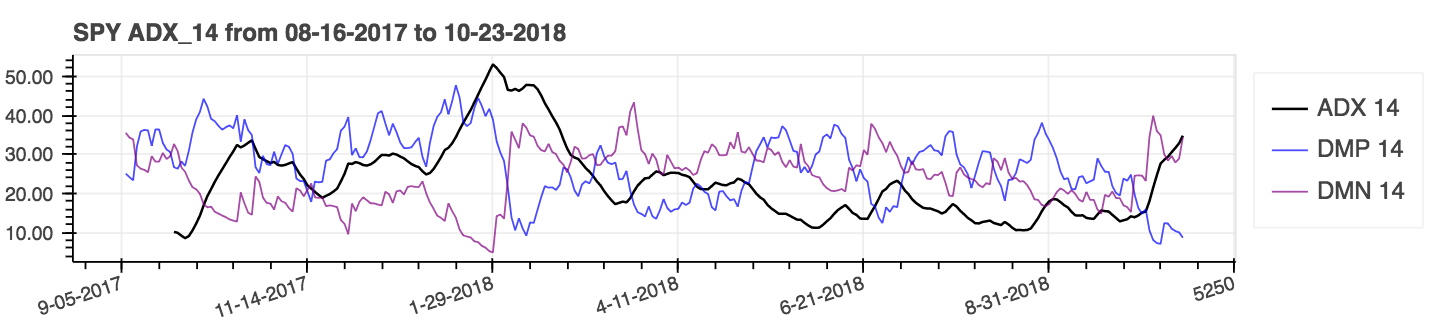 |
| Average True Range (ATR) |
|---|
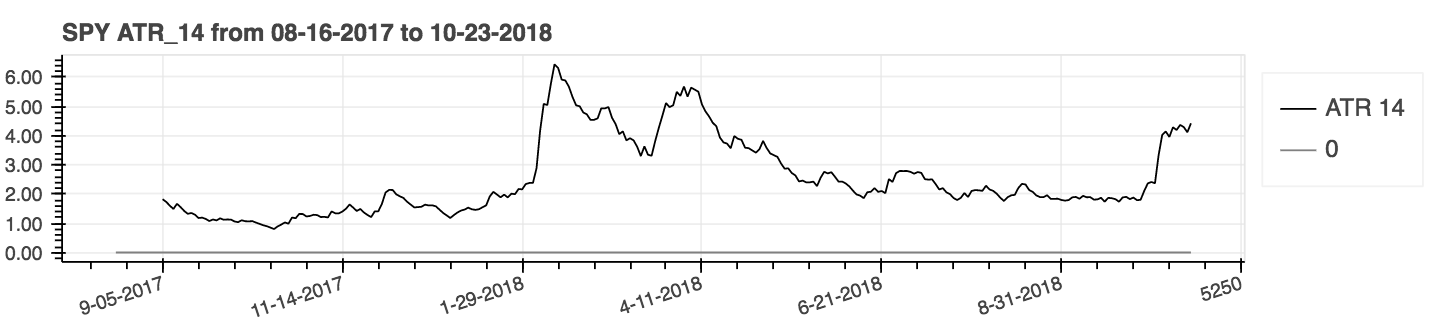 |
| On-Balance Volume (OBV) |
|---|
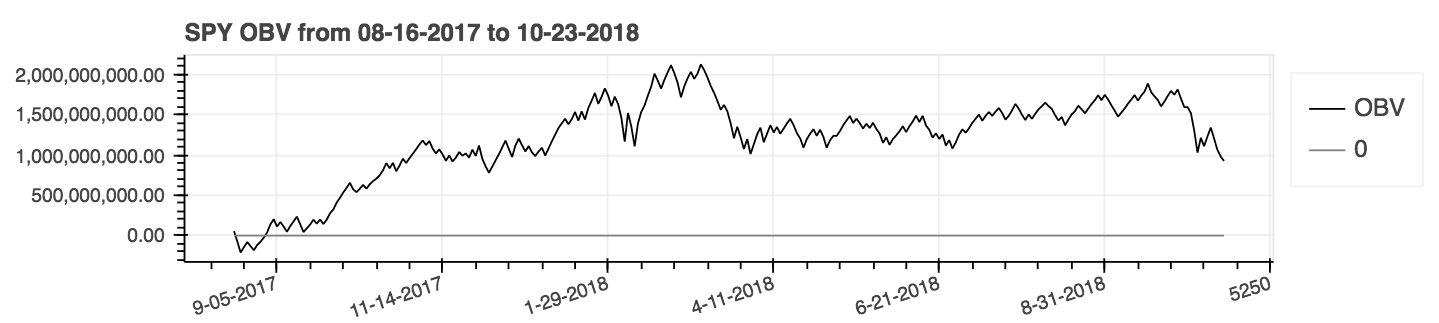 |
Performance Metrics are a new addition to the package and consequentially are likely unreliable. Use at your own risk. These metrics return a float and are not part of the DataFrame Extension. They are called the Standard way. For Example:
import pandas_ta as ta
result = ta.cagr(df.close)For easier integration with vectorbt's Portfolio from_signals method, the ta.trend_return method has been replaced with ta.tsignals method to simplify the generation of trading signals. For a comprehensive example, see the example Jupyter Notebook VectorBT Backtest with Pandas TA in the examples directory.
import pandas as pd
import pandas_ta as ta
import vectorbt as vbt

df = pd.DataFrame().ta.ticker("AAPL") # requires 'yfinance' installed

# Create the "Golden Cross"
df["GC"] = df.ta.sma(50, append=True) > df.ta.sma(200, append=True)

# Create boolean Signals(TS_Entries, TS_Exits) for vectorbt
golden = df.ta.tsignals(df.GC, asbool=True, append=True)

# Sanity Check (Ensure data exists)
print(df)

# Create the Signals Portfolio
pf = vbt.Portfolio.from_signals(df.close, entries=golden.TS_Entries, exits=golden.TS_Exits, freq="D", init_cash=100_000, fees=0.0025, slippage=0.0025)

# Print Portfolio Stats and Return Stats
print(pf.stats())
print(pf.returns_stats())mamode kwarg updated with more moving average choices with the Moving Average Utility function ta.ma(). For simplicity, all choices are single source moving averages. This is primarily an internal utility used by indicators that have a mamode kwarg. This includes indicators: accbands, amat, aobv, atr, bbands, bias, efi, hilo, kc, natr, qqe, rvi, and thermo; the default mamode parameters have not changed. However, ta.ma() can be used by the user as well if needed. For more information: help(ta.ma)
to_utc, to convert the DataFrame index to UTC. See: help(ta.to_utc) Now as a Pandas TA DataFrame Property to easily convert the DataFrame index to UTC.close > sma(close, 50) it returns the Trend, Trade Entries and Trade Exits of that trend to make it compatible with vectorbt by setting asbool=True to get boolean Trade Entries and Exits. See help(ta.tsignals)
help(ta.alma)
trading account, or fund. See help(ta.drawdown)
help(ta.cdl_pattern)
help(ta.cdl_z)
help(ta.cti)
help(ta.xsignals)
help(ta.dm)
help(ta.ebsw)
help(ta.jma)
help(ta.kvo)
help(ta.stc)
help(ta.squeeze_pro)
df.ta.strategy() for performance reasons. See help(ta.td_seq)
help(ta.tos_stdevall)
help(ta.vhf)
mamode renamed to mode. See help(ta.accbands).mamode with default "RMA" and with the same mamode options as TradingView. New argument lensig so it behaves like TradingView's builtin ADX indicator. See help(ta.adx).drift argument and more descriptive column names.mamode is now "RMA" and with the same mamode options as TradingView. See help(ta.atr).ddoff to control the Degrees of Freedom. Also included BB Percent (BBP) as the final column. Default is 0. See help(ta.bbands).ln to use Natural Logarithm (True) instead of the Standard Logarithm (False). Default is False. See help(ta.chop).tvmode with default True. When tvmode=False, cksp implements “The New Technical Trader” with default values. See help(ta.cksp).talib will use TA Lib's version and if TA Lib is installed. Default is True. See help(ta.cmo).strict checks if the series is continuously decreasing over period length with a faster calculation. Default: False. The percent argument has also been added with default None. See help(ta.decreasing).strict checks if the series is continuously increasing over period length with a faster calculation. Default: False. The percent argument has also been added with default None. See help(ta.increasing).help(ta.kvo).as_strided method or the newer sliding_window_view method. This should resolve Issues with Google Colab and it's delayed dependency updates as well as TensorFlow's dependencies as discussed in Issues #285 and #329.asmode enables AS version of MACD. Default is False. See help(ta.macd).sar. New argument af0 to initialize the Acceleration Factor. See help(ta.psar).mamode as an option. Default is sma to match TA Lib. See help(ta.ppo).signal with default 13 and Signal MA Mode mamode with default ema as arguments. See help(ta.tsi).help(ta.vp).help(ta.vwma).anchor. Default: "D" for "Daily". See Timeseries Offset Aliases for additional options. Requires the DataFrame index to be a DatetimeIndex. See help(ta.vwap).help(ta.vwma).Z_length to ZS_length. See help(ta.zscore).Original TA-LIB | TradingView | Sierra Chart | MQL5 | FM Labs | Pro Real Code | User 42
Feeling generous, like the package or want to see it become more a mature package?


