Marketing Attribution Models
1.0.10
Python Class created to address problems regarding Digital Marketing Attribution.
While browsing online, an user has multiple touchpoints before converting, which could lead to ever so longer and more complex journeys.
How to duly credit conversions and optmize investment on media?
To adress this, we apply Attribution Models.
Heuristic Models:
Last Interaction:
Default attribution in Gogle Analytics and other media platforms such as Google Ads and Facebook Business manager;
Only the last touchpoint is credited for the conversion.
Last Click Non-Direct:
All direct traffic is ignored and so 100% of the result goes to the last channel through which the client got to the website before converting.
First Interaction:
The result is wholly attributed to the first touchpoint.
Linear:
Every touchpoint is equally credited.
Time Decay:
The more recent a touchpoint is, the more credit it gets.
Position Based:
In this model, 40% of the result is attributed to the last touchpoint, another 40% to the first and the remaining 20% is equally distributed among the midway channels.
Algotithmic Models
Shapley Value
Used in Game Theory, this value is an estimation of the contribution of each individual player in a cooperative game.
Conversions are credited to the channels by a process of permutating the journeys. In each permutation a channel is given out to estimate how essencial it is overall.
As an example, let's look at the following hypotherical journey:
Organic Search > Facebook > Direct > $19 (as revenue)
To obtain each channel's Shapley Value, we first need to consider all conversion values for the component permutations of this given journey.
Organic Search > $7
Facebook > $6
Direct > $4
Organic Search > Facebook > $15
Organic Search > Direct > $7
Facebook > Direct > $9
Organic Search > Facebook > Direct > $19
The number of component joneys increases exponentially the more distinct channels you have: The rate is 2^n (2 to the power of n) for n channels.
In other words, with 3 distinct touchpoints there are 8 permutations. With over 15, for instance, this process is unfeasible.
By default, the order of the touchpoints isn't taken into consideration when calculating the Shapley Value, only their presence or lack there of. In order to do so, the number of permutations increases.
With that in mind, note that it is pretty difficult to use this model when considering the order of interactions. For n channels, not only there are 2^n permutations of a given channel i, but also every permutation containing i in a different position.
Some issues and limitations of Shapley Value
Markov Chains A Markov Chain is a particular Stochastic process in which the probability distribution of any next state depends only on what the current state is, disregarding any preceeding states and their sequence.
In multichannel attriution, we can use the Markov Chains to calculate the probability of interaction between pairs of media channels with the Transition Matrix.
In regard to each channel's contribution in conversions, the Removal Effect comes in: For each jorney a given channel is removed and a conversion probability is calculated.
The value attributed to a channel, then, is obtained by the ratio of the difference between the probability of conversion in general and the probability once said channel is removed over the general probability again.
In other words, the bigger a channel's removal effect, the larger their contribution is.
**When working with Markovian Processes there are no restrictions due to the quantity or order of channels. Their sequence, itself, is a fundamental part of the algorithm.
>> pip install marketing_attribution_modelsfrom marketing_attribution_models import MAMWhen creating a MAM Object two Data Frame templates can be used as input depending on what is the value of the parameter group_channels.
For this demostration we'll be using a Data Frame in which the journeys are not yet grouped, with each row as a different session and without an unique journey id.
Note: The MAM Class has a built in parameter for journey id creation, create_journey_id_based_on_conversion, that if True, an id is created based on the user id, input in the group_channels_id_list parameter, and the column indicating wether there is a conversion or not, whose name is defined by the journey_with_conv_colname parameter.
In this scenario, all sessions from each distinct user will be ordered and for every conversion a new journey id is created. However, we highly encourage that this journey id creation is customized based on knowledge specific to the business in hand and exploratory conclusions. For instance if in a given business it is noted that the average journey duration is about a week, a new critereon may be defined so that once any user doesn't have any interaction for seven days the journey breaks under the assumption there was a loss of interest.
As for the parameters now, here's how they're configured for our group_ channels = True scenario:
attributions = MAM(df,
    group_channels=True,
    channels_colname = 'channels',
    journey_with_conv_colname= 'has_transaction',
    group_channels_by_id_list=['user_id'],
    group_timestamp_colname = 'visitStartTime',
    create_journey_id_based_on_conversion = True)
In order to explore and understand the capabilities of MAM, a "Random DataFrame Generator" was implemented through the use of random_df parameter when set to True.
attributions = MAM(random_df=True)After the Object MAM is created, we can check out our database now with the addition of our journey_id and with sessions grouped in journeys using the attriute ".DataFrame".
attributions.DataFrame| journey_id | channels_agg | time_till_conv_agg | converted_agg | conversion_value | |
|---|---|---|---|---|---|
| 0 | id:0_J:0 | 0.0 | True | 1 | |
| 1 | id:0_J:1 | Google Search | 0.0 | True | 1 |
| 2 | id:0_J:10 | Google Search > Organic > Email Marketing | 72.0 > 24.0 > 0.0 | True | 1 |
| 3 | id:0_J:11 | Organic | 0.0 | True | 1 |
| 4 | id:0_J:12 | Email Marketing > Facebook | 432.0 > 0.0 | True | 1 |
| ... | ... | ... | ... | ... | ... |
| 20341 | id:9_J:5 | Direct > Facebook | 120.0 > 0.0 | True | 1 |
| 20342 | id:9_J:6 | Google Search > Google Search > Google Search | 48.0 > 24.0 > 0.0 | True | 1 |
| 20343 | id:9_J:7 | Organic > Organic > Google Search > Google Search | 480.0 > 480.0 > 288.0 > 0.0 | True | 1 |
| 20344 | id:9_J:8 | Direct > Organic | 168.0 > 0.0 | True | 1 |
| 20345 | id:9_J:9 | Google Search > Organic > Google Search > Emai... | 528.0 > 528.0 > 408.0 > 240.0 > 0.0 | True | 1 |
This attribute is updated for every attribution model generated. Only in the case of heuristic models, a new column is appended containing the attribution value given by said model.
Note: The attribute .DataFrame does not interfere with any model calculations. Should it be altered by usage, the following results aren't affected.
attributions.attribution_last_click()
attributions.DataFrame| journey_id | channels_agg | time_till_conv_agg | converted_agg | conversion_value | |
|---|---|---|---|---|---|
| 0 | id:0_J:0 | 0.0 | True | 1 | |
| 1 | id:0_J:1 | Google Search | 0.0 | True | 1 |
| 2 | id:0_J:10 | Google Search > Organic > Email Marketing | 72.0 > 24.0 > 0.0 | True | 1 |
| 3 | id:0_J:11 | Organic | 0.0 | True | 1 |
| 4 | id:0_J:12 | Email Marketing > Facebook | 432.0 > 0.0 | True | 1 |
| ... | ... | ... | ... | ... | ... |
| 20341 | id:9_J:5 | Direct > Facebook | 120.0 > 0.0 | True | 1 |
| 20342 | id:9_J:6 | Google Search > Google Search > Google Search | 48.0 > 24.0 > 0.0 | True | 1 |
| 20343 | id:9_J:7 | Organic > Organic > Google Search > Google Search | 480.0 > 480.0 > 288.0 > 0.0 | True | 1 |
| 20344 | id:9_J:8 | Direct > Organic | 168.0 > 0.0 | True | 1 |
| 20345 | id:9_J:9 | Google Search > Organic > Google Search > Emai... | 528.0 > 528.0 > 408.0 > 240.0 > 0.0 | True | 1 |
Usually the volume of data worked with is extensive, so it is impractical or even impossible to analyse results attributed to each journey with transaction. With the attribute group_by_channels_models, however, all results can be seen grouped by channel.
Note: Grouped results do not overwrite each other in case the same model is used in two distinct instances. Both (or even more) of them are shown in "group_by_channels_models".
attributions.group_by_channels_models| channels | attribution_last_click_heuristic |
|---|---|
| Direct | 2133 |
| Email Marketing | 1033 |
| 3168 | |
| Google Display | 1073 |
| Google Search | 4255 |
| 1028 | |
| Organic | 6322 |
| Youtube | 1093 |
As with the .DataFrame attribute, group_by_channels_models is also updated for every model used without the limitation of not displaying algorithmic results.
attributions.attribution_shapley()
attributions.group_by_channels_models| channels | attribution_last_click_heuristic | attribution_shapley_size4_conv_rate_algorithmic | |
|---|---|---|---|
| 0 | Direct | 109 | 74.926849 |
| 1 | Email Marketing | 54 | 70.558428 |
| 2 | 160 | 160.628945 | |
| 3 | Google Display | 65 | 110.649352 |
| 4 | Google Search | 193 | 202.179519 |
| 5 | 64 | 72.982433 | |
| 6 | Organic | 315 | 265.768549 |
| 7 | Youtube | 58 | 60.305925 |
All heuristic models behave the same when using the attributes .DataFrame and .group_by_channels_models, as explained before, and the output of all heuristic model's methods return a tuple containing two pandas Series.
attribution_first_click = attributions.attribution_first_click()The first Series of the tuple are the results in a journey granularity, similar to the observed in the .DataFrame attribute
attribution_first_click[0] 0 [1, 0, 0, 0, 0]
1 [1]
2 [1, 0, 0, 0, 0, 0, 0, 0, 0]
3 [1, 0]
4 [1]
...
20512 [1, 0]
20513 [1, 0, 0]
20514 [1, 0, 0, 0, 0, 0, 0, 0, 0, 0, 0]
20515 [1, 0, 0]
20516 [1, 0, 0, 0]
Length: 20517, dtype: object
The second one contains the results with a channel granularity, as seen in the .group_by_channels_models attribute.
attribution_first_click[1]| channels | attribution_first_click_heuristic | |
|---|---|---|
| 0 | Direct | 2078 |
| 1 | Email Marketing | 1095 |
| 2 | 3177 | |
| 3 | Google Display | 1066 |
| 4 | Google Search | 4259 |
| 5 | 1007 | |
| 6 | Organic | 6361 |
| 7 | Youtube | 1062 |
Of all models present in the Object MAM, only Last Click, First Click and Linear have no customizable parameters but group_by_channels_models, which has a boolean value that when set to False the model doesn't return the attribution goruped by channels.
Created to replicate Google Analytics' default attriution (Last Click Non Direct) in which Direct traffic is overwritten in case previous interations have a specific traffic source other than Direct itself in a given timespan (6 months by default).
If unspecified, the parameter but_not_this_channel is set to 'Direct', but it can be set to any other channel of interest to the business.
attributions.attribution_last_click_non(but_not_this_channel='Direct')[1]| channels | attribution_last_click_non_Direct_heuristic | |
|---|---|---|
| 0 | Direct | 11 |
| 1 | Email Marketing | 60 |
| 2 | 172 | |
| 3 | Google Display | 69 |
| 4 | Google Search | 224 |
| 5 | 67 | |
| 6 | Organic | 350 |
| 7 | Youtube | 65 |
This model has a parameter list_positions_first_middle_last in which the weights respective to the positions of channels in each journey can me specified according to business related decisions. The default distribution of the parameter is 40% for the introducing channel, 40% for the converting / last channel and 20% for the intermidiate ones.
attributions.attribution_position_based(list_positions_first_middle_last=[0.3, 0.3, 0.4])[1]| channels | attribution_position_based_0.3_0.3_0.4_heuristic | |
|---|---|---|
| 0 | Direct | 95.685085 |
| 1 | Email Marketing | 57.617191 |
| 2 | 145.817501 | |
| 3 | Google Display | 56.340693 |
| 4 | Google Search | 193.282305 |
| 5 | 54.678557 | |
| 6 | Organic | 288.148896 |
| 7 | Youtube | 55.629772 |
There are two customizable settings: The decay rate, throght the decay_over_time* parameter, and the time (in hours) between each decaiment through the frequency parameter.
It is worth noting, however, that in case there is more than one touchpoint between frequency intervals the conversion value will be equally distributed among these channels.
As an example:
attributions.attribution_time_decay(
    decay_over_time=0.6,
frequency=7)[1]| channels | attribution_time_decay0.6_freq7_heuristic | |
|---|---|---|
| 0 | Direct | 108.679538 |
| 1 | Email Marketing | 54.425914 |
| 2 | 159.592216 | |
| 3 | Google Display | 64.350107 |
| 4 | Google Search | 192.838884 |
| 5 | 64.611414 | |
| 6 | Organic | 314.920082 |
| 7 | Youtube | 58.581845 |
Uppon being called, this model returns a tuple with four components. The first two (indexed 0 and 1) are just like with the heuristic models, with the representation of the .DataFrame and .group_by_channels_models respectively. As for the third and fourth components (indexed 2 and 3) the results are the transition matrix and the removal effect table.
To start off, it is possible to indicate if same state transitions are considered or not (e.g. Direct to Direct).
attribution_markov = attributions.attribution_markov(transition_to_same_state=False)| channels | attribution_markov_algorithmic | |
|---|---|---|
| 0 | Direct | 2305.324362 |
| 1 | Email Marketing | 1237.400774 |
| 2 | 3273.918832 | |
| 3 | Youtube | 1231.183938 |
| 4 | Google Search | 4035.260685 |
| 5 | 1205.949095 | |
| 6 | Organic | 5358.270644 |
| 7 | Google Display | 1213.691671 |
This configuration does not affect the overall attributed results for each channel, but the values observed in the transition matrix. Because we set transition_to_same_state to False, the diagonal, indicating states transitioning to themselves, is nulled.
ax, fig = plt.subplots(figsize=(15,10))
sns.heatmap(attribution_markov[2].round(3), cmap="YlGnBu", annot=True, linewidths=.5)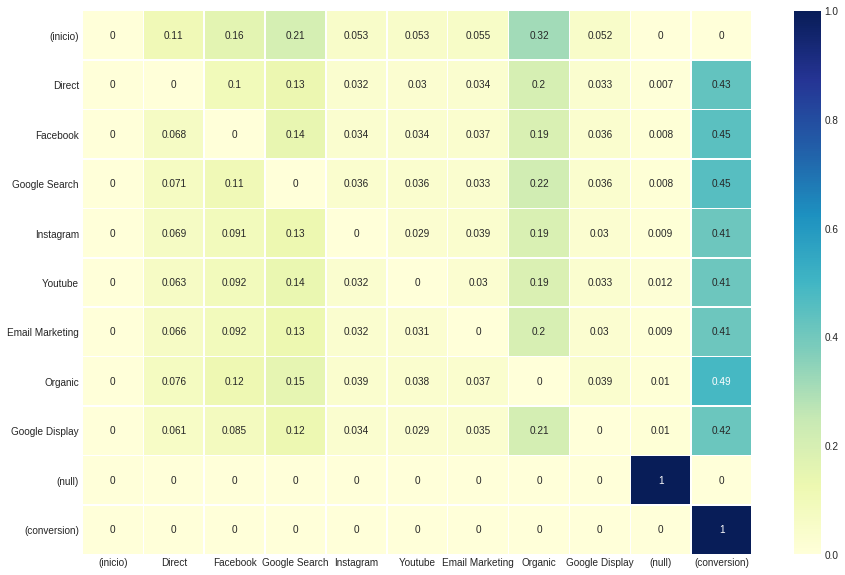
Removal Effect, the fourth attribution_markov output, is obtained by the ratio of the difference between the probability of conversion in general and the probability once said channel is removed over the general probability again.
ax, fig = plt.subplots(figsize=(2,5))
sns.heatmap(attribution_markov[3].round(3), cmap="YlGnBu", annot=True, linewidths=.5)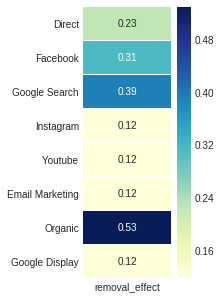
Finally, the second algorith model of MAM whose concept comes from Game Theory. The objective here is to distribute the contribution of each player (in our case, channel) in a game of cooperation calculated using combinations of journeys with and without a given channel.
The parameter size defines a limit of how long a chain of channels is in every journey. By default, it's value is set to 4, meaning only the four last channels preceding a conversion are considered.
The calculation method of marginal contributions of each channel can vary with the order parameter. By default it is set to False, which means the contribution is calculated disregarding the order of each channel in the journeys.
attributions.attribution_shapley(size=4, order=True, values_col='conv_rate')[0]| combinations | conversions | total_sequences | conversion_value | conv_rate | attribution_shapley_size4_conv_rate_order_algorithmic | |
|---|---|---|---|---|---|---|
| 0 | Direct | 909 | 926 | 909 | 0.981641 | [909.0] |
| 1 | Direct > Email Marketing | 27 | 28 | 27 | 0.964286 | [13.948270234099155, 13.051729765900845] |
| 2 | Direct > Email Marketing > Facebook | 5 | 5 | 5 | 1.000000 | [1.6636366232390172, 1.5835883671498818, 1.752... |
| 3 | Direct > Email Marketing > Facebook > Google D... | 1 | 1 | 1 | 1.000000 | [0.2563402919193473, 0.2345560799963515, 0.259... |
| 4 | Direct > Email Marketing > Facebook > Google S... | 1 | 1 | 1 | 1.000000 | [0.2522517802130265, 0.2401286956930936, 0.255... |
| ... | ... | ... | ... | ... | ... | ... |
| 1278 | Youtube > Organic > Google Search > Google Dis... | 1 | 2 | 1 | 0.500000 | [0.2514214624662836, 0.24872101523605275, 0.24... |
| 1279 | Youtube > Organic > Google Search > Instagram | 1 | 1 | 1 | 1.000000 | [0.2544401477637237, 0.2541071889956603, 0.253... |
| 1280 | Youtube > Organic > Instagram | 4 | 4 | 4 | 1.000000 | [1.2757196742326997, 1.4712839059493295, 1.252... |
| 1281 | Youtube > Organic > Instagram > Facebook | 1 | 1 | 1 | 1.000000 | [0.2357631944623868, 0.2610913781266248, 0.247... |
| 1282 | Youtube > Organic > Instagram > Google Search | 3 | 3 | 3 | 1.000000 | [0.7223482210689489, 0.7769049003203142, 0.726... |
Finally, the parameter indicating what metric is used to calculate the Shapley Value is values_col, which by default is set to conversion rate. In doing so, journeys without conversions are taken into acount.
It is possible, however, to consider only literal conversions when using the model as seen below.
attributions.attribution_shapley(size=3, order=False, values_col='conversions')[0]| combinations | conversions | total_sequences | conversion_value | conv_rate | attribution_shapley_size3_conversions_algorithmic | |
|---|---|---|---|---|---|---|
| 0 | Direct | 11 | 18 | 18 | 0.611111 | [11.0] |
| 1 | Direct > Email Marketing | 4 | 5 | 5 | 0.800000 | [2.0, 2.0] |
| 2 | Direct > Email Marketing > Google Search | 1 | 2 | 2 | 0.500000 | [-3.1666666666666665, -7.666666666666666, 11.8... |
| 3 | Direct > Email Marketing > Organic | 4 | 6 | 6 | 0.666667 | [-7.833333333333333, -10.833333333333332, 22.6... |
| 4 | Direct > Facebook | 3 | 4 | 4 | 0.750000 | [-8.5, 11.5] |
| ... | ... | ... | ... | ... | ... | ... |
| 75 | Instagram > Organic > Youtube | 46 | 123 | 123 | 0.373984 | [5.833333333333332, 34.33333333333333, 5.83333... |
| 76 | Instagram > Youtube | 2 | 4 | 4 | 0.500000 | [2.0, 0.0] |
| 77 | Organic | 64 | 92 | 92 | 0.695652 | [64.0] |
| 78 | Organic > Youtube | 8 | 11 | 11 | 0.727273 | [30.5, -22.5] |
| 79 | Youtube | 11 | 15 | 15 | 0.733333 | [11.0] |
After obtaining every attribution from different models stored in our .group_by_channels_models object it is possible to plot and compare results for insights
attributions.plot()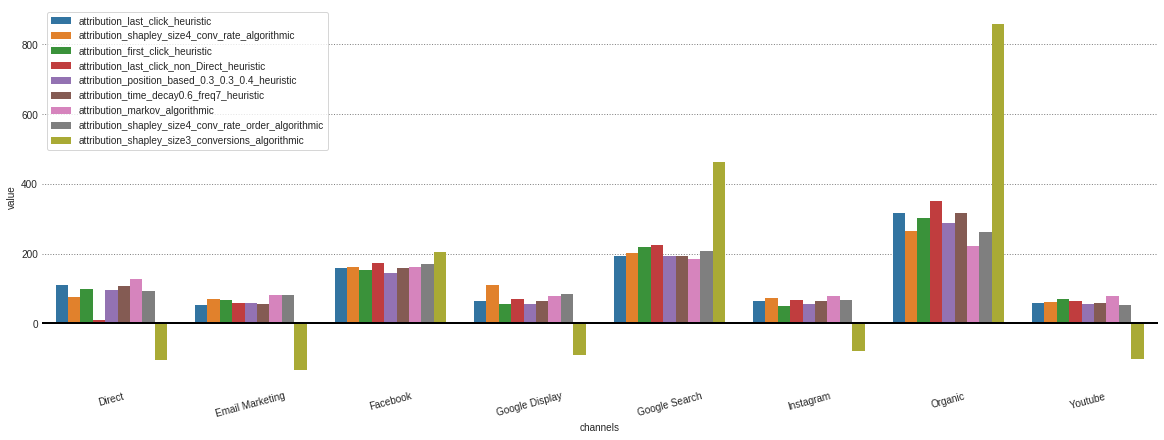
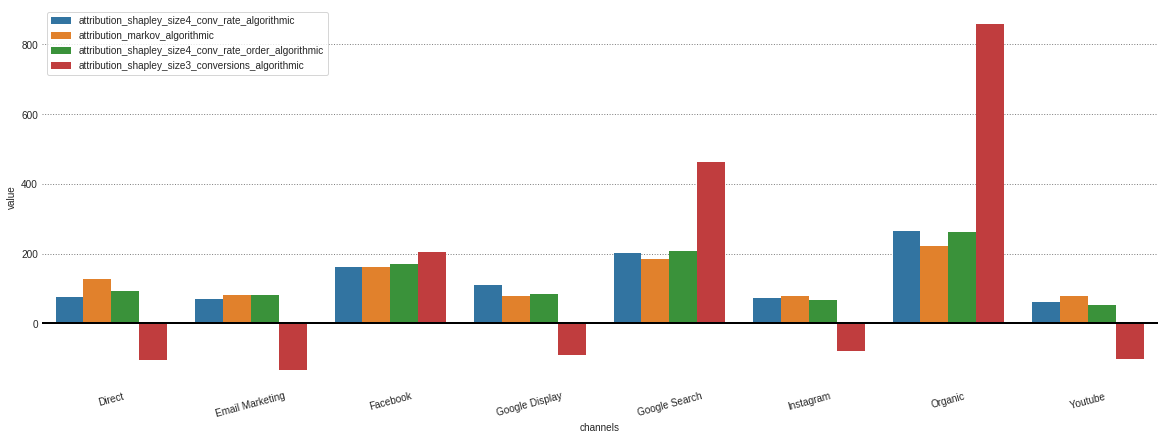
In case you're only interested in the algorithmic models, this can me specified in the model_type parameter.
attributions.plot(model_type='algorithmic')