equivalence testing multiple regression
1.0.0
Equivalence testing can be applied to evaluate whether an observed effect from an individual predictor in a multiple regression model is small enough to be considered statistically and practically negligible (Alter & Counsell, 2021). For more information, please refer to the OSF page and/or a freely available preprint on PsyArXiv.
The following functions offer appropriate equivalence-based alternatives for concluding negligible effect between a predictor and outcome in multiple regression
These R functions are designed to accommodate multiple research contexts
effortlessly, with or without access to the full dataset. The two
functions, reg.equiv.fd() and reg.equiv(), provide similar output
but differ on the type of input information required by the user.
Specifically, the first function, reg.equiv.fd(), requires the full
dataset and model in R (lm object), whereas the second does not. The
reg.equiv() is intended for researchers who do not have access to the
complete dataset but still wish to evaluate a certain predictor’s lack
of association with the outcome variable in multiple regression, for
example, using information typically presented in a results section or
table reported in a published article.
reg.equiv.fd(): full dataset requireddatfra= a data frame (e.g., mtcars)model= the model, an lm object (e.g., mod1, where
mod1<- mpg~hp+cyl)delta= the smallest effect size of interest (SESOI), minimally
meaningful effect size (MMES), or upper bound of the equivalence
interval (?) (e.g., .15)predictor= the name of the predictor to be tested (e.g., "cyl")test= test type is set automatically to Two One-Sided Test (TOST;
Schuirmann, 1987), the other option is the Anderson-Hauck (AH;
Anderson & Hauck, 1983)std= the delta (or, SESOI) is the set as as standardized by
default. Indicate std=FALSE to assume unstandardized unitsalpha= the nominal Type I error rate is set to .05 by default. To
change, simply indicate the alpha level. E.g., alpha=.10reg.equiv.fd() example: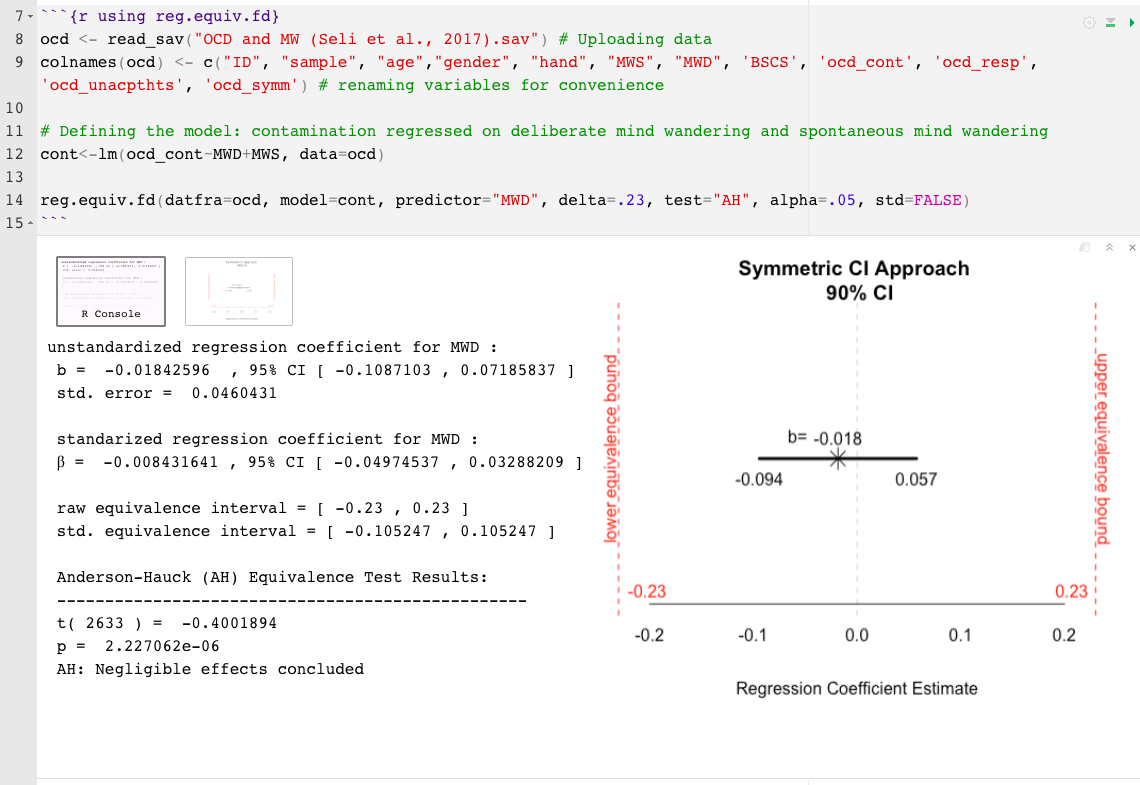
reg.equiv(): full dataset not requiredb= the estimated effect size associated with the predictor of
interest, this could be either standardized or unstandardized (e.g.,
.02)se= the standard error associated with the effect size of the
predictor of interest (if the effect size is standardized, make sure
the se value is tied to the standardized and not the raw effect)p= the number of total predictors in the regression model
(excluding intercept)n= sample sizedelta= the smallest effect size of interest (SESOI), minimally
meaningful effect size (MMES), or upper bound of the equivalence
interval (?) (e.g., .15)predictor= the name of the predictor to be tested (e.g., "cyl")test= test type is set automatically to Two One-Sided Test (TOST;
Schuirmann, 1987), the other option is the Anderson-Hauck (AH;
Anderson & Hauck, 1983)std= the delta (or, SESOI) and the indicated effect size are set
as as standardized by default. Indicate std=FALSE to assume
unstandardized unitsalpha= the nominal Type I error rate is set to .05 by default. To
change, simply indicate the alpha level. E.g., alpha=.10reg.equiv() example: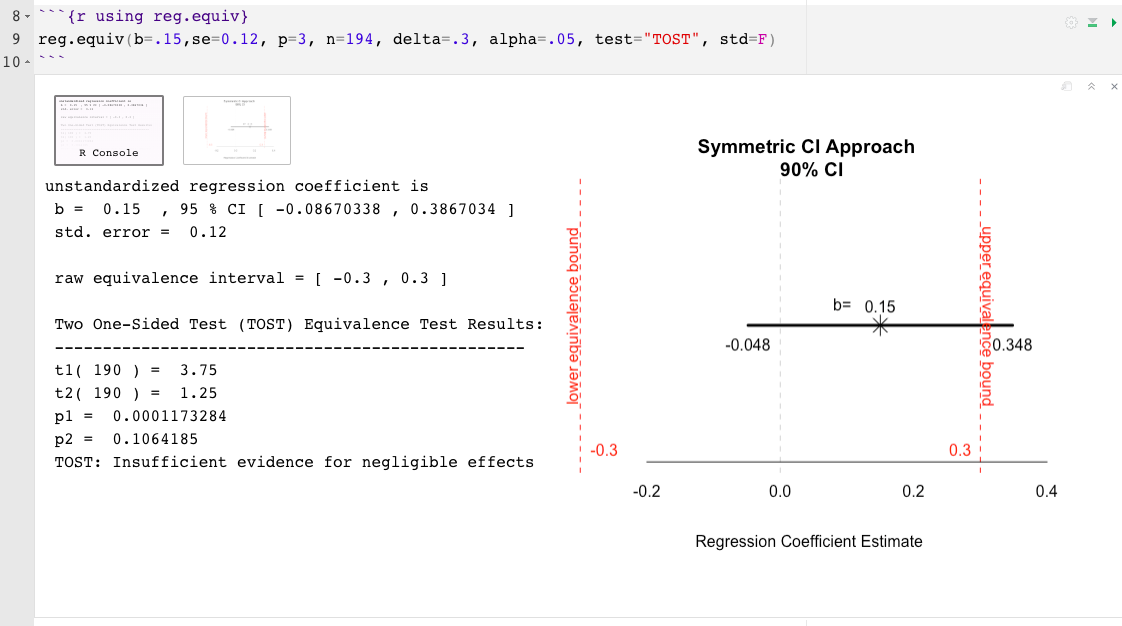
Equivalence testing is a method designed within the null-hypothesis significance testing (NHST) framework. NHST has been heavily criticized for its overreliance on the dichotomous results of p values with little, or no consideration of the effect’s magnitude or its implications in practice (e.g., Cumming, 2012; Fidler & Loftus, 2009; Harlow, 1997; Kirk, 2003; Lee, 2016 2014). Researchers must be mindful of the limitations of NHST, and disentangle the practical and statistical aspects of the test results.
To minimize the limitations of p values, it is more informative to interpret the observed effect’s magnitude and precision beyond the conclusion of “negligible effects” or “insufficient evidence for negligible effects.” Observed effects should be construed in relation to the equivalence bounds, the extent of their uncertainty, and their practical implications (or lack thereof). For this reason, the two R functions offered here also include a graphical representation of the observed effect and its associated uncertainty in relation to the equivalence interval. The resulting plot aids in illustrating how close or far and wide or narrow the observed effect and its margin of error are from the equivalence bounds; inferring about the proportion and position of the confidence band in relation to the equivalence interval can help interpret the results over and above p values.


