Important
Merci pour votre intérêt pour ce projet. Cependant, sachez que ce référentiel n'est plus maintenu .
Pour tous les besoins critiques, veuillez envisager de fournir le référentiel et de faire vos propres mises à jour.
Avertissement
J'ai de graves préoccupations concernant la validité et l'intégrité des données accès à ce package. J'exhorte les utilisateurs à exercer une extrême prudence et un scepticisme lors de l'utilisation de cet outil et de rechercher des sources alternatives pour leur travail.
C'est le officiel [Remarque: je ne suis plus affilié au World Inequality Lab et je ne peux offrir aucune garantie que la commande restera fonctionnelle à l'avenir] Stata Command of the World Inégality Databity Base (wid.world). Il permet aux utilisateurs de télécharger des données directement à partir de wid.world dans Stata.
Les utilisateurs doivent installer la commande directement à partir de SSC:
ssc install widLa documentation de la commande est disponible après l'installation en utilisant:
help widTracer l'inégalité de richesse à long terme en France:
wid, indicators(shweal) areas(FR) perc(p90p100 p99p100) ages(992) pop(j) clear

// Reshape and plot
reshape wide value, i(year) j(percentile) string
label variable valuep90p100 " Top 10% share "
label variable valuep99p100 " Top 1% share "

graph twoway line value * year, title( " Wealth inequality in France " ) ///
	ylabel(0.2 " 20% " 0.4 " 40% " 0.6 " 60% " 0.8 " 80% " ) ///
	subtitle( " equal-split adults " ) ///
	note( " Source: WID.world " )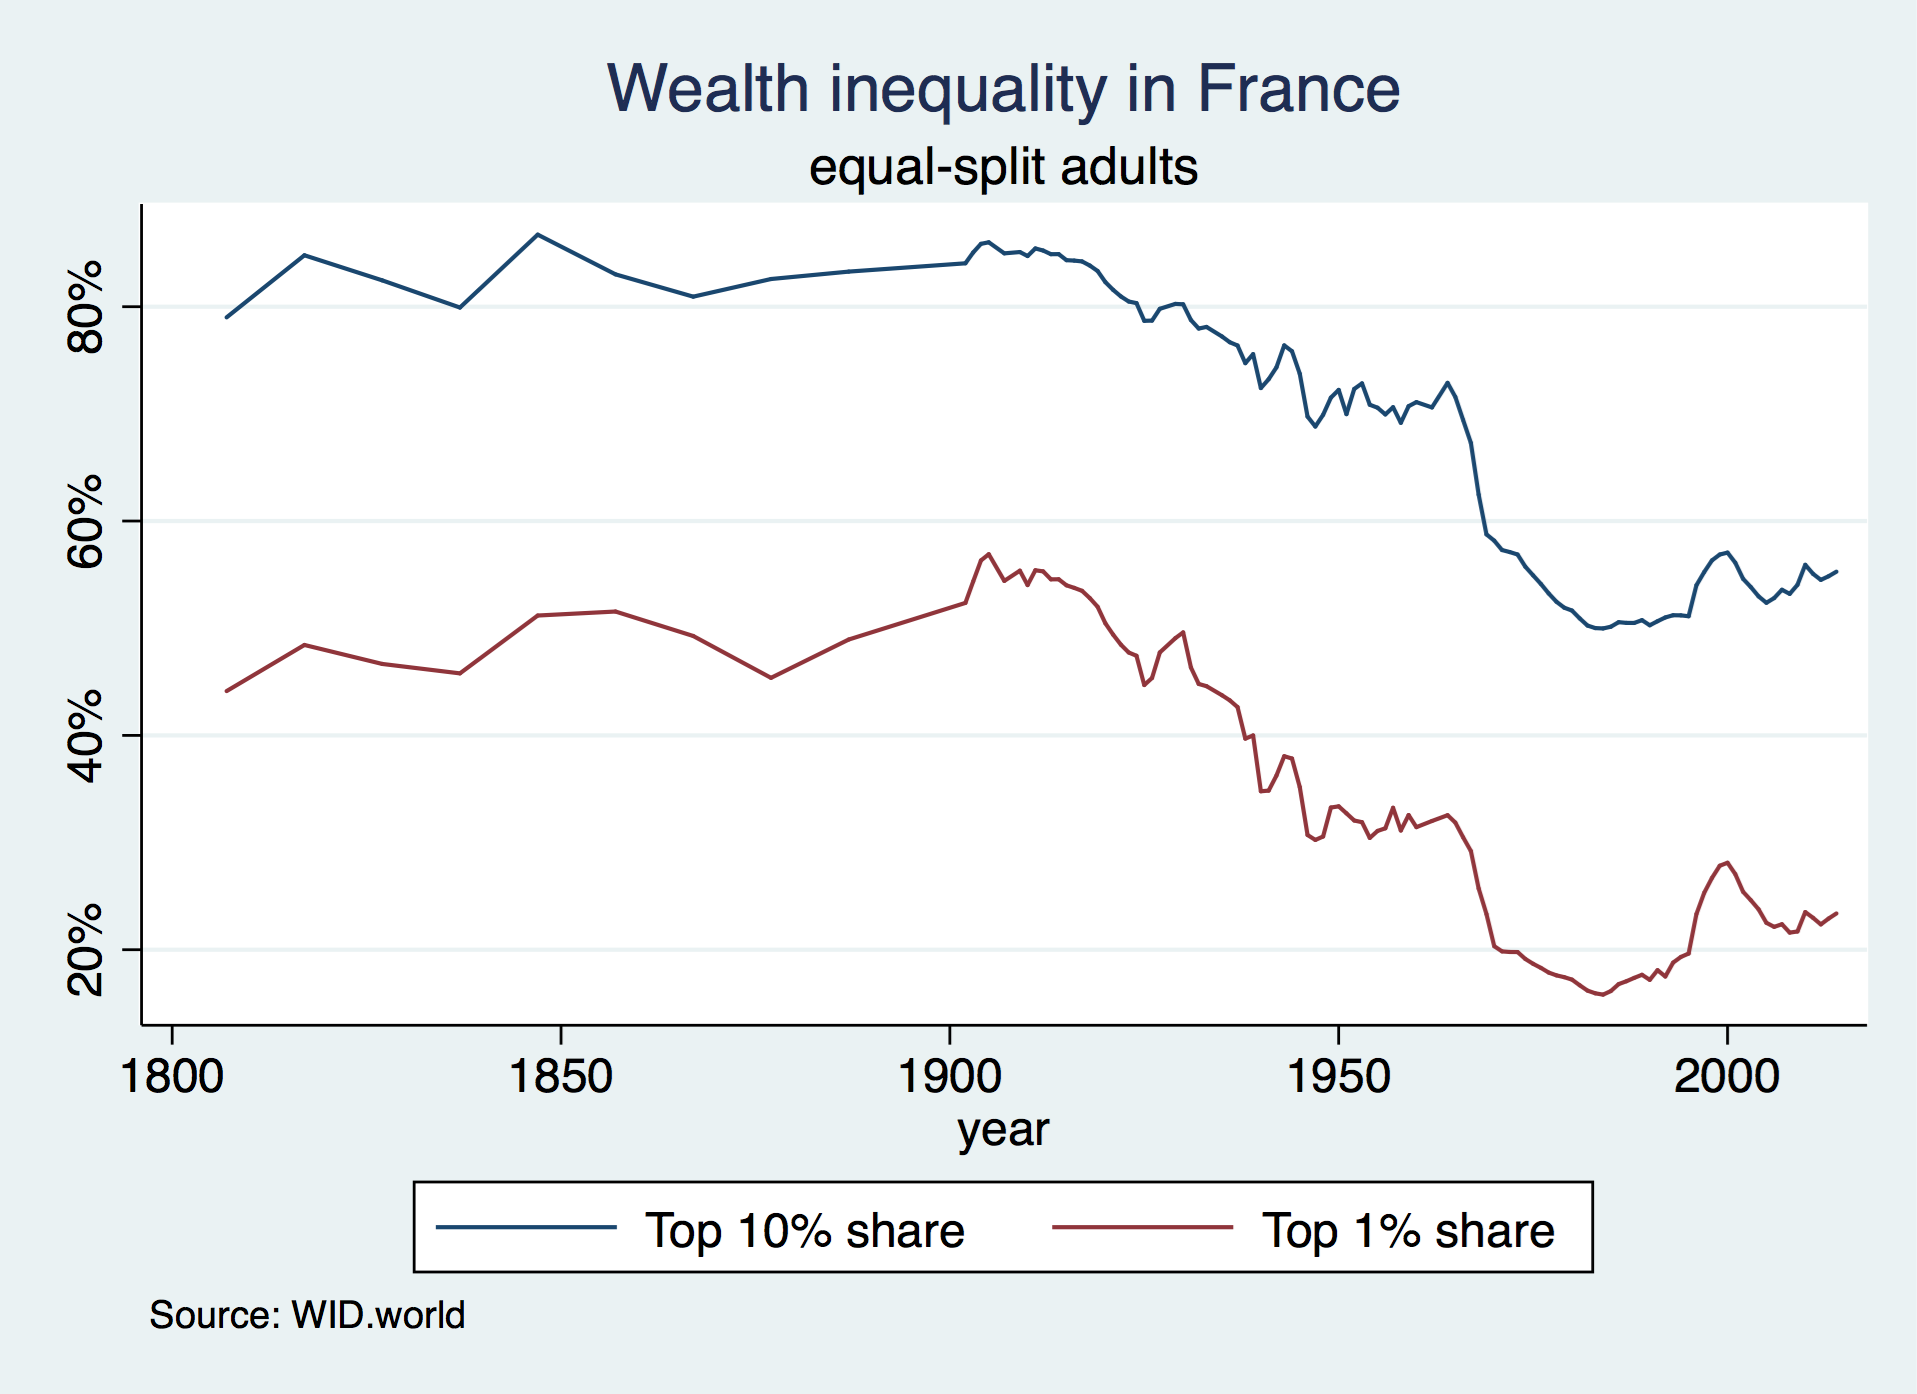
Tracer l'évolution du revenu national avant impôts des 50% inférieurs de la population en Chine, en France et aux États-Unis depuis 1978 (à l'échelle logarithmique):
 // Download and store the 2017 USD PPP exchange rate
wid, indicators(xlcusp) areas(FR US CN) year(2017) clear
rename value ppp
tempfile ppp
save " `ppp' "

wid, indicators(aptinc) areas(FR US CN) perc(p0p50) year(1978 / 2017) ages(992) pop(j) clear
merge n:1 country using " `ppp' " , nogenerate

// Convert to 2017 USD PPP (thousands)
replace value = value/ppp/1000

// Reshape and plot
keep country year value
reshape wide value, i(year) j(country) string
label variable valueFR " France "
label variable valueUS " United States "
label variable valueCN " China "

graph twoway line value * year, yscale(log) ylabel(1 2 5 10 20) ///
	ytitle( " 2017 PPP USD (000's) " ) ///
	title( " Average pre-tax national income of the bottom 50% " ) subtitle( " equal-split adults " ) ///
	note( " Source: WID.world " ) legend(rows(1))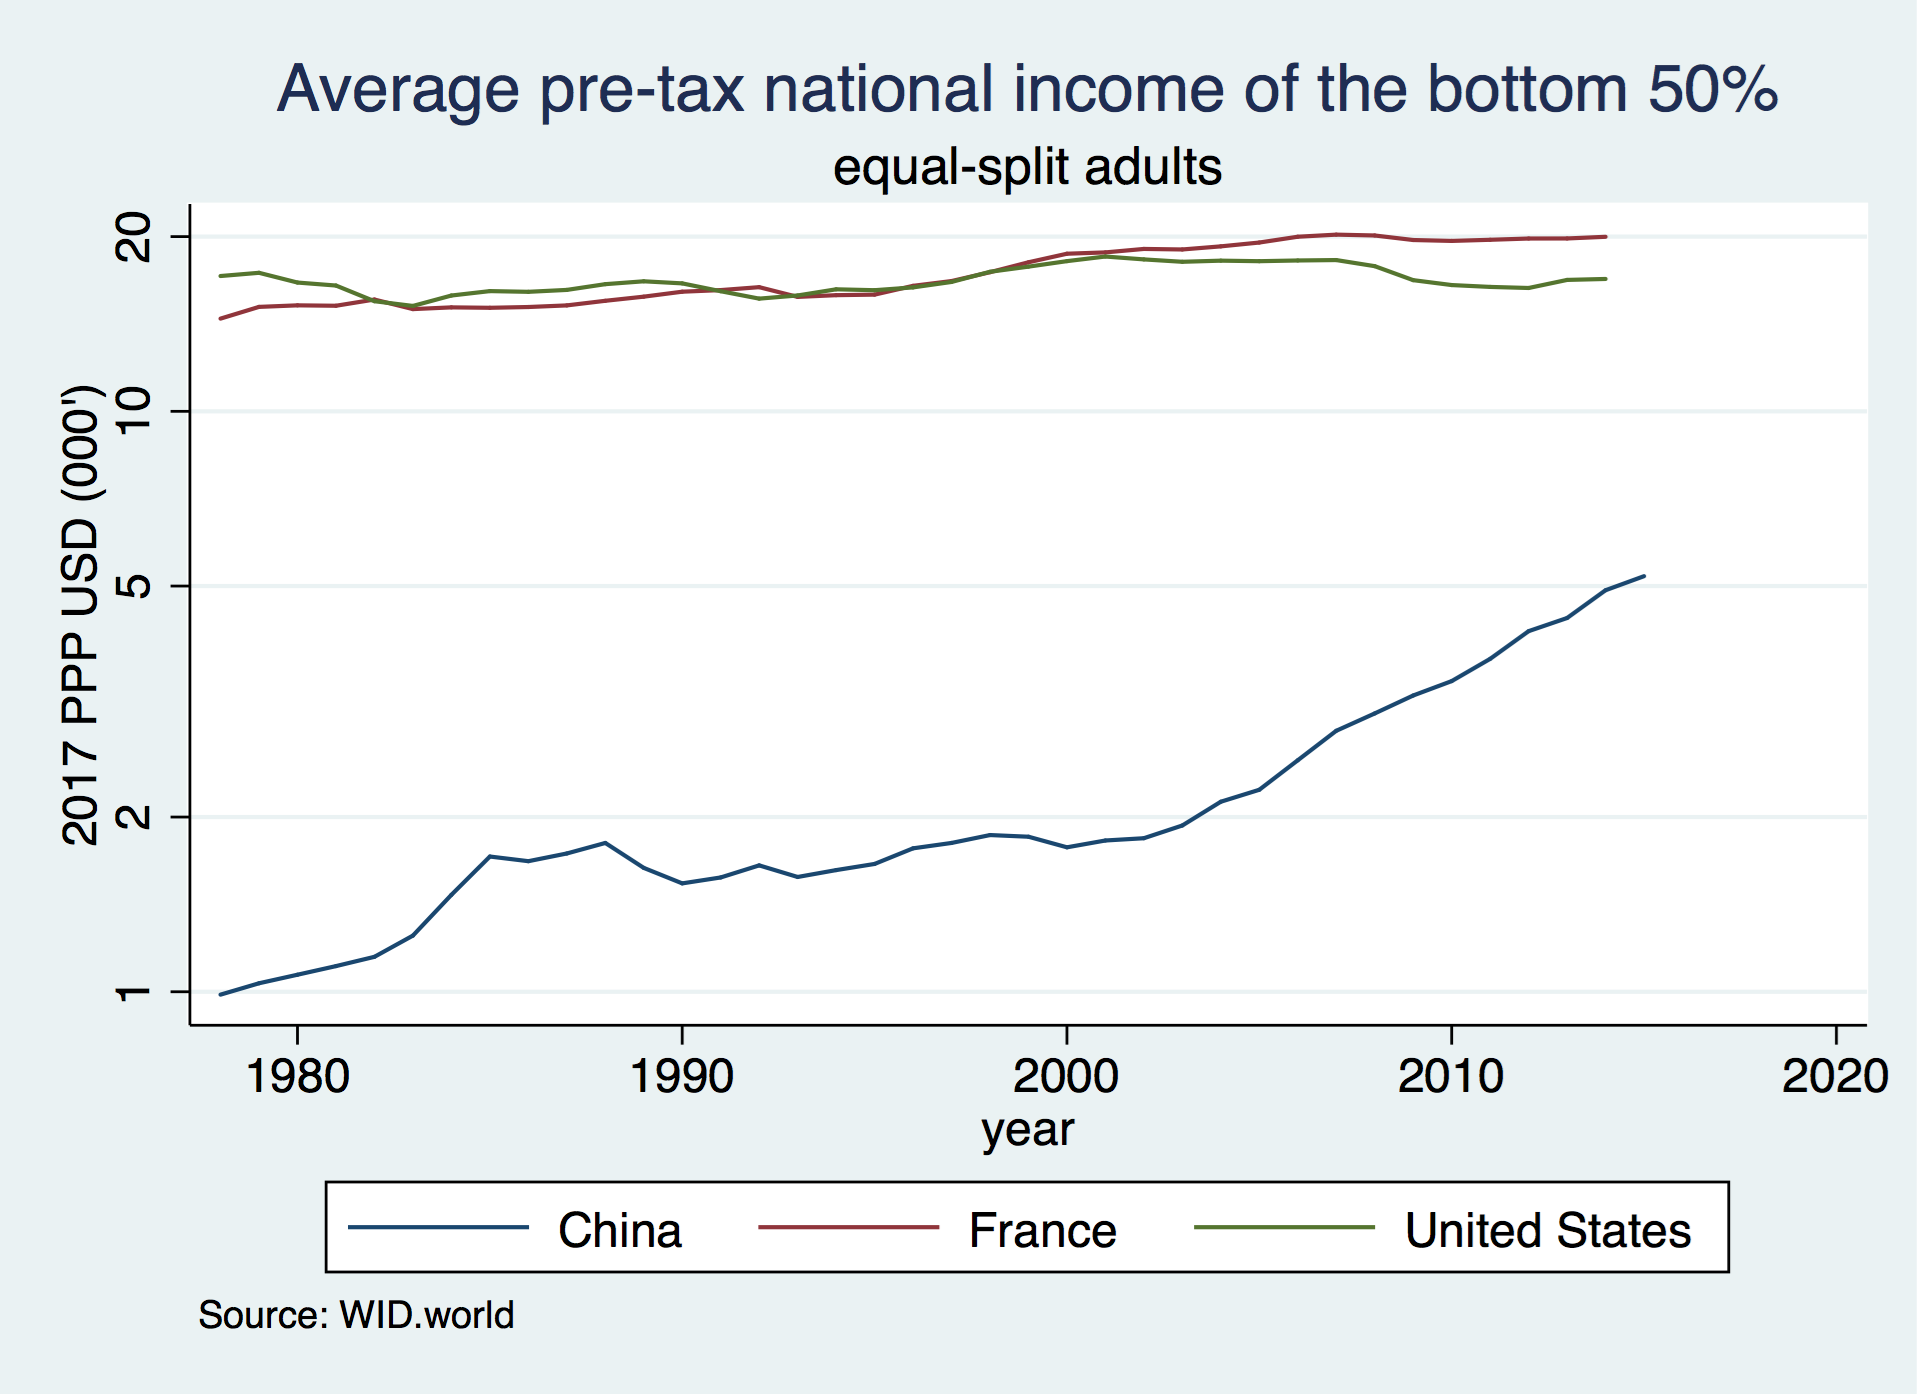
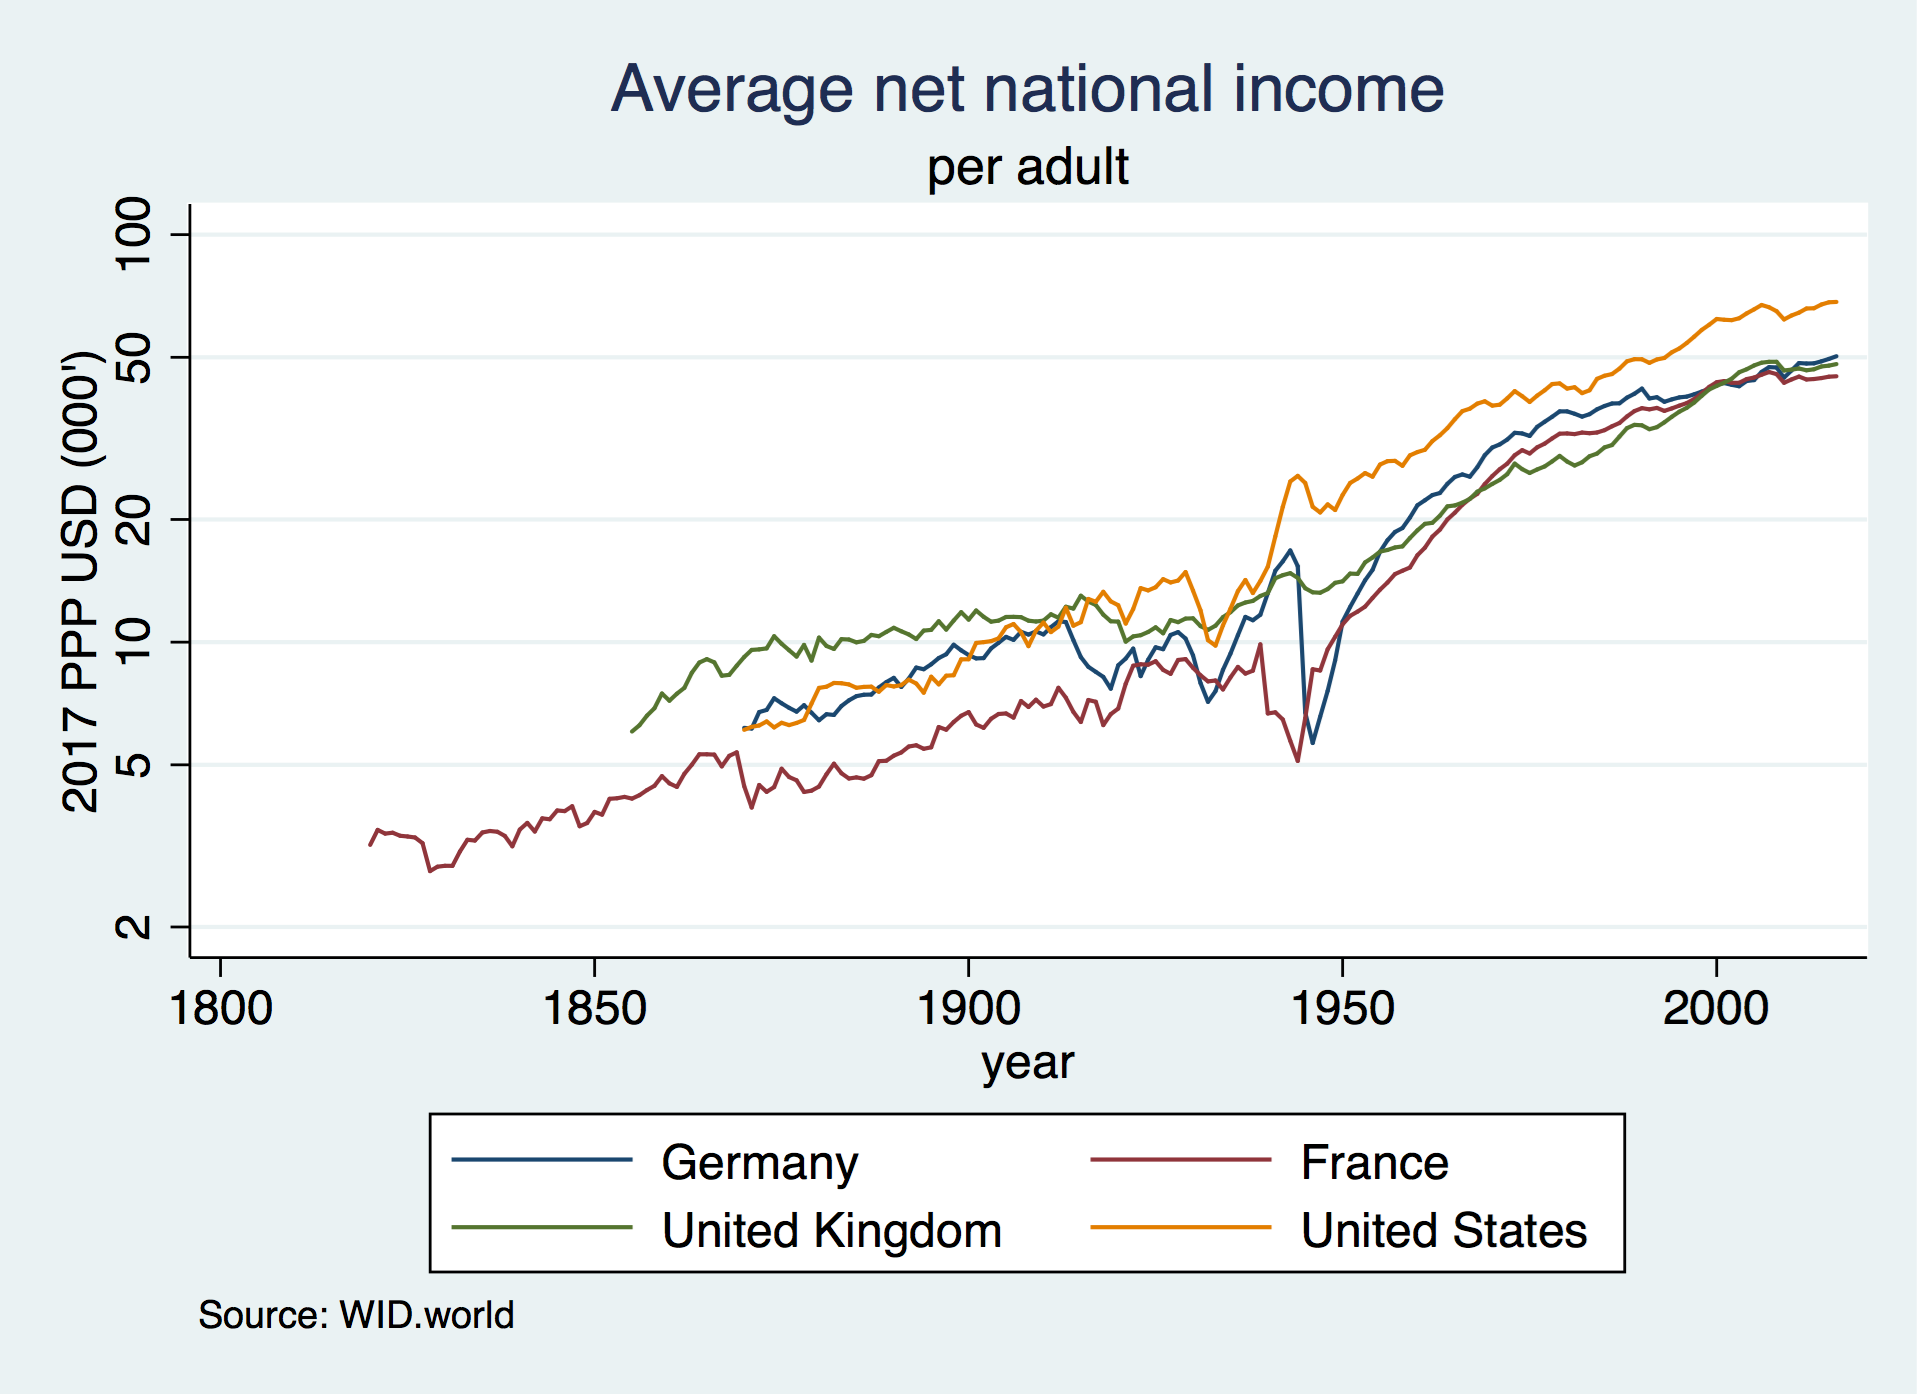
Étonner l'évolution à long terme du revenu national net moyen par adulte en France, en Allemagne, au Royaume-Uni et aux États-Unis (à l'échelle logarithmique):
 // Download and store the 2017 USD PPP exchange rate
wid, indicators(xlcusp) areas(FR US DE GB) year(2017) clear
rename value ppp
tempfile ppp
save " `ppp' "

// Download net national income in constant 2017 local currency
wid, indicators(anninc) areas(FR US DE GB) age(992) clear
merge n:1 country using " `ppp' " , nogenerate

// Convert to 2017 USD PPP (thousands)
replace value = value/ppp/1000

// Reshape and plot
keep country year value
reshape wide value, i(year) j(country) string
label variable valueFR " France "
label variable valueUS " United States "
label variable valueDE " Germany "
label variable valueGB " United Kingdom "

graph twoway line value * year, yscale(log) ///
	ytitle( " 2017 PPP USD (000's) " ) ylabel(2 5 10 20 50 100) ///
	title( " Average net national income " ) subtitle( " per adult " ) ///
	note( " Source: WID.world " )