重要
このプロジェクトに興味を持っていただきありがとうございます。ただし、このリポジトリはもはや維持されていないことに注意してください。
重要なニーズについては、リポジトリを分岐し、独自の更新を作成することを検討してください。
警告
私は、このパッケージがアクセスするデータの妥当性と完全性に関して重大な懸念を持っています。私は、このツールを使用する際に極端な注意と懐疑論を行使し、彼らの仕事のための代替情報源を探すようユーザーに促します。
これが正式[注:私はもはやWorld Inequality Labと提携しておらず、コマンドが将来機能することを保証することはできません]世界不平等データベース(wid.world)のStataコマンド。ユーザーはwid.worldからStataに直接データをダウンロードできます。
ユーザーはSSCから直接コマンドをインストールする必要があります。
ssc install widコマンドのドキュメントは、以下を使用してインストール後に利用できます。
help widフランスでの長期的な進化の富の不平等をプロットする:
wid, indicators(shweal) areas(FR) perc(p90p100 p99p100) ages(992) pop(j) clear

// Reshape and plot
reshape wide value, i(year) j(percentile) string
label variable valuep90p100 " Top 10% share "
label variable valuep99p100 " Top 1% share "

graph twoway line value * year, title( " Wealth inequality in France " ) ///
	ylabel(0.2 " 20% " 0.4 " 40% " 0.6 " 60% " 0.8 " 80% " ) ///
	subtitle( " equal-split adults " ) ///
	note( " Source: WID.world " )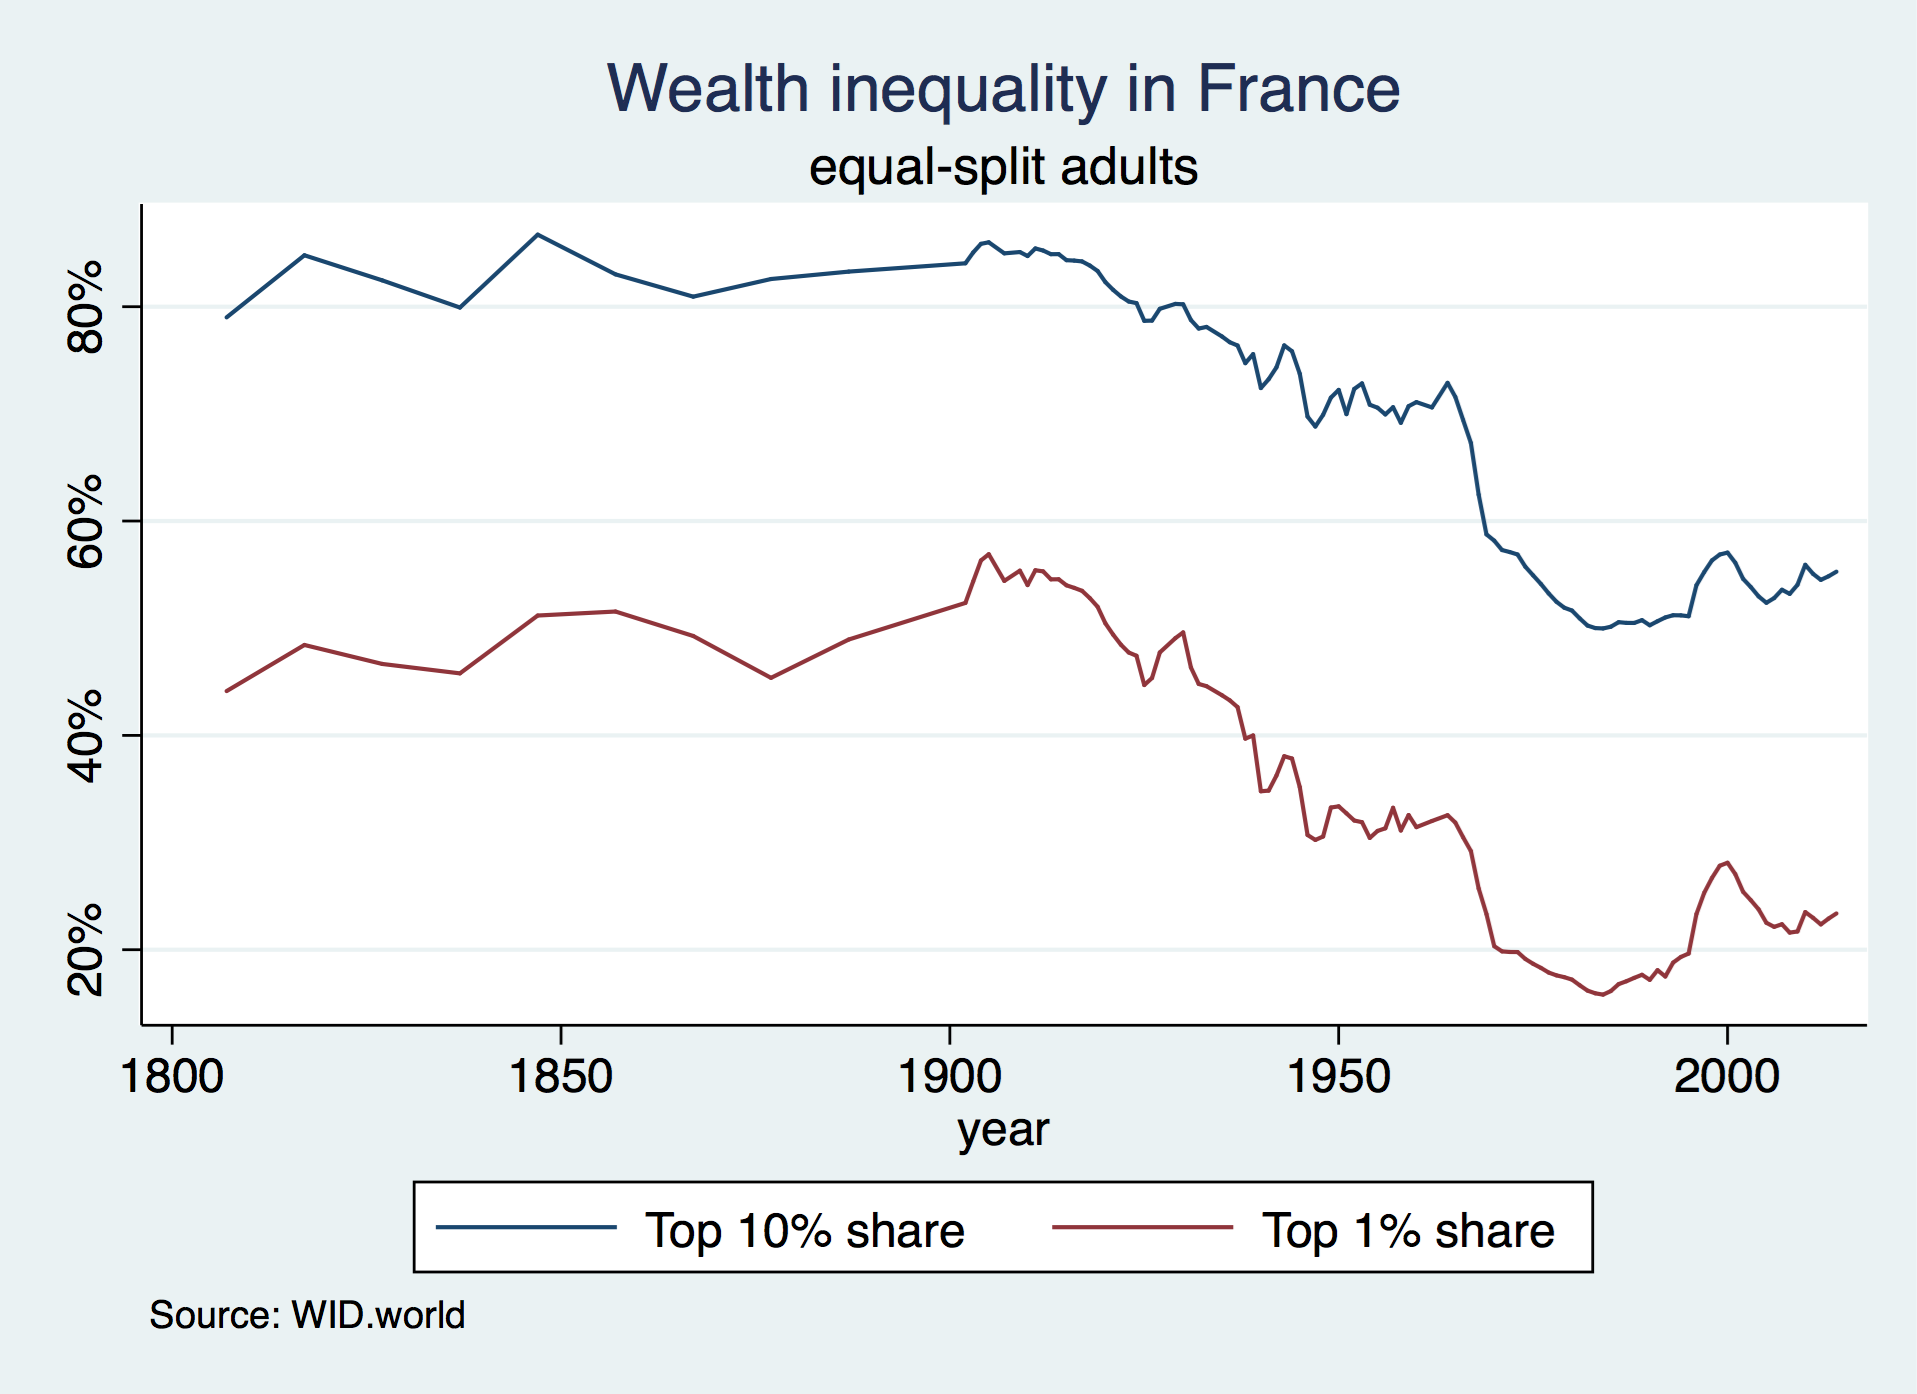
1978年以降、中国、フランス、米国の人口の50%の下位50%の税引前国民所得の進化をプロットします(ログスケール):
 // Download and store the 2017 USD PPP exchange rate
wid, indicators(xlcusp) areas(FR US CN) year(2017) clear
rename value ppp
tempfile ppp
save " `ppp' "

wid, indicators(aptinc) areas(FR US CN) perc(p0p50) year(1978 / 2017) ages(992) pop(j) clear
merge n:1 country using " `ppp' " , nogenerate

// Convert to 2017 USD PPP (thousands)
replace value = value/ppp/1000

// Reshape and plot
keep country year value
reshape wide value, i(year) j(country) string
label variable valueFR " France "
label variable valueUS " United States "
label variable valueCN " China "

graph twoway line value * year, yscale(log) ylabel(1 2 5 10 20) ///
	ytitle( " 2017 PPP USD (000's) " ) ///
	title( " Average pre-tax national income of the bottom 50% " ) subtitle( " equal-split adults " ) ///
	note( " Source: WID.world " ) legend(rows(1))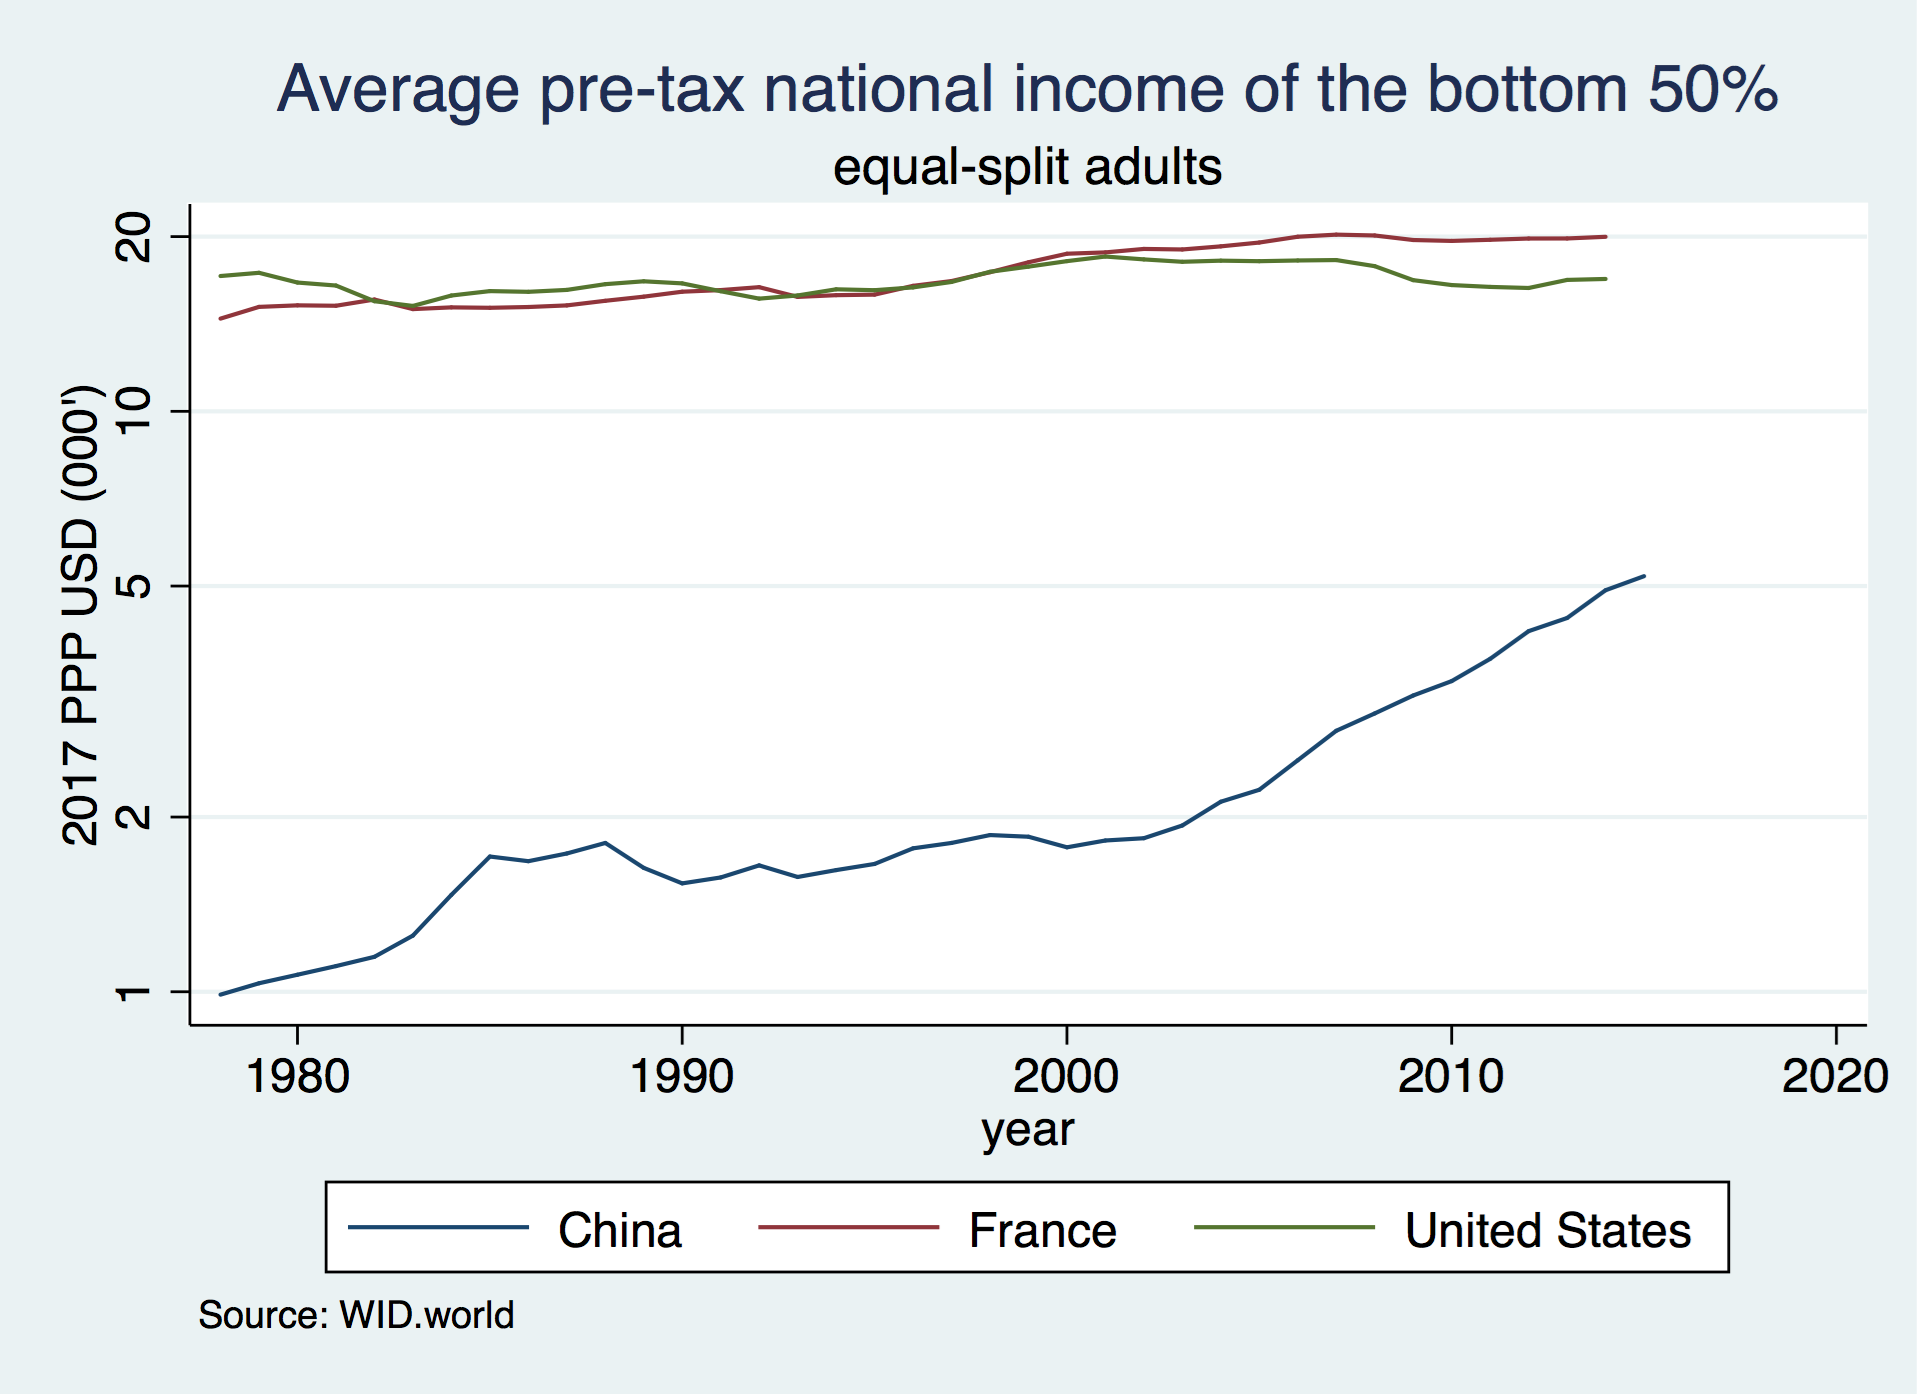
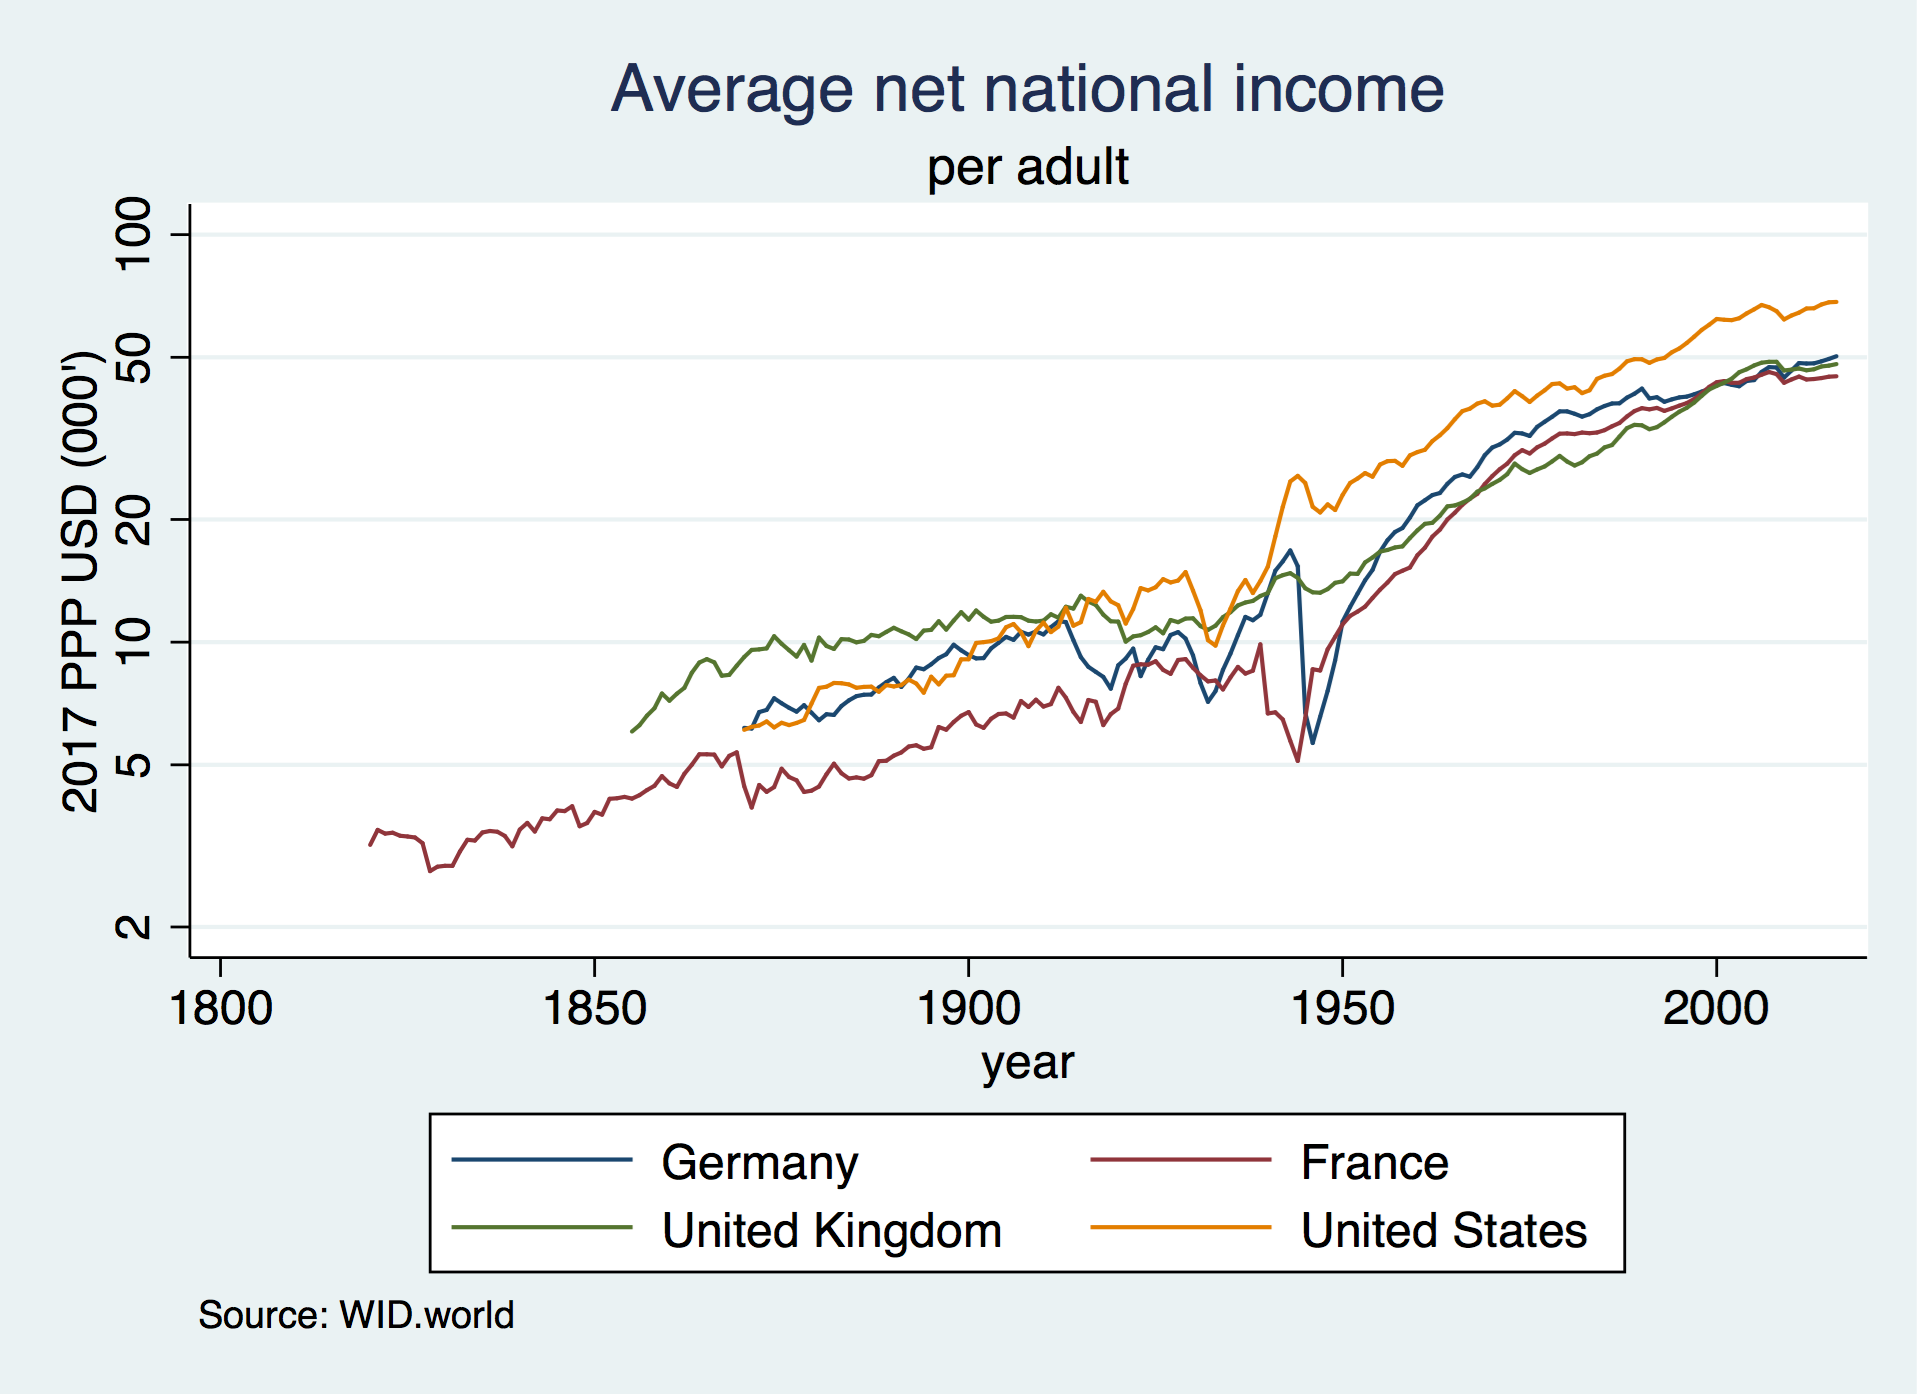
フランス、ドイツ、英国、米国の成人あたりの平均純国民所得の長期的な進化をプロットします(ログスケール):
 // Download and store the 2017 USD PPP exchange rate
wid, indicators(xlcusp) areas(FR US DE GB) year(2017) clear
rename value ppp
tempfile ppp
save " `ppp' "

// Download net national income in constant 2017 local currency
wid, indicators(anninc) areas(FR US DE GB) age(992) clear
merge n:1 country using " `ppp' " , nogenerate

// Convert to 2017 USD PPP (thousands)
replace value = value/ppp/1000

// Reshape and plot
keep country year value
reshape wide value, i(year) j(country) string
label variable valueFR " France "
label variable valueUS " United States "
label variable valueDE " Germany "
label variable valueGB " United Kingdom "

graph twoway line value * year, yscale(log) ///
	ytitle( " 2017 PPP USD (000's) " ) ylabel(2 5 10 20 50 100) ///
	title( " Average net national income " ) subtitle( " per adult " ) ///
	note( " Source: WID.world " )