pandas ta
v0.3.14b
Pandasテクニカル分析( Pandas TA )は、130を超えるインジケータとユーティリティ関数、および60を超えるLib Candlestickパターンを備えたPandasパッケージを活用する使いやすいライブラリです。キャンドルパターン( CDL_PATTERN )、単純な移動平均( SMA )移動平均収束発散( MACD )、ハル指数移動平均( HMA )、ボリンジャーバンド( BBANDS )、バランスボリューム( OBV)など、一般的に使用されるインジケーターが多く含まれています。 )、 Aroon&Aroon Oscillator ( Aroon )、絞り(絞り)など。
注:すべてのろうそく足パターンを使用するには、 TA LIBをインストールする必要があります。 pip install TA-Lib 。 Ta Libがインストールされていない場合、ビルトインのろうそく足パターンのみが利用可能になります。
talib=False使用してインジケータごとに無効にすることができます。ta.stdev(df["close"], length=30, talib=False)のta lib計算を無効にします。import_dirドキュメントの/pandas_ta/custom.pyを参照してください。ta.tsignalsメソッドを使用したVectorBTポートフォリオを使用したJupyterノートブックの例。lookahead=False無効にします。Pandas TAは、ユーザーが次のことを含むがこれらに限定されない一般的な取引パッケージをインストールしているかどうかを確認します。
help(ta.ticker)とhelp(ta.yf)と以下の例を参照してください。pipバージョンは最後の安定したリリースです。バージョン: 0.3.14b
$ pip install pandas_ta最良の選択!バージョン: 0.3.14b
$ pip install -U git+https://github.com/twopirllc/pandas-taこれは、バグやその他の望ましくない副作用がある可能性のある開発バージョンです。自己責任で使用してください!
$ pip install -U git+https://github.com/twopirllc/pandas-ta.git@development import pandas as pd
import pandas_ta as ta
df = pd . DataFrame () # Empty DataFrame
# Load data
df = pd . read_csv ( "path/to/symbol.csv" , sep = "," )
# OR if you have yfinance installed
df = df . ta . ticker ( "aapl" )
# VWAP requires the DataFrame index to be a DatetimeIndex.
# Replace "datetime" with the appropriate column from your DataFrame
df . set_index ( pd . DatetimeIndex ( df [ "datetime" ]), inplace = True )
# Calculate Returns and append to the df DataFrame
df . ta . log_return ( cumulative = True , append = True )
df . ta . percent_return ( cumulative = True , append = True )
# New Columns with results
df . columns
# Take a peek
df . tail ()
# vv Continue Post Processing vv一貫性のためにいくつかの指標引数が再注文されました。詳細については、 help(ta.indicator_name)を使用するか、ドキュメントを改善するためのプルリクエストを行います。
 import pandas as pd
import pandas_ta as ta

# Create a DataFrame so 'ta' can be used.
df = pd . DataFrame ()

# Help about this, 'ta', extension
help ( df . ta )

# List of all indicators
df . ta . indicators ()

# Help about an indicator such as bbands
help ( ta . bbands )Pandas TAを使用してくれてありがとう!
$ pip install -U git+https://github.com/twopirllc/pandas-ta貢献していただきありがとうございます!
Pandas TAには、ユースケースおよび/または要件のための3つの主要な「スタイル」のテクニカルインジケーターの処理があります。それらは、標準、データフレーム拡張機能、およびパンダスTA戦略です。それぞれが使いやすいために抽象化のレベルが増加しています。 Pandas TAに精通するにつれて、 Pandas TA戦略を使用するシンプルさと速度がより明確になる可能性があります。さらに、チェーンや構成を通じて独自のインジケーターを作成できます。最後に、各インジケーターは、スタイルに関係なく、大文字のアンダースコア形式でシリーズまたはデータフレームを返します。
入力列を明示的に定義し、出力の世話をします。
sma10 = ta.sma(df["Close"], length=10)SMA_10donchiandf = ta.donchian(df["HIGH"], df["low"], lower_length=10, upper_length=15)DC_10_15という名前のデータフレームと列名: DCL_10_15, DCM_10_15, DCU_10_15を返しますema10_ohlc4 = ta.ema(ta.ohlc4(df["Open"], df["High"], df["Low"], df["Close"]), length=10)EMA_10という名前のシリーズを返すため。必要に応じて、ユニークに名前を付ける必要がある場合があります。df.taを呼び出すと、 OHLCVAを自動的にOHLCVAに下ろします:オープン、ハイ、ロー、クローズ、ボリューム、 adj_close 。デフォルトでは、 df.ta入力列を直接指定する必要性を削除するインジケータ引数にOHLCVAを使用します。
sma10 = df.ta.sma(length=10)SMA_10ema10_ohlc4 = df.ta.ema(close=df.ta.ohlc4(), length=10, suffix="OHLC4")EMA_10_OHLC4close=df.ta.ohlc4() 。donchiandf = df.ta.donchian(lower_length=10, upper_length=15)DC_10_15という名前のデータフレームと列名: DCL_10_15, DCM_10_15, DCU_10_15を返します最後の3つの例と同じですが、結果をデータフレームdfに直接追加します。
df.ta.sma(length=10, append=True)df列名: SMA_10への追加。df.ta.ema(close=df.ta.ohlc4(append=True), length=10, suffix="OHLC4", append=True)close=df.ta.ohlc4() 。df.ta.donchian(lower_length=10, upper_length=15, append=True)dfに追加: DCL_10_15, DCM_10_15, DCU_10_15 。Pandas TA戦略は、戦略方法によって実行される指標の名前のグループです。すべての戦略は、 col_namesパラメーターを使用する場合を除き、 mulitprocessingを使用します(以下を参照)。次のセクションにリストされているさまざまな種類の戦略があります。
 # (1) Create the Strategy
MyStrategy = ta . Strategy (
    name = "DCSMA10" ,
    ta = [
        { "kind" : "ohlc4" },
        { "kind" : "sma" , "length" : 10 },
        { "kind" : "donchian" , "lower_length" : 10 , "upper_length" : 15 },
        { "kind" : "ema" , "close" : "OHLC4" , "length" : 10 , "suffix" : "OHLC4" },
    ]
)

# (2) Run the Strategy
df . ta . strategy ( MyStrategy , ** kwargs )戦略クラスは、データクラスを使用してお気に入りのTAインジケーターを名前を付けてグループ化する簡単な方法です。 Pandas TAには、 2つの事前に構築された基本的な戦略が付属しており、開始を支援します。すべての戦略とCommonstrategyです。戦略は、構成/チェーンを使用して、必要なものと同じくらい単純なものであるか、必要なほど複雑です。
dfに自動的に追加されます。インジケーターの構成/チェーンなどの例については、Pandas TA戦略の例ノートブックを参照してください。
{"kind": "indicator name"}属性がない場合、Pandas TAによって消費されると戦略は失敗します。スペルをチェックすることを忘れないでください。 # Running the Builtin CommonStrategy as mentioned above
df . ta . strategy ( ta . CommonStrategy )
# The Default Strategy is the ta.AllStrategy. The following are equivalent:
df . ta . strategy ()
df . ta . strategy ( "All" )
df . ta . strategy ( ta . AllStrategy ) # List of indicator categories
df . ta . categories
# Running a Categorical Strategy only requires the Category name
df . ta . strategy ( "Momentum" ) # Default values for all Momentum indicators
df . ta . strategy ( "overlap" , length = 42 ) # Override all Overlap 'length' attributes # Create your own Custom Strategy
CustomStrategy = ta . Strategy (
name = "Momo and Volatility" ,
description = "SMA 50,200, BBANDS, RSI, MACD and Volume SMA 20" ,
ta = [
{ "kind" : "sma" , "length" : 50 },
{ "kind" : "sma" , "length" : 200 },
{ "kind" : "bbands" , "length" : 20 },
{ "kind" : "rsi" },
{ "kind" : "macd" , "fast" : 8 , "slow" : 21 },
{ "kind" : "sma" , "close" : "volume" , "length" : 20 , "prefix" : "VOLUME" },
]
)
# To run your "Custom Strategy"
df . ta . strategy ( CustomStrategy )Pandas TA戦略方法は、1つの例外を除き、すべての戦略タイプのバルクインジケーター処理用のマルチプロセスを利用しています! col_namesパラメーターを使用して結果の列の名前を変更すると、 taアレイのインジケーターが順番に実行されます。
 # VWAP requires the DataFrame index to be a DatetimeIndex.
# * Replace "datetime" with the appropriate column from your DataFrame
df . set_index ( pd . DatetimeIndex ( df [ "datetime" ]), inplace = True )

# Runs and appends all indicators to the current DataFrame by default
# The resultant DataFrame will be large.
df . ta . strategy ()
# Or the string "all"
df . ta . strategy ( "all" )
# Or the ta.AllStrategy
df . ta . strategy ( ta . AllStrategy )

# Use verbose if you want to make sure it is running.
df . ta . strategy ( verbose = True )

# Use timed if you want to see how long it takes to run.
df . ta . strategy ( timed = True )

# Choose the number of cores to use. Default is all available cores.
# For no multiprocessing, set this value to 0.
df . ta . cores = 4

# Maybe you do not want certain indicators.
# Just exclude (a list of) them.
df . ta . strategy ( exclude = [ "bop" , "mom" , "percent_return" , "wcp" , "pvi" ], verbose = True )

# Perhaps you want to use different values for indicators.
# This will run ALL indicators that have fast or slow as parameters.
# Check your results and exclude as necessary.
df . ta . strategy ( fast = 10 , slow = 50 , verbose = True )

# Sanity check. Make sure all the columns are there
df . columns これらはマルチプロセッシングを利用しないことを忘れないでください
 NonMPStrategy = ta . Strategy (
    name = "EMAs, BBs, and MACD" ,
    description = "Non Multiprocessing Strategy by rename Columns" ,
    ta = [
        { "kind" : "ema" , "length" : 8 },
        { "kind" : "ema" , "length" : 21 },
        { "kind" : "bbands" , "length" : 20 , "col_names" : ( "BBL" , "BBM" , "BBU" )},
        { "kind" : "macd" , "fast" : 8 , "slow" : 21 , "col_names" : ( "MACD" , "MACD_H" , "MACD_S" )}
    ]
)
# Run it
df . ta . strategy ( NonMPStrategy ) # Set ta to default to an adjusted column, 'adj_close', overriding default 'close'.
df . ta . adjusted = "adj_close"
df . ta . sma ( length = 10 , append = True )
# To reset back to 'close', set adjusted back to None.
df . ta . adjusted = None # List of Pandas TA categories.
df . ta . categories # Set the number of cores to use for strategy multiprocessing
# Defaults to the number of cpus you have.
df . ta . cores = 4
# Set the number of cores to 0 for no multiprocessing.
df . ta . cores = 0
# Returns the number of cores you set or your default number of cpus.
df . ta . cores # The 'datetime_ordered' property returns True if the DataFrame
# index is of Pandas datetime64 and df.index[0] < df.index[-1].
# Otherwise it returns False.
df . ta . datetime_ordered # Sets the Exchange to use when calculating the last_run property. Default: "NYSE"
df . ta . exchange
# Set the Exchange to use.
# Available Exchanges: "ASX", "BMF", "DIFX", "FWB", "HKE", "JSE", "LSE", "NSE", "NYSE", "NZSX", "RTS", "SGX", "SSE", "TSE", "TSX"
df . ta . exchange = "LSE" # Returns the time Pandas TA was last run as a string.
df . ta . last_run # The 'reverse' is a helper property that returns the DataFrame
# in reverse order.
df . ta . reverse # Applying a prefix to the name of an indicator.
prehl2 = df . ta . hl2 ( prefix = "pre" )
print ( prehl2 . name ) # "pre_HL2"
# Applying a suffix to the name of an indicator.
endhl2 = df . ta . hl2 ( suffix = "post" )
print ( endhl2 . name ) # "HL2_post"
# Applying a prefix and suffix to the name of an indicator.
bothhl2 = df . ta . hl2 ( prefix = "pre" , suffix = "post" )
print ( bothhl2 . name ) # "pre_HL2_post" # Returns the time range of the DataFrame as a float.
# By default, it returns the time in "years"
df . ta . time_range
# Available time_ranges include: "years", "months", "weeks", "days", "hours", "minutes". "seconds"
df . ta . time_range = "days"
df . ta . time_range # prints DataFrame time in "days" as float # Sets the DataFrame index to UTC format.
df . ta . to_utc import numpy as np
# Add constant '1' to the DataFrame
df . ta . constants ( True , [ 1 ])
# Remove constant '1' to the DataFrame
df . ta . constants ( False , [ 1 ])
# Adding constants for charting
import numpy as np
chart_lines = np . append ( np . arange ( - 4 , 5 , 1 ), np . arange ( - 100 , 110 , 10 ))
df . ta . constants ( True , chart_lines )
# Removing some constants from the DataFrame
df . ta . constants ( False , np . array ([ - 60 , - 40 , 40 , 60 ])) # Prints the indicators and utility functions
df . ta . indicators ()
# Returns a list of indicators and utility functions
ind_list = df . ta . indicators ( as_list = True )
# Prints the indicators and utility functions that are not in the excluded list
df . ta . indicators ( exclude = [ "cg" , "pgo" , "ui" ])
# Returns a list of the indicators and utility functions that are not in the excluded list
smaller_list = df . ta . indicators ( exclude = [ "cg" , "pgo" , "ui" ], as_list = True ) # Download Chart history using yfinance. (pip install yfinance) https://github.com/ranaroussi/yfinance
# It uses the same keyword arguments as yfinance (excluding start and end)
df = df . ta . ticker ( "aapl" ) # Default ticker is "SPY"
# Period is used instead of start/end
# Valid periods: 1d,5d,1mo,3mo,6mo,1y,2y,5y,10y,ytd,max
# Default: "max"
df = df . ta . ticker ( "aapl" , period = "1y" ) # Gets this past year
# History by Interval by interval (including intraday if period < 60 days)
# Valid intervals: 1m,2m,5m,15m,30m,60m,90m,1h,1d,5d,1wk,1mo,3mo
# Default: "1d"
df = df . ta . ticker ( "aapl" , period = "1y" , interval = "1wk" ) # Gets this past year in weeks
df = df . ta . ticker ( "aapl" , period = "1mo" , interval = "1h" ) # Gets this past month in hours
# BUT WAIT!! THERE'S MORE!!
help ( ta . yf )太字ではないパターンは、ta-libをインストールする必要があります: pip install TA-Lib
 # Get all candle patterns (This is the default behaviour)
df = df . ta . cdl_pattern ( name = "all" )

# Get only one pattern
df = df . ta . cdl_pattern ( name = "doji" )

# Get some patterns
df = df . ta . cdl_pattern ( name = [ "doji" , "inside" ])ta.linreg(series, r=True)lazybear=Trueでlazybearを有効にしますdf.ta.strategy()から除外。| 移動平均収束発散(MACD) |
|---|
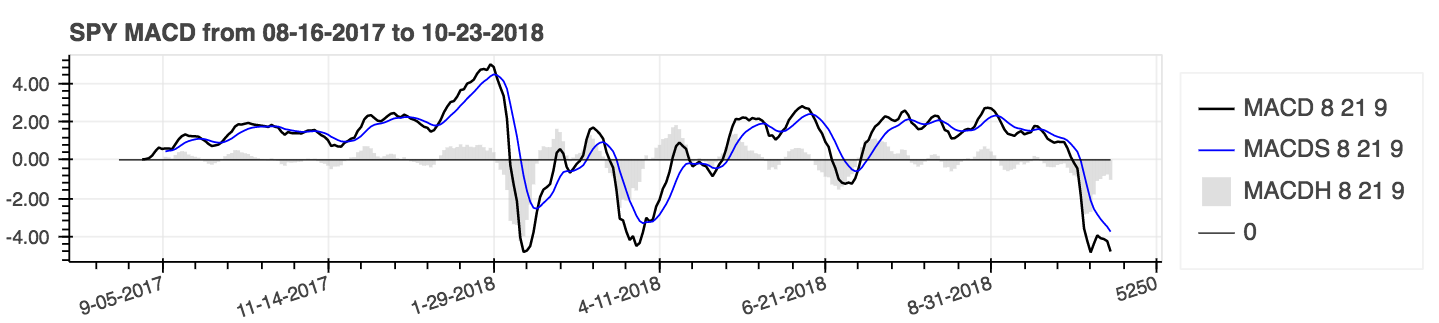 |
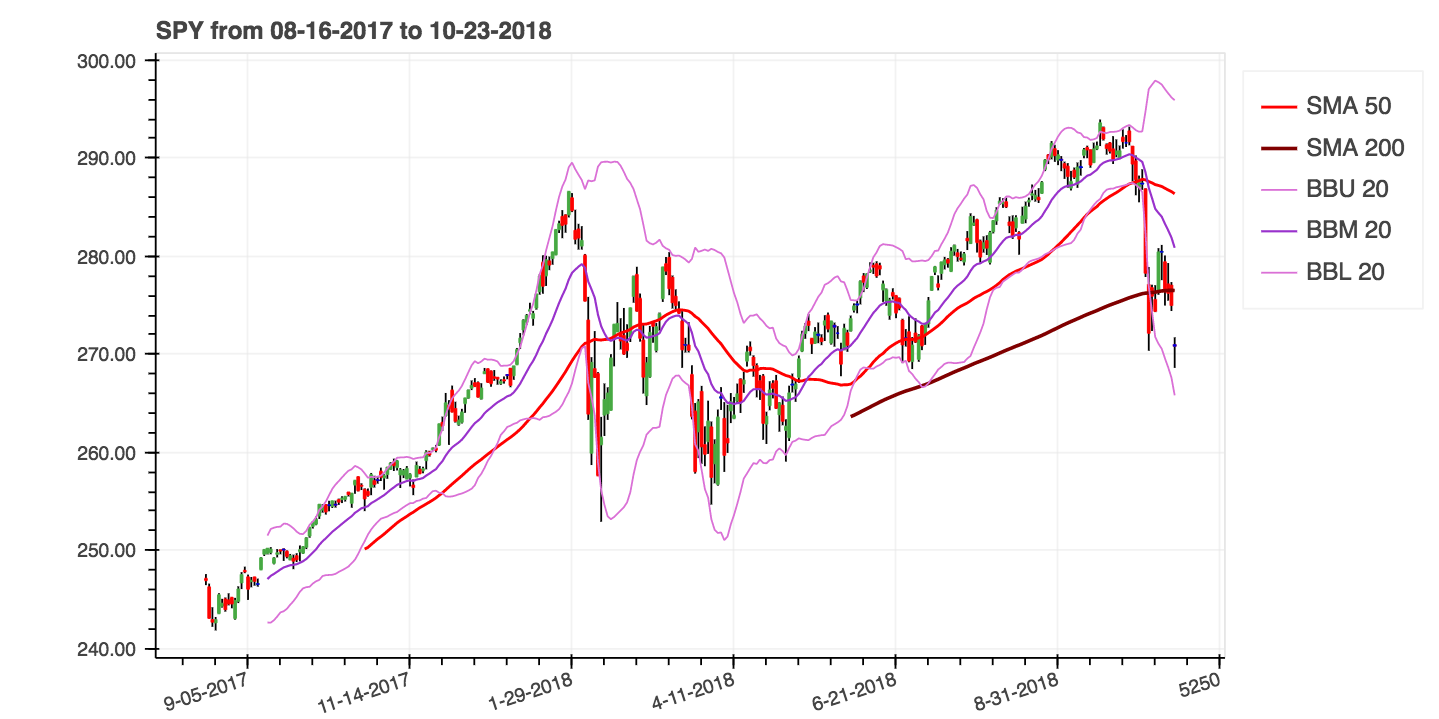
help(ta.ichimoku) 。lookahead=False潜在的なデータリークを防ぐために、chikouスパン列をドロップします。| 単純な移動平均(SMA)とボリンジャーバンド(BBANDS) |
|---|
|
パラメーターを使用します:累積=累積結果にはtrue 。
| 単純な移動平均(SMA)のリターン(累積)パーセント(累積) |
|---|
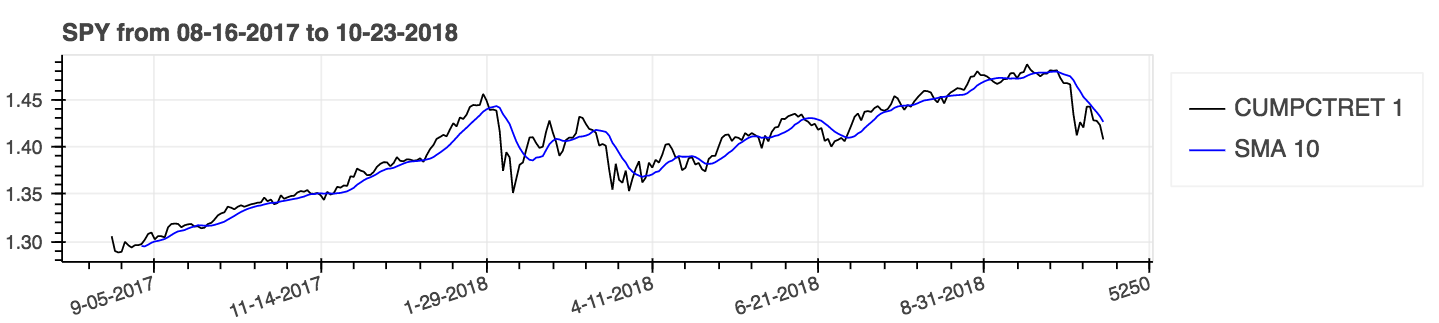 |
| Zスコア |
|---|
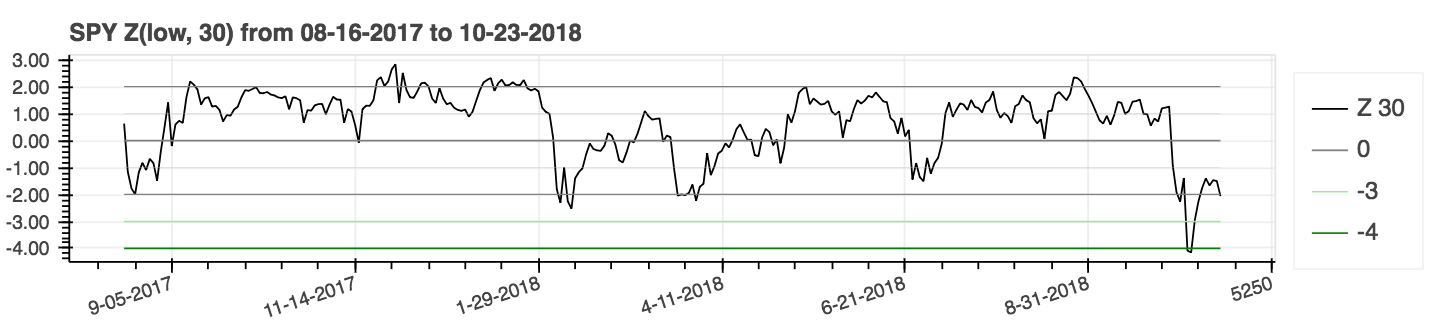 |
lookahead=False設定してセンタリングを無効にし、潜在的なデータリークを削除します。| 平均的な方向運動指数(ADX) |
|---|
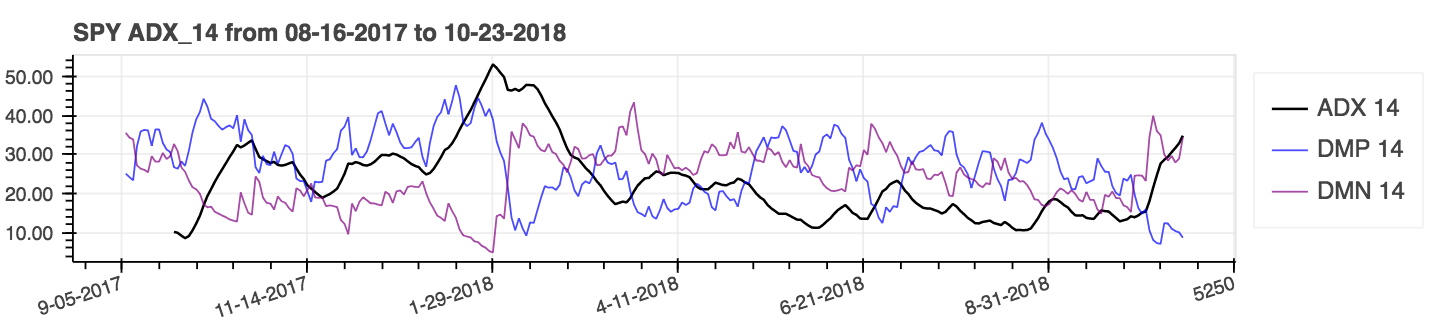 |
| 平均真の範囲(ATR) |
|---|
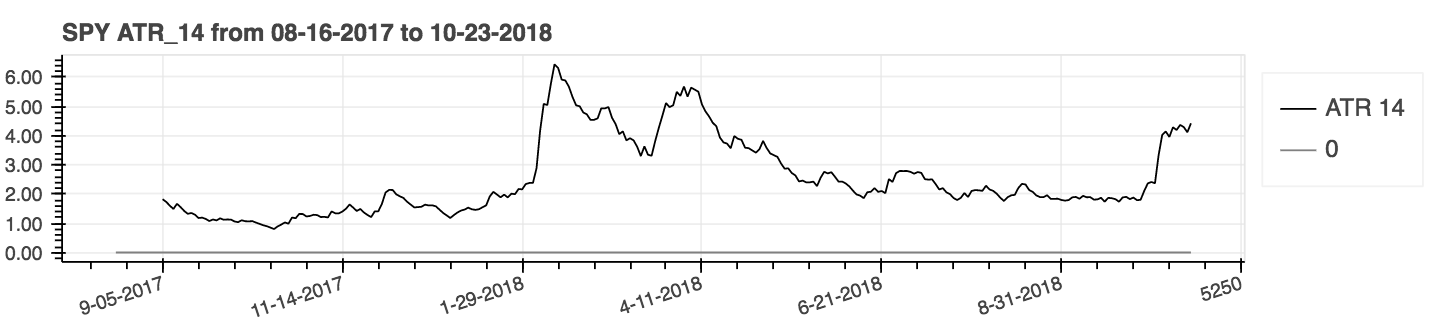 |
| オンバランスボリューム(obv) |
|---|
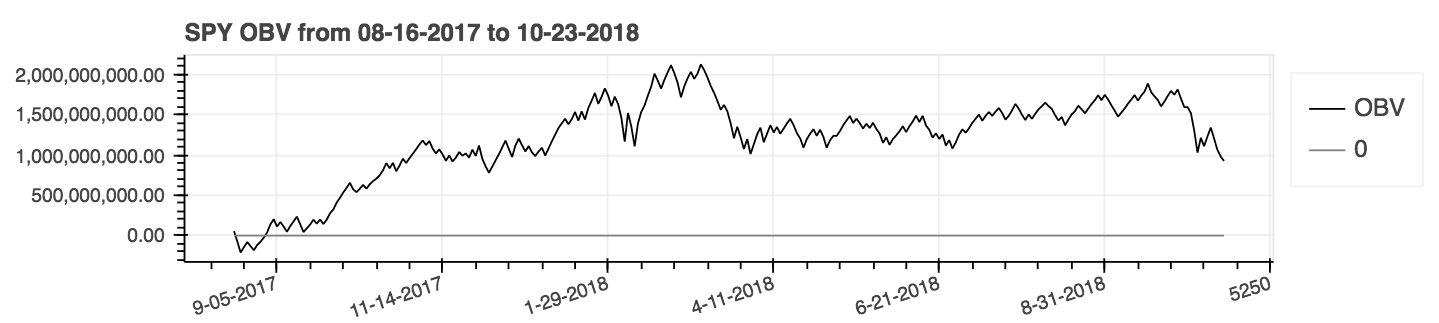 |
パフォーマンスメトリックはパッケージへの新しい追加であり、結果として信頼できない可能性があります。あなた自身の責任で使用してください。これらのメトリックはフロートを返し、データフレーム拡張機能の一部ではありません。それらは標準的な方法と呼ばれます。例えば:
 import pandas_ta as ta
result = ta . cagr ( df . close )VectorBTのポートフォリオfrom_signalsメソッドと統合しやすくするために、 ta.trend_returnメソッドはta.tsignalsメソッドに置き換えられ、取引信号の生成を簡素化します。包括的な例については、例のjupyterノートブックvectorbtバックテストを参照してください。
 import pandas as pd
import pandas_ta as ta
import vectorbt as vbt

df = pd . DataFrame (). ta . ticker ( "AAPL" ) # requires 'yfinance' installed

# Create the "Golden Cross"
df [ "GC" ] = df . ta . sma ( 50 , append = True ) > df . ta . sma ( 200 , append = True )

# Create boolean Signals(TS_Entries, TS_Exits) for vectorbt
golden = df . ta . tsignals ( df . GC , asbool = True , append = True )

# Sanity Check (Ensure data exists)
print ( df )

# Create the Signals Portfolio
pf = vbt . Portfolio . from_signals ( df . close , entries = golden . TS_Entries , exits = golden . TS_Exits , freq = "D" , init_cash = 100_000 , fees = 0.0025 , slippage = 0.0025 )

# Print Portfolio Stats and Return Stats
print ( pf . stats ())
print ( pf . returns_stats ())ta.ma()により、より移動平均選択肢でmamode Kwargが更新されました。簡単にするために、すべての選択肢は単一のソース移動平均です。これは主に、 mamode Kwargを持つインジケーターが使用する内部ユーティリティです。これには、 ACCBANDS 、 AMAT 、 AOBV 、 ATR 、 BBANDS 、バイアス、 EFI 、 HILO 、 KC 、 NATR 、 QQE 、 RVI 、およびThermoが含まれます。デフォルトのmamodeパラメーターは変更されていません。ただし、 ta.ma()必要に応じてユーザーが使用できます。詳細について: help(ta.ma)to_utcを追加して、データフレームインデックスをUTCに変換しました。参照:DataFrame IndexをUTCに簡単に変換するために、Pandas TA DataFrameプロパティとしてhelp(ta.to_utc)を今すぐ今すぐに。 close > sma(close, 50)のようなトレンドシリーズが与えられると、その傾向のトレンド、貿易エントリ、貿易退場を返して、 asbool=True設定してブールトレードエントリと出口を取得することにより、 VectorBTと互換性のあるものにします。 help(ta.tsignals) help(ta.alma)取引口座、またはファンド。 help(ta.drawdown)help(ta.cdl_pattern)help(ta.cdl_z)help(ta.cti)help(ta.xsignals)help(ta.dm)help(ta.ebsw)help(ta.jma)は、ノイズを排除して「真の」根本的な活動を見ることを試みます。help(ta.kvo)市場の価格の逆転を予測するように設計されています。help(ta.stc)help(ta.squeeze_pro)df.ta.strategy()からexlcurented。 help(ta.td_seq)help(ta.tos_stdevall)help(ta.vhf)は、アダムホワイトによって作成され、トレンドと範囲の市場を識別しました。 mamode modeに変更されました。 help(ta.accbands)を参照してください。mamodeオプションでmamode追加しました。新しい引数lensig 、TradingViewのBuiltin ADXインジケーターのように振る舞います。 help(ta.adx)を参照してください。drift引数とより記述的な列名を追加しました。mamode 「 RMA 」になり、TradingViewと同じmamodeオプションがあります。 help(ta.atr)参照してください。ddoff 。最終列としてBBパーセント(BBP)も含まれています。デフォルトは0ですhelp(ta.bbands)を参照してください。ln 。デフォルトはfalseです。 help(ta.chop)を参照してください。Trueを備えたtvmodeを追加しました。 tvmode=Falseの場合、 CKSPはデフォルト値で「新しいテクニカルトレーダー」を実装します。 help(ta.cksp)参照してください。talib Ta Libのバージョンを使用し、Ta Libがインストールされている場合。デフォルトはtrueです。 help(ta.cmo)を参照してください。strictチェックシリーズが、より速い計算で期間のlengthにわたって継続的に減少しているかどうかを確認します。デフォルト: False 。 percent引数もデフォルトなしで追加されています。 help(ta.decreasing) 。strictチェックシリーズが、より速い計算で期間のlengthにわたって継続的に増加しているかどうかを確認します。デフォルト: False 。 percent引数もデフォルトなしで追加されています。 help(ta.increasing)を参照してください。help(ta.kvo)を参照してください。as_stridedメソッドを使用するか、新しいsliding_window_viewメソッドを使用するかを決定します。これにより、Google Colabの問題が解決するはずであり、依存関係の更新の遅延と、問題#285および#329で説明されているTensorflowの依存関係が遅れています。asmode MACDのバージョンとして有効になります。デフォルトはfalseです。 help(ta.macd)を参照してください。sarと一致するバグの修正と調整。加速係数を初期化する新しい引数af0 。 help(ta.psar)参照してください。mamode含めました。デフォルトはTA LIBと一致するSMAです。 help(ta.ppo)を参照してください。13および信号MAモードmamodeを備えたsignalを引用として追加しました。 help(ta.tsi)を参照してください。help(ta.vp)を参照してください。help(ta.vwma)を参照してください。anchorと呼ばれる新しいパラメーターを追加しました。デフォルト:「毎日」の「D」。追加のオプションについては、Timeseriesオフセットエイリアスを参照してください。 DateFrameインデックスはDateTimeIndexである必要があります。 help(ta.vwap)を参照してください。help(ta.vwma)を参照してください。Z_lengthからZS_lengthに変更しました。 help(ta.zscore)を参照してください。オリジナルのta-lib | TradingView |シエラチャート| MQL5 | FMラボ| Pro Real Code |ユーザー42
パッケージのように寛大に感じたり、それがより成熟したパッケージになったりするのを見たいですか?


