Canvas , which means canvas in Chinese, corresponds to a rectangular area in the Tkinter module, providing users with space for drawing. They can place graphics, text, ellipses or buttons and other components on the canvas, and can also paint patterns,
Before using the Canvas component, we must first learn its corresponding screen coordinate system.
We generally use pixels as units for images in computers, and each pixel has 2 values. In the Canvas component, the coordinates of the upper left corner of the corresponding window are (0,0), which means that in the plane rectangular coordinate system The corresponding x-axis and y-axis are both 0, and the coordinates of the lower right corner of the window are the two maximum values from the x-axis and the Y-axis, as shown in the figure:

When we place components in the Canvas canvas, we must ensure that the coordinates of the components are correct.
The syntax structure of Canvas is:
my_canvas=Canvas(parent class, optional)
The parent class is the name of the upper layer window we placed. The options include bd, bg, continue, cursor, height, width, highlightcolor, relief, scrollregion, etc. These options have been introduced previously, so I won’t go into too much detail here. explain.
There are many ways to draw graphics using the Canves component, including create_line, create_rectangle, create_oval, create_arc, and create_polygon. We will introduce them one by one below.
The syntax format is as follows:
canvas.create_line(x1,y1,x2,y2,...,xn,yn,options)
We can use this method to draw a straight line between two or n points on the canvas. The first two coordinates (x1, y1) are the starting point and (xn, yn) are the end point.
The code is as follows:
importtkinterclassTK:def__init__(self):self.window=tkinter.Tk()self.canvas=tkinter.Canvas(self.window,width=300,height =300,bg='pink')self.canvas.create_line(30,30,100,200,200,200,300,200,300,300)self.canvas.pack()tkinter.mainloop()m=TK()
The effect is as shown in the figure:

The coordinates we selected are (30,30)->(100,200)->(200,200)->(300,300). Based on the above coordinates, we draw the above picture.
The syntax for creating a rectangle is:
canvas.create_rectangle(x1,y1,x2,y2, optional)
The rectangle only needs 2 coordinates to determine, so we only need the coordinates (x1, y1) and (x2, y2) of the upper left corner and lower right corner. The code is as follows:
importtkinterclassTK:def__init__(self):self.window=tkinter.Tk()self.canvas=tkinter.Canvas(self.window,width=30 0,height=300,bg='pink')self.canvas.create_rectangle(100,100,200,200)self.canvas.pack()tkinter.mainloop()m=TK()
The operation is as shown in the figure:

The syntax format is as follows:
canvas.create.oval(x1,y1,x2,y2,optional)
The positions corresponding to the four coordinates are as shown in the figure:

The syntax format is as follows:
canvas.create_arc(x1,y1,x2,y2,start=angle,extent=width,optional)
Among them, the coordinates correspond to the ellipse in the above figure. The value in start corresponds to the starting angle of the arc, and extent corresponds to the counterclockwise angle range of the arc.
The code is as follows:
importtkinterclassTK:def__init__(self):self.window=tkinter.Tk()self.canvas=tkinter.Canvas(self.window,width=300,height=30 0,bg='pink')self.canvas.create_arc(60,60,220,220,start=0,extent=120,fill='blue')self.canvas.pack()tkinter.mainloop()m=TK()
The operation is as shown in the figure:

The syntax format is as follows:
canvas.create_polygon(x1,y1,x2,y2,...xn,yn,optional)
Each coordinate corresponds to a position, the first one is the first vertex, which are linked in sequence, and the last coordinate automatically closes the polygon.
The code is as follows:
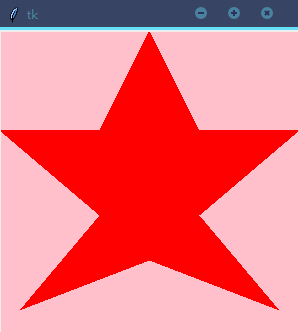
importtkinterclassTK:def__init__(self):self.window=tkinter.Tk()self.canvas=tkinter.Canvas(self.window,width=300,height=300,bg='pink')self.canvas .create_polygon(150,0,200,100,300,100,200,185,280,280,150,230,20,280,100,185,0,100,100,100,fill='red')self.canvas.pack()tkinter.mainloop()m=TK()
The running diagram is as follows:

You can draw the graphics you want by changing the coordinates. Optional parameters include dash, outline, sommth and width.
We can draw various patterns through canvas. Of course, it also has other functions. We will also use it in the examples in the next section.