pyecharts
Version 2.0.7
English README
Apache ECharts is a data visualization open sourced by Baidu. It has been recognized by many developers for its good interactivity and exquisite chart design. Python is an expressive language and is very suitable for data processing. When data analysis meets data visualization, pyecharts was born.
There is incompatibility between v0.5.x and V1. V1 is a brand new version. See ISSUE#892 and ISSUE#1033 for details.
Support Python 2.7, 3.4+
After the development team decided, version 0.5.x will no longer be maintained. The code of version 0.5.x is located in the 05x branch, and the documentation is located at 05x-docs.pyecharts.org.
Only supports Python 3.7+
The new version series will start with v1.0.0, documentation is at pyecharts.org; examples are at gallery.pyecharts.org
Only supports Python 3.7+
The new version is based on Echarts 5.4.1+ for rendering, and the documentation and sample locations are the same as V1.
pip install
 # 安装 v1 以上版本
$ pip install pyecharts -U

# 如果需要安装 0.5.11 版本的开发者,可以使用
# pip install pyecharts==0.5.11
Source code installation
 # 安装 v1 以上版本
$ git clone https://github.com/pyecharts/pyecharts.git
# 如果需要安装 0.5.11 版本,请使用 git clone https://github.com/pyecharts/pyecharts.git -b v05x
$ cd pyecharts
$ pip install -r requirements.txt
$ python setup.py install from pyecharts . charts import Bar
from pyecharts import options as opts
# V1 版本开始支持链式调用
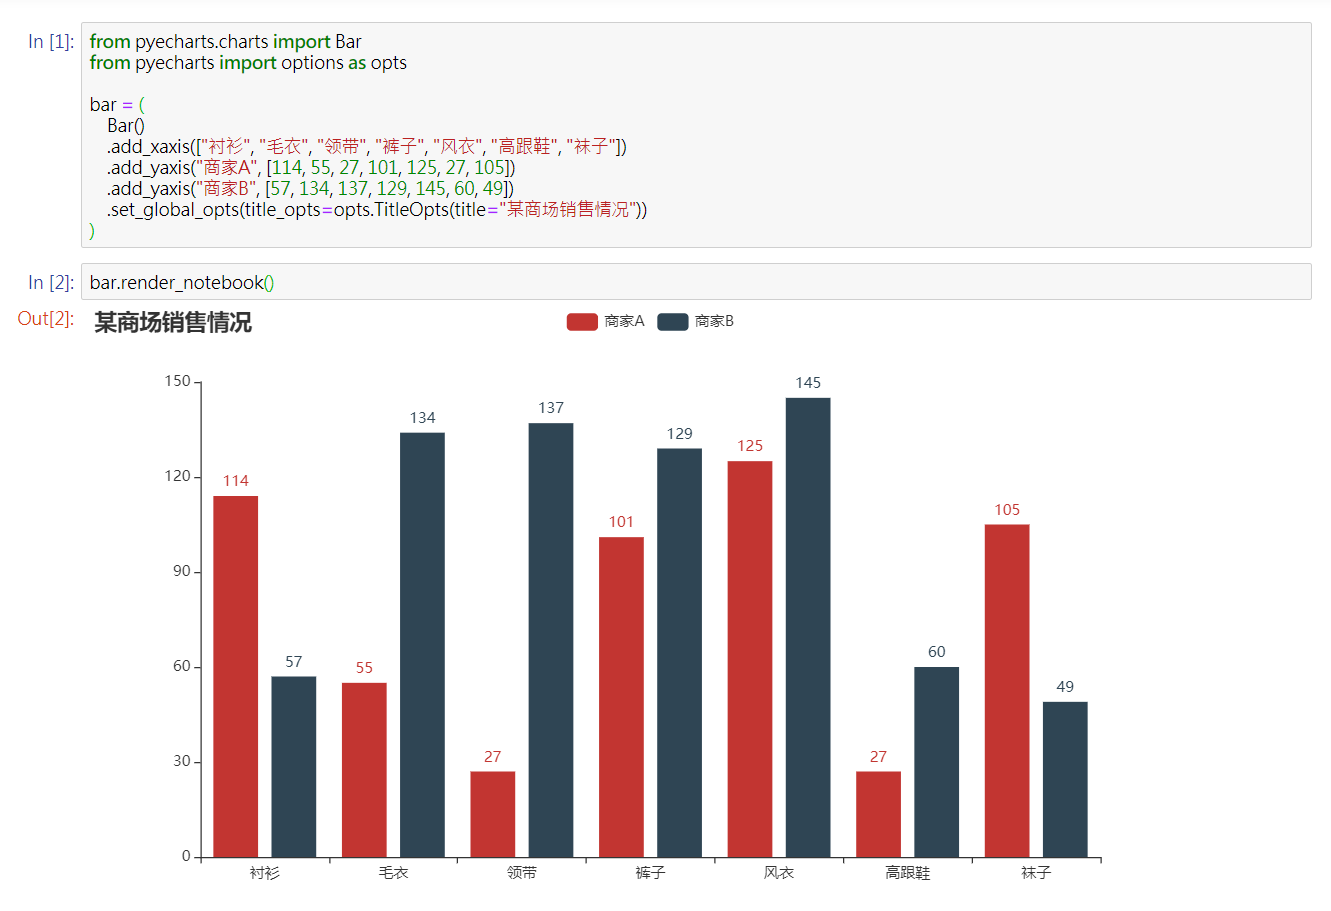
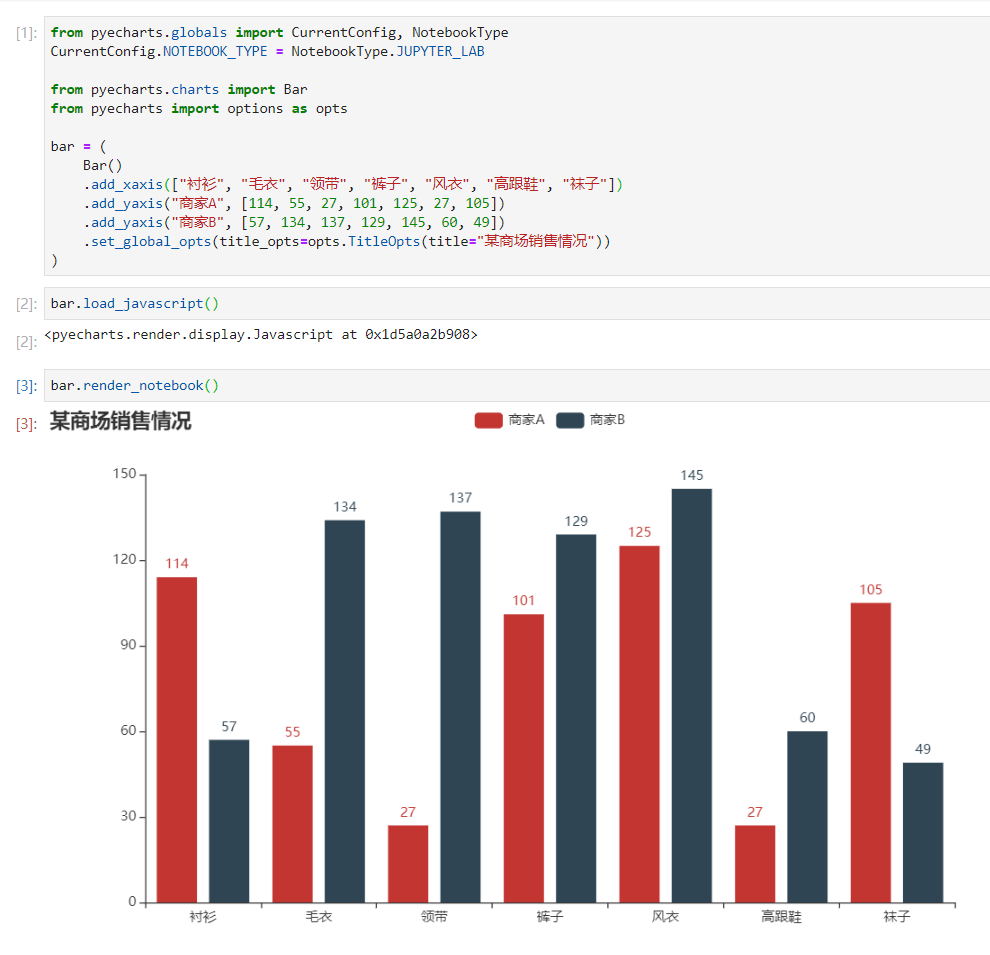
bar = (
Bar ()
. add_xaxis ([ "衬衫" , "毛衣" , "领带" , "裤子" , "风衣" , "高跟鞋" , "袜子" ])
. add_yaxis ( "商家A" , [ 114 , 55 , 27 , 101 , 125 , 27 , 105 ])
. add_yaxis ( "商家B" , [ 57 , 134 , 137 , 129 , 145 , 60 , 49 ])
. set_global_opts ( title_opts = opts . TitleOpts ( title = "某商场销售情况" ))
)
bar . render ()
# 不习惯链式调用的开发者依旧可以单独调用方法
bar = Bar ()
bar . add_xaxis ([ "衬衫" , "毛衣" , "领带" , "裤子" , "风衣" , "高跟鞋" , "袜子" ])
bar . add_yaxis ( "商家A" , [ 114 , 55 , 27 , 101 , 125 , 27 , 105 ])
bar . add_yaxis ( "商家B" , [ 57 , 134 , 137 , 129 , 145 , 60 , 49 ])
bar . set_global_opts ( title_opts = opts . TitleOpts ( title = "某商场销售情况" ))
bar . render ()
 from snapshot_selenium import snapshot as driver

from pyecharts import options as opts
from pyecharts . charts import Bar
from pyecharts . render import make_snapshot


def bar_chart () -> Bar :
    c = (
        Bar ()
        . add_xaxis ([ "衬衫" , "毛衣" , "领带" , "裤子" , "风衣" , "高跟鞋" , "袜子" ])
        . add_yaxis ( "商家A" , [ 114 , 55 , 27 , 101 , 125 , 27 , 105 ])
        . add_yaxis ( "商家B" , [ 57 , 134 , 137 , 129 , 145 , 60 , 49 ])
        . reversal_axis ()
        . set_series_opts ( label_opts = opts . LabelOpts ( position = "right" ))
        . set_global_opts ( title_opts = opts . TitleOpts ( title = "Bar-测试渲染图片" ))
    )
    return c

# 需要安装 snapshot-selenium 或者 snapshot-phantomjs
make_snapshot ( driver , bar_chart (). render (), "bar.png" )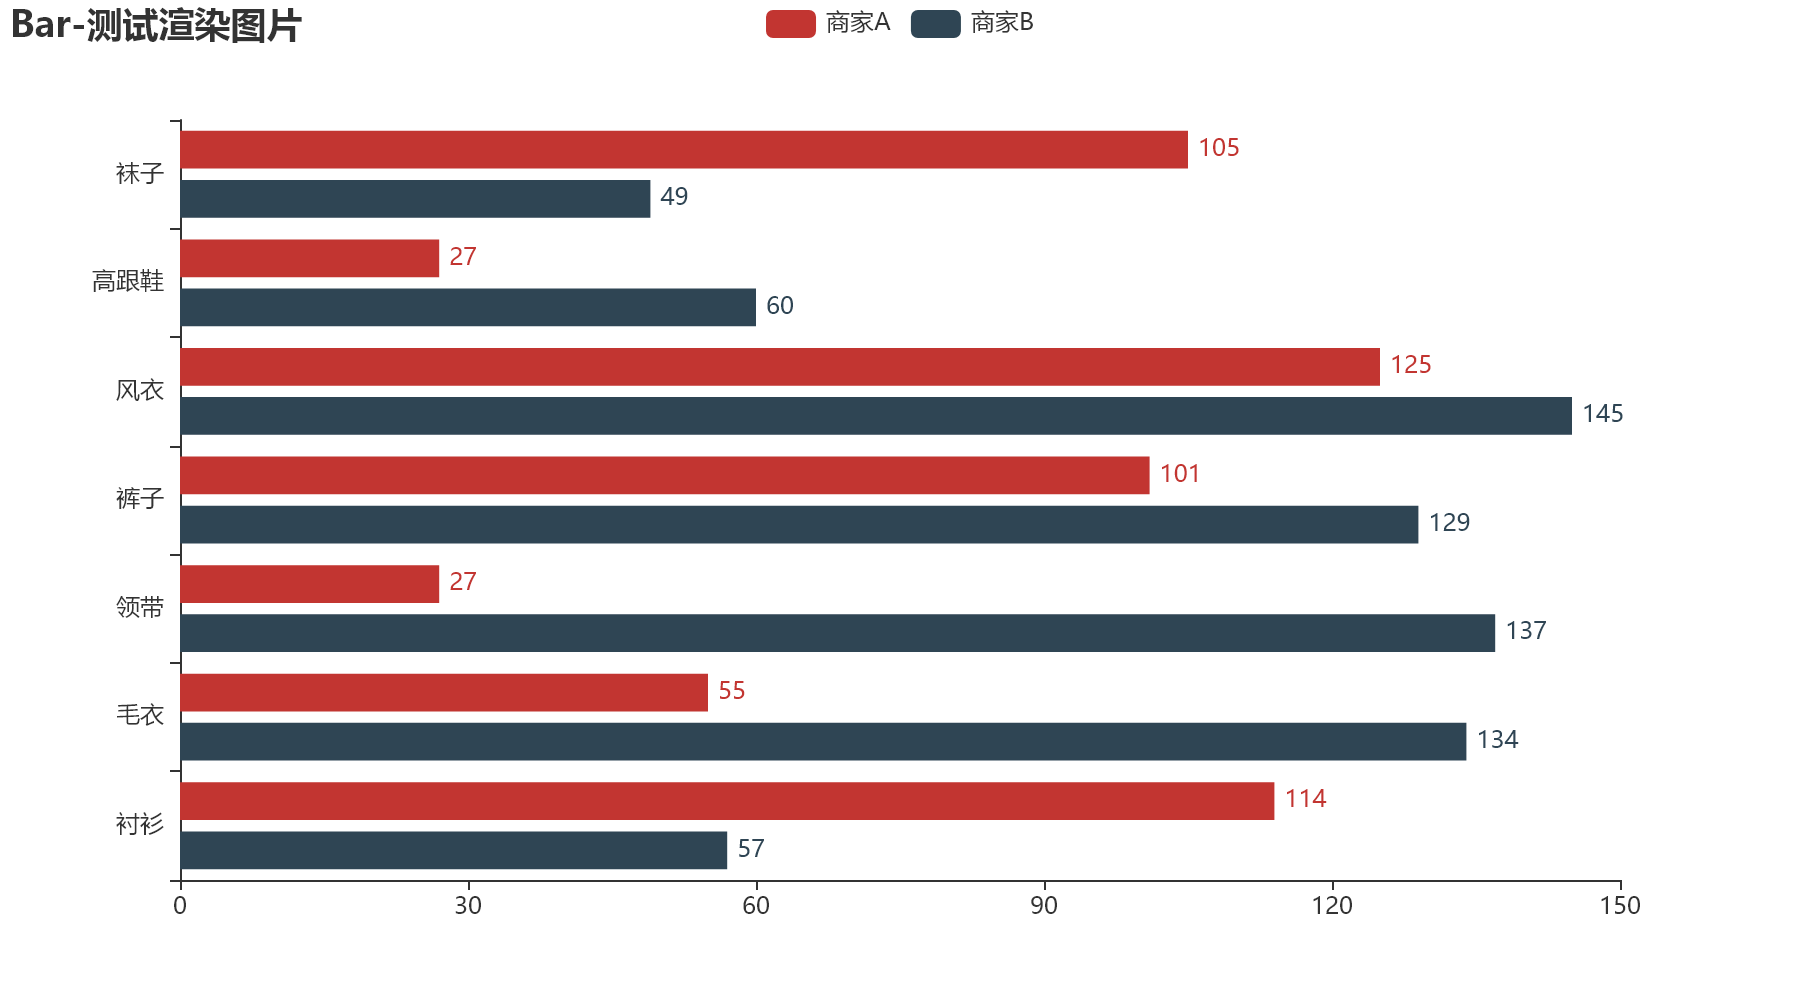
The Demo code is located in the example folder. Welcome to refer to the pyecharts gallery pyecharts-gallery.

For more detailed documentation, please visit
$ pip install -r test/requirements.txt
$ makeContinuous integration environment using Travis CI and AppVeyor.
Use flake8, Codecov and pylint to improve code quality.
pyecharts is mainly developed and maintained by the following developers
More contributor information can be found at pyecharts/graphs/contributors
We look forward to more developers participating in the development of pyecharts. We will ensure to Reivew PR as soon as possible and respond in a timely manner. But when submitting a PR please make sure
We also very much welcome developers to provide more examples for pyecharts and work together to improve the documentation. The documentation project is located at pyecharts/website
MIT ©chenjiandongx


