Seer - a gui frontend to gdb for Linux. (Ernie Pasveer [email protected])
This project is actively worked on. The aim is a simple, yet pleasing gui to gdb.
Please report any bugs or desired features to my email or create a task in my GitHub project page.
Seer can be installed either from a package manager or from source.
Note
Make sure the requirements are met before installing.
Linux
C++17
gdb with "mi" interpreter (check by running: gdb --interpreter=mi)
CMake (3.1.0 or newer)
QT6
QT5
Available through the following package managers:
pamac install seer
zypper install seergdb
(Recommended) Seer can be built with Qt6 by following the instructions below.
https://github.com/epasveer/seer/wiki/Building-Seer---Qt6
It can still be built with Qt5, for the time being by following the instructions below.
https://github.com/epasveer/seer/wiki/Building-Seer---Qt5
Check out Seer's Wiki page on github.
Examples of the various Seer views and dialogs.
The main view for Seer looks like this:
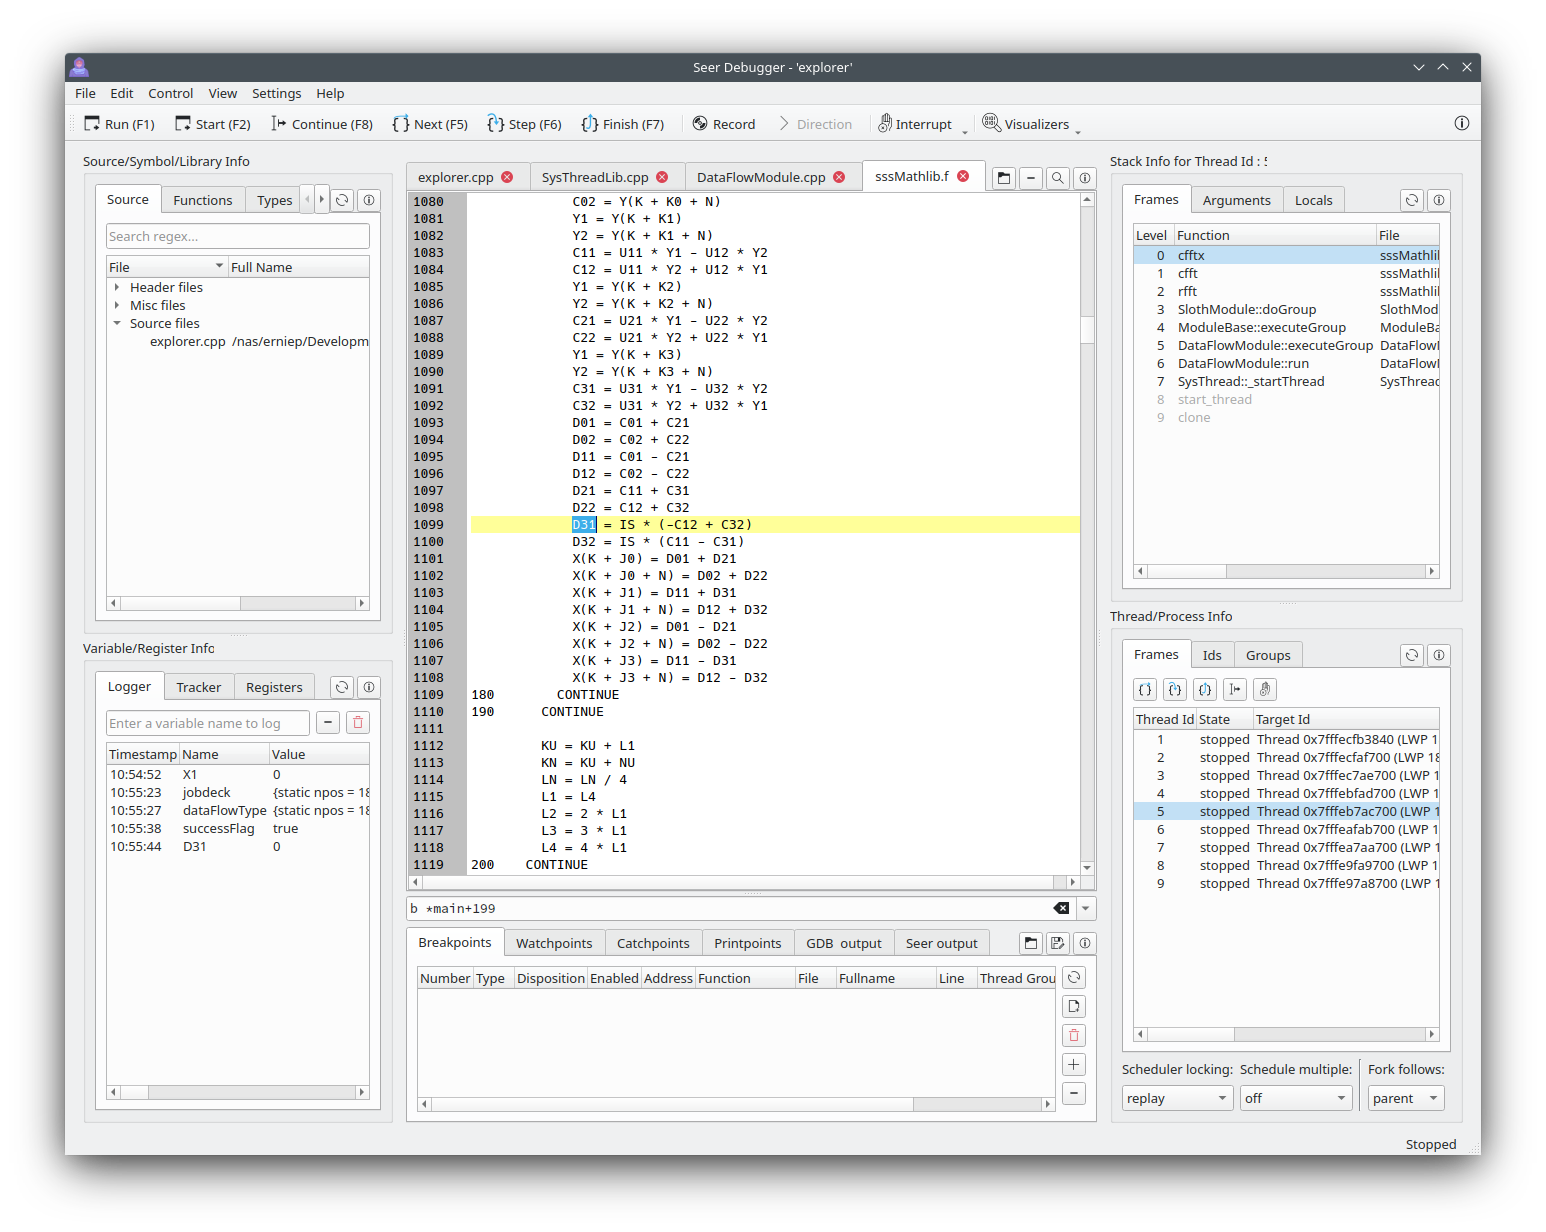
Source/Function/Types/Variables/Libraries
Variable/Register Info
Code Manager.
Breakpoints, Watchpoints, Catchpoints, Printpoints, manual gdb commands, and logs.
Stack frame information.
Thread information.
Supports Gdb's Reverse Debugging mode.
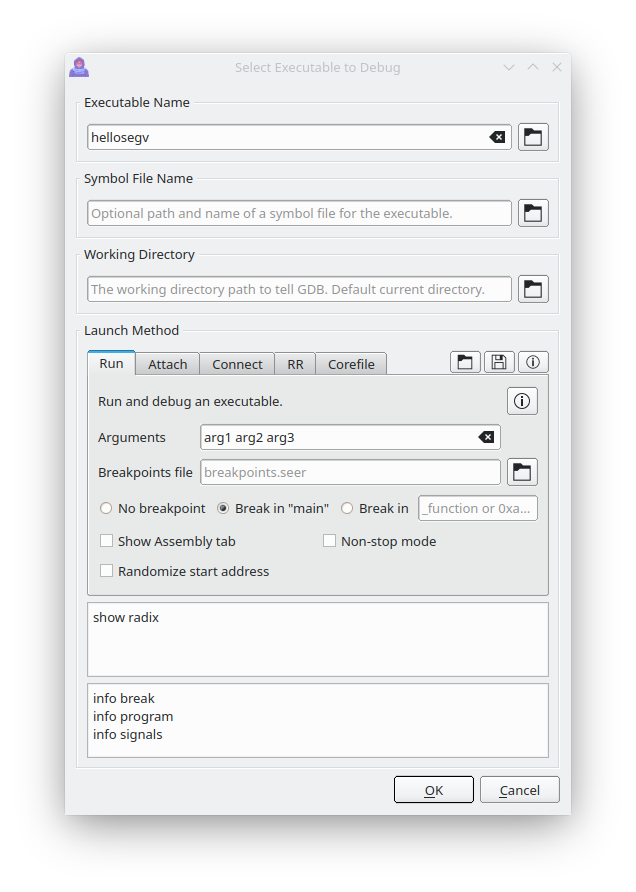
When the open executable dialog is invoked, it looks like this:
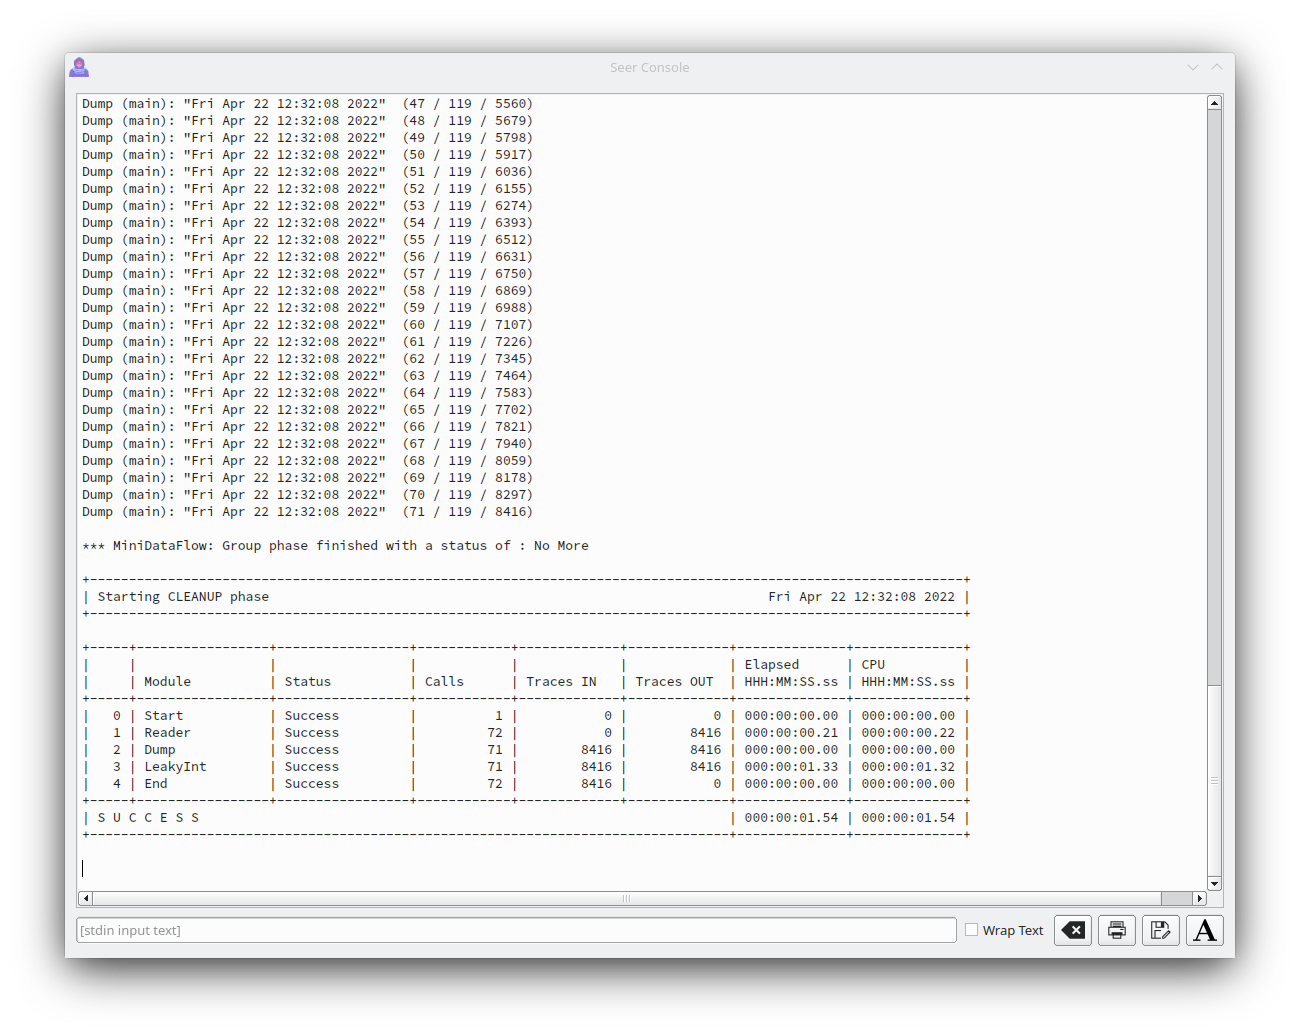
All text output from the executable will go to the Seer console. Text input for the executable can be entered via the console too.
Normally Seer will just show the source code as tabs in the Code Manager. The program's assembly can also be show as a tab.
Select "View->Assembly View" and an extra tab will be shown alongside the source code tabs that shows the current assembly being executed. Here is an example.
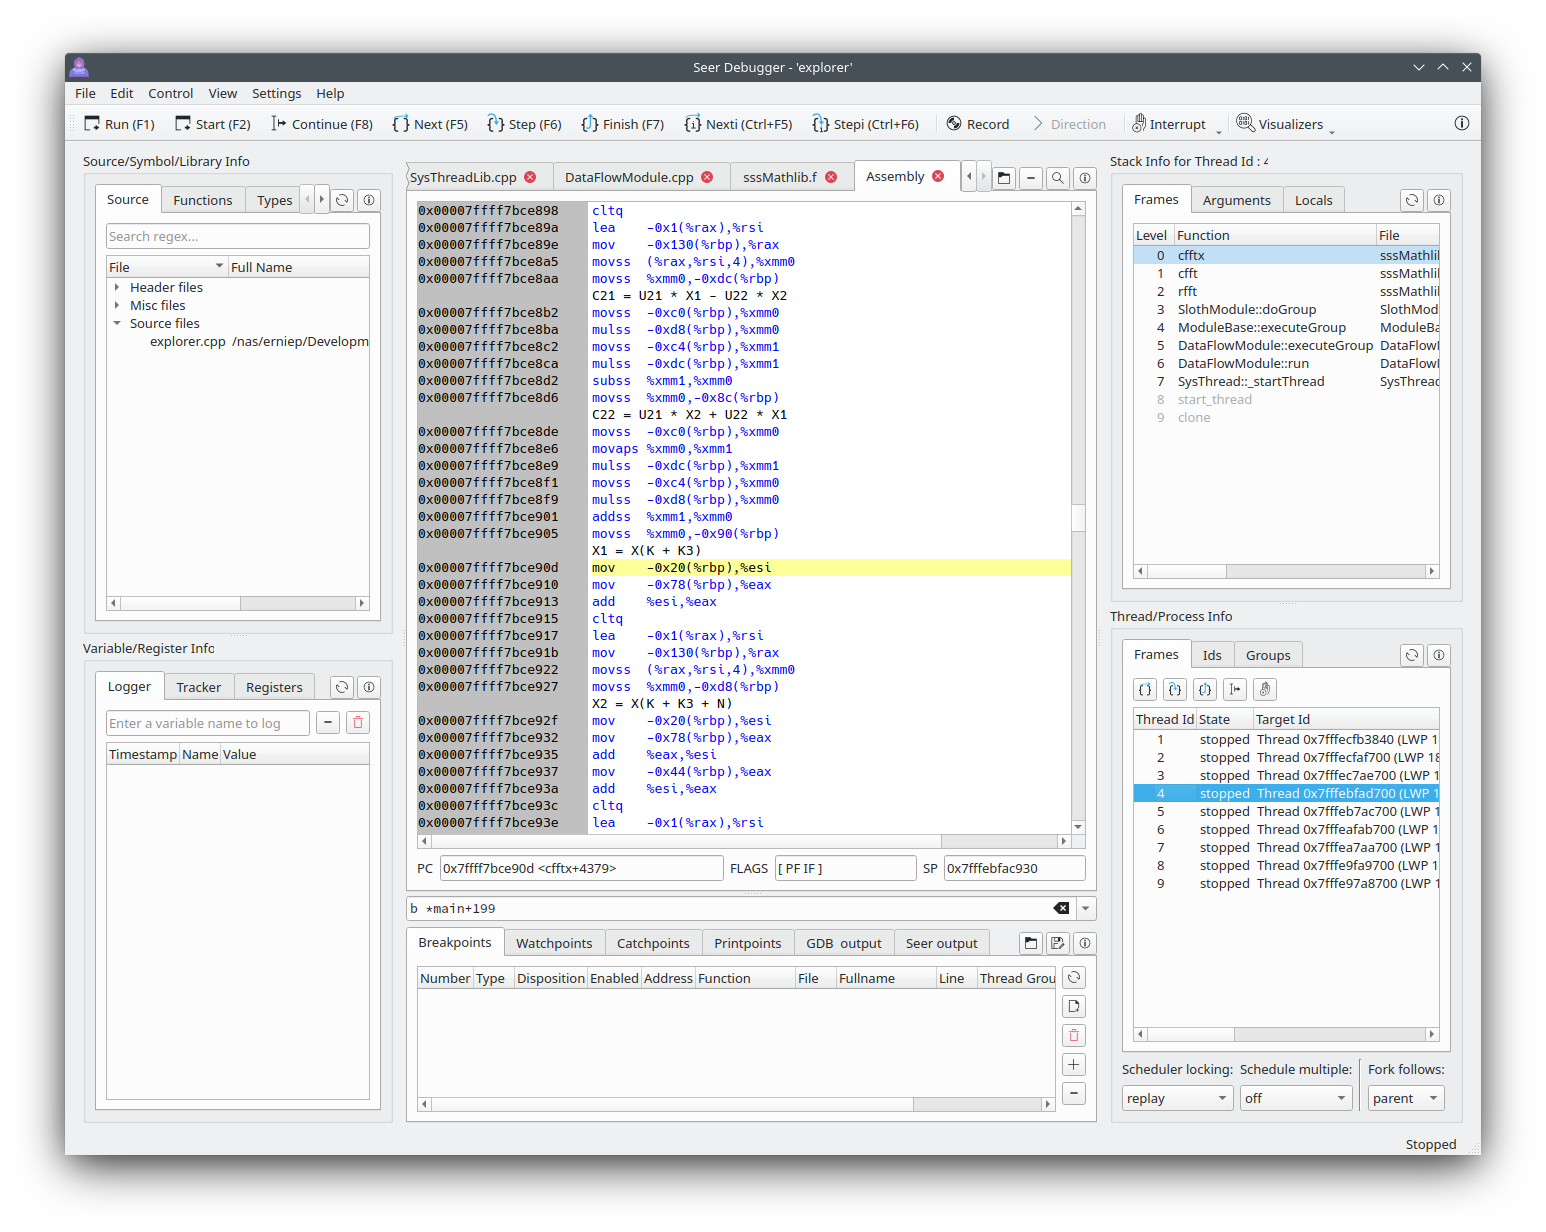
Like the source code tabs, breakpoints can be set in the assembly tab. The current instruction is highlighted.
Double-clicking on entries in the "Breakpoints" tab and the "Stack frames" tab will show the assembly for those addresses.
There are "Nexti" and "Stepi" hot-keys, as defined by your config settings. Normally "Ctrl+F5" and "CTRL+F6". Using "^F" in the assembly tab will show a powerful search bar.
The assembly feature in Seer is new. Feel free to suggest changes/features.
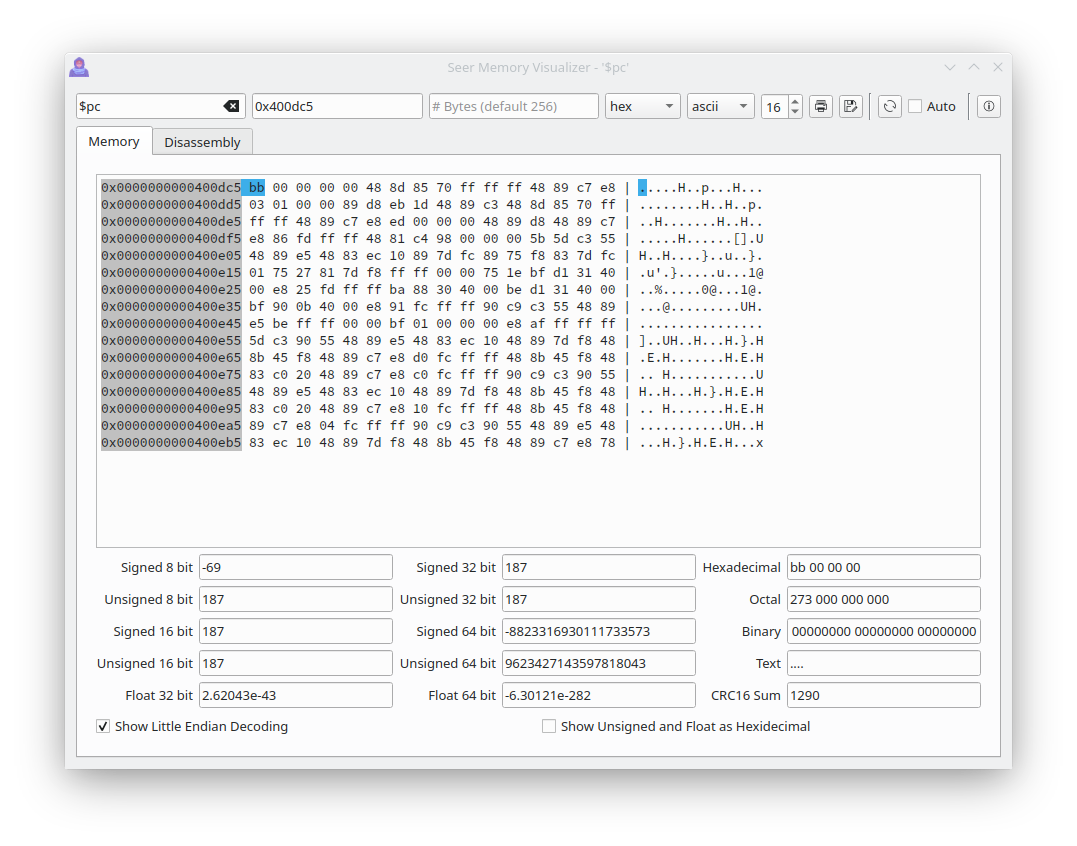
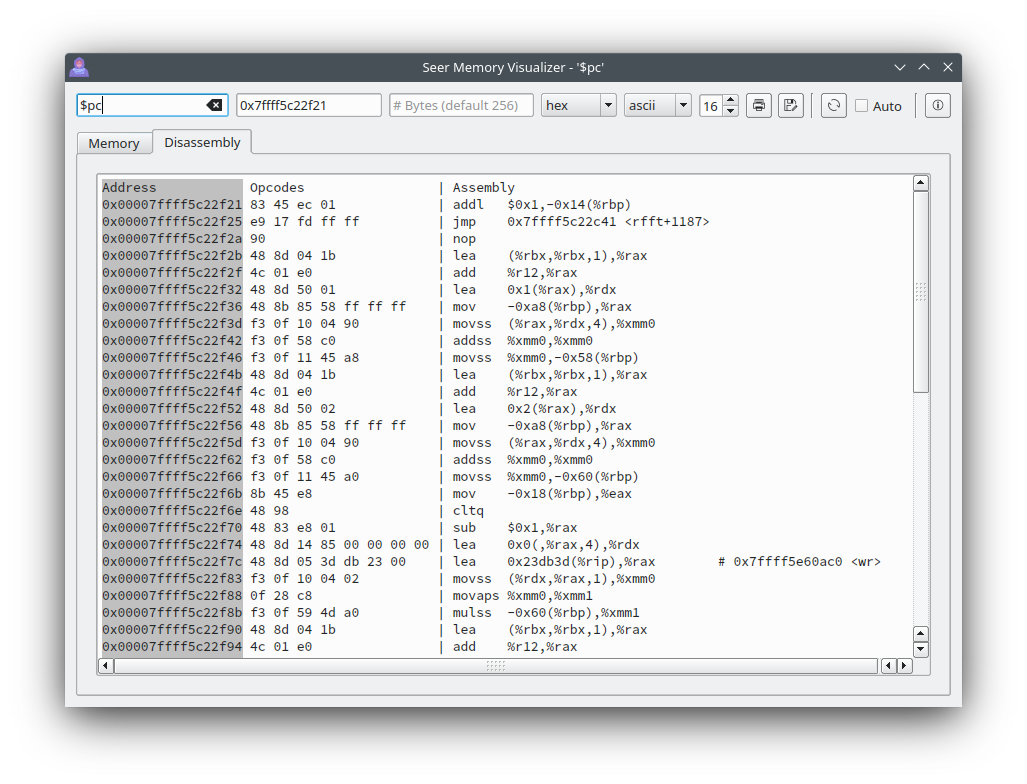
When looking at the contents of raw memory in the Memory Visualizer, it looks like this :
| Memory | Disassembly |
|---|---|
 |
 |
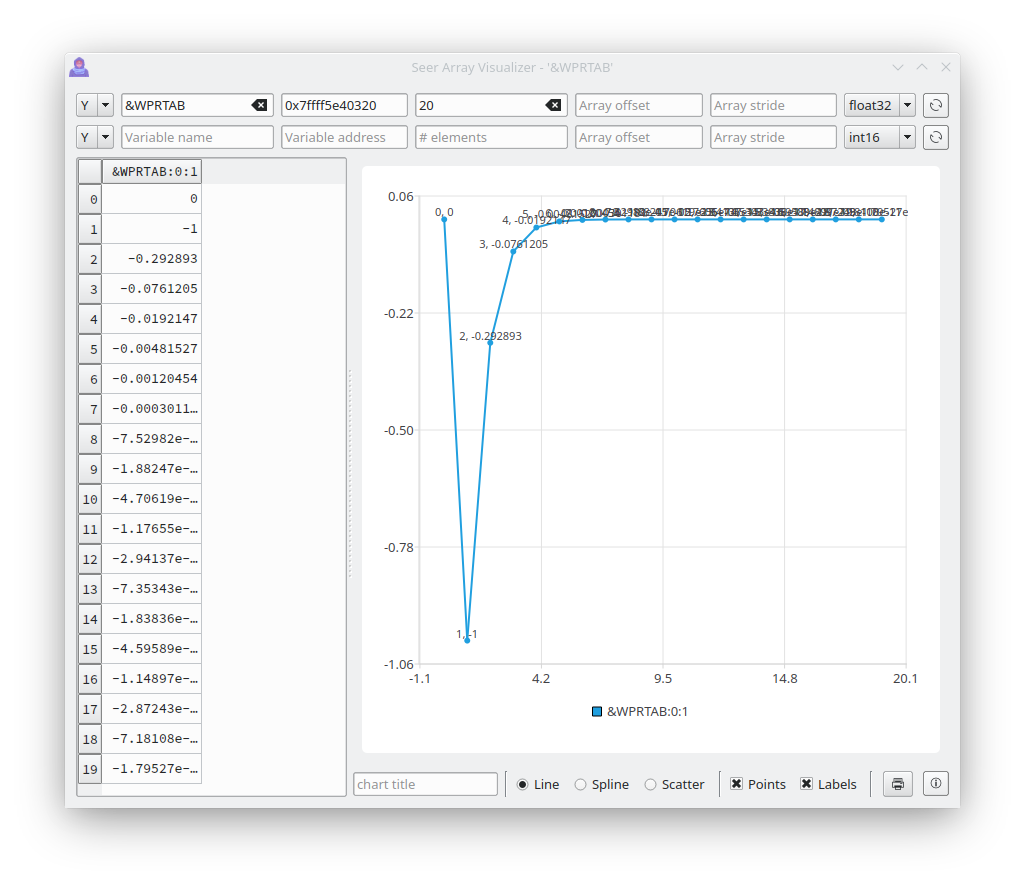
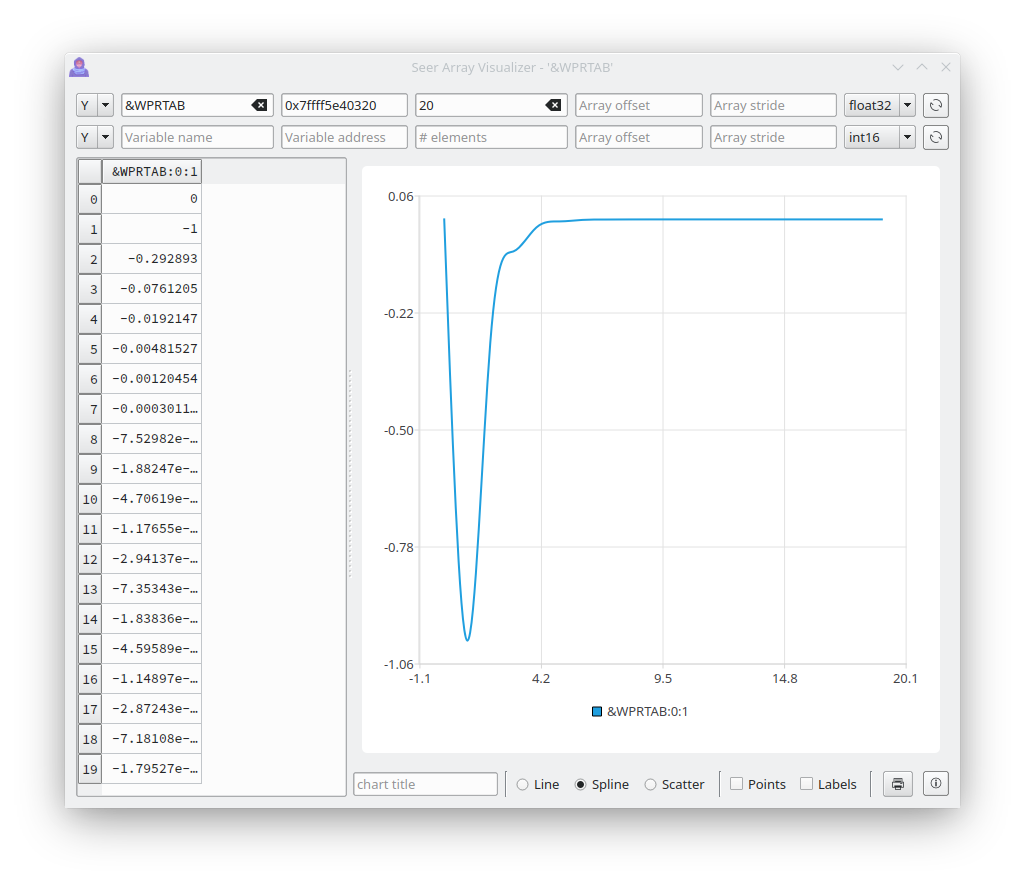
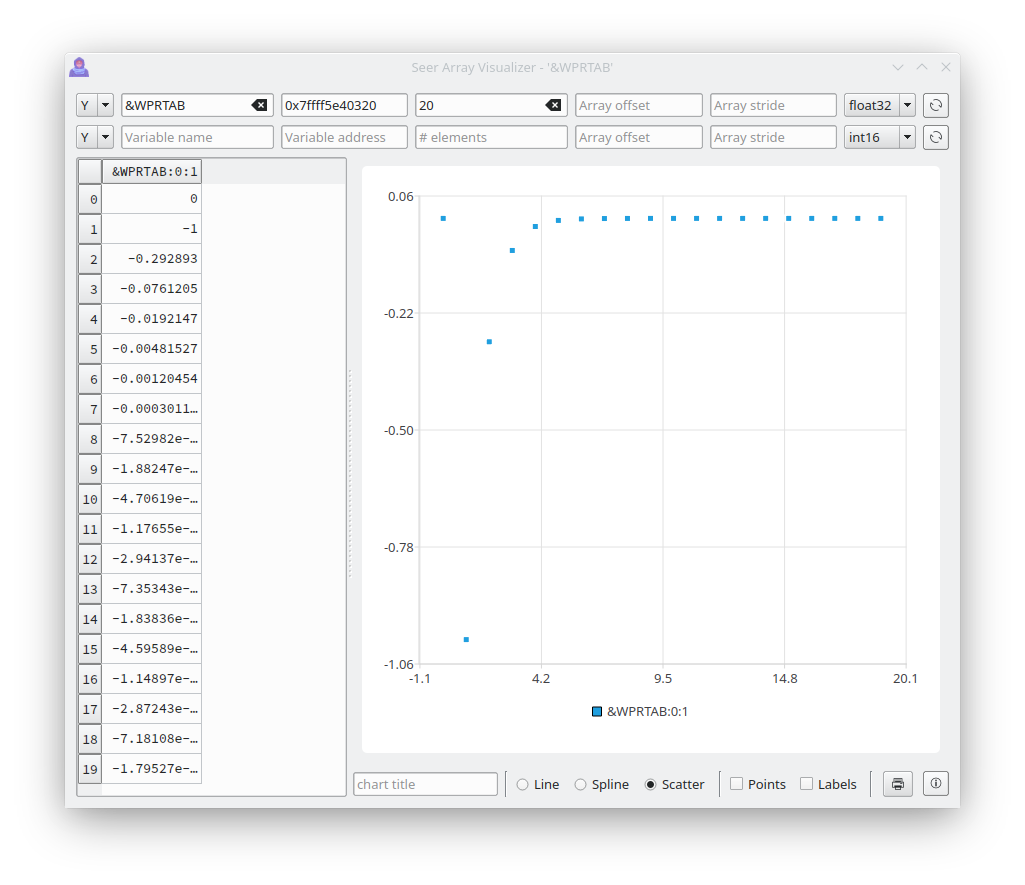
When looking at the contents of arrays in the Array Visualizer, it looks like this :
| Normal | Spline | Scatter |
|---|---|---|
 |
 |
 |
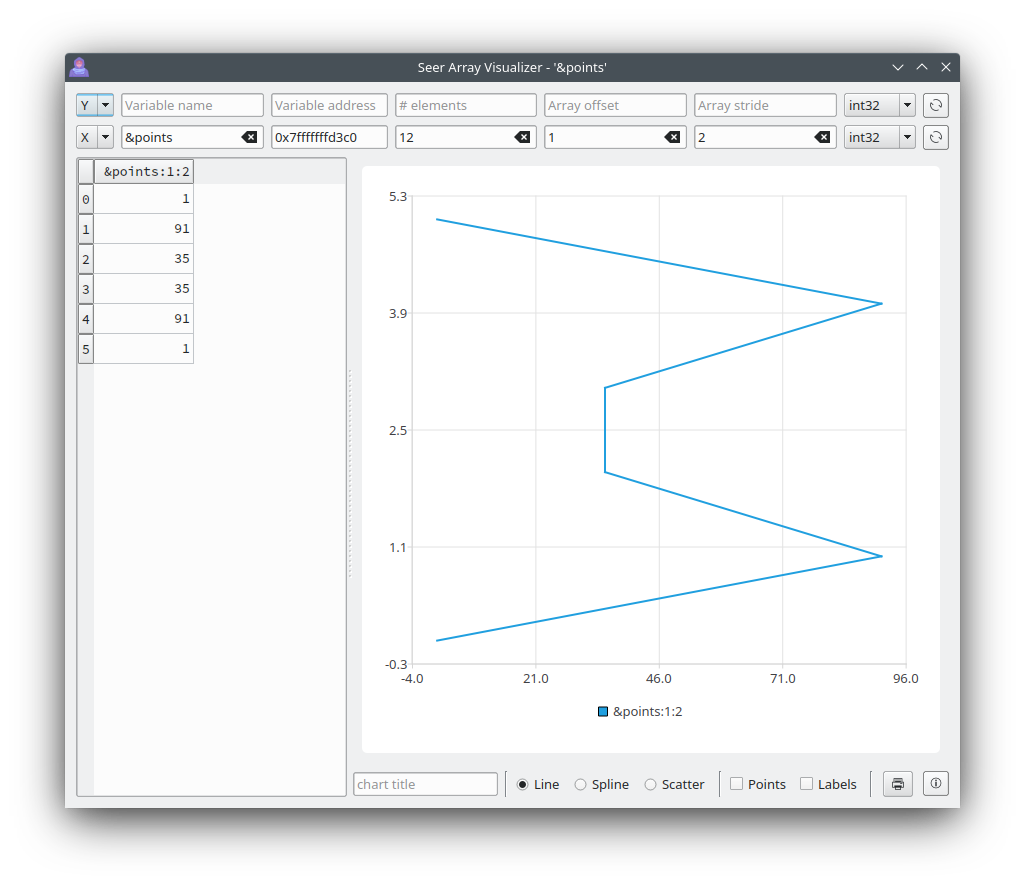
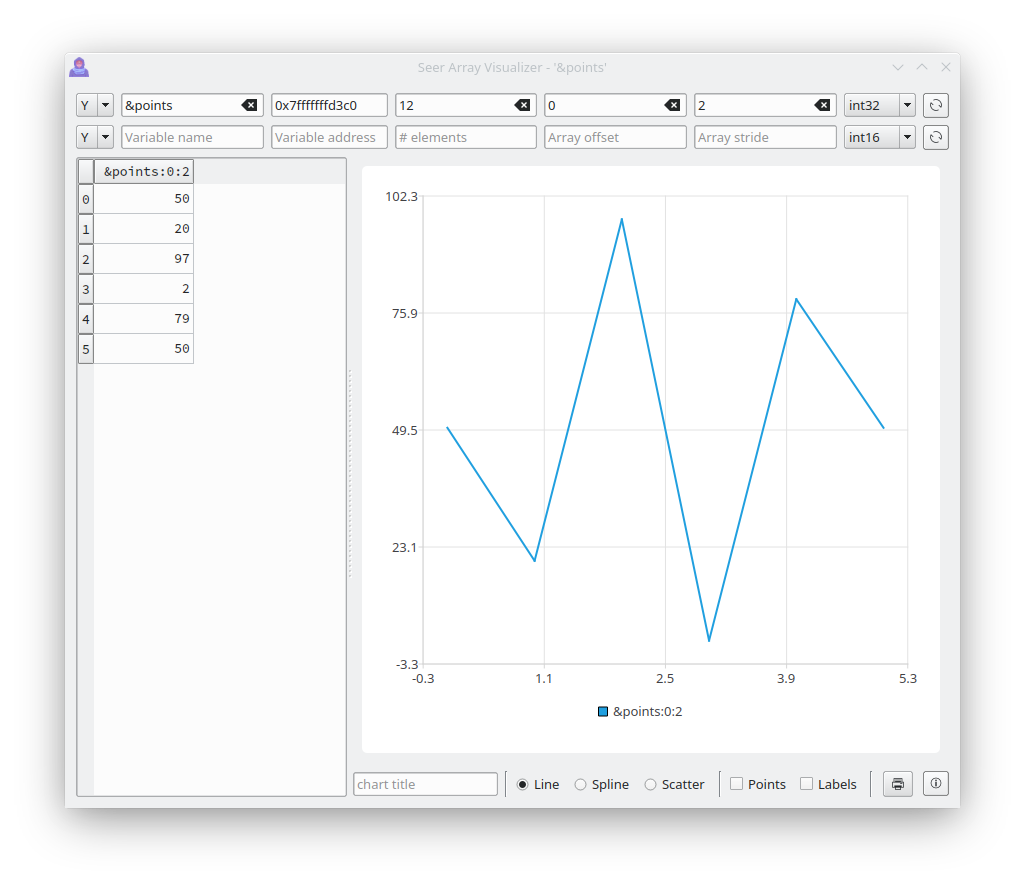
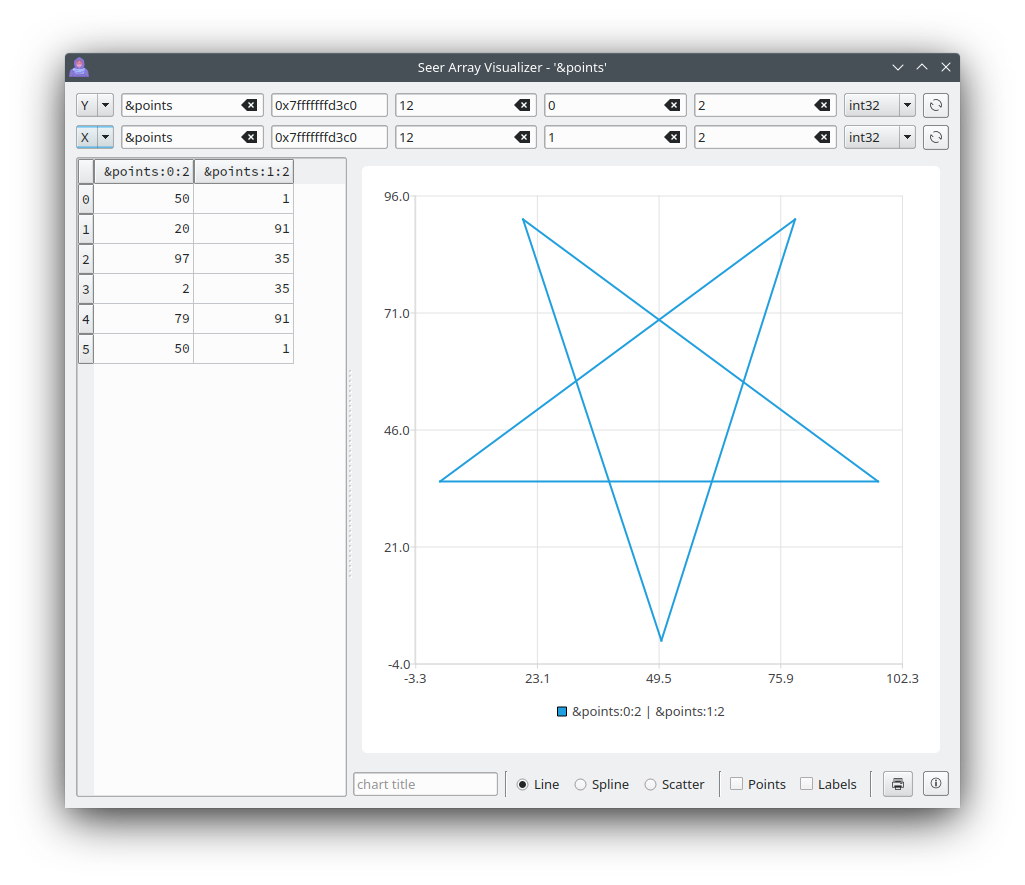
Two arrays can be used as an X-Y plot. For example, this simple 'points' array forms the X-Y outline of a shape.
    int main() {
        int points[] = {50,1,20,91,97,35,2,35,79,91,50,1};
        return 0;
    }
| X values | Y values | XY Values |
|---|---|---|
 |
 |
 |
When looking at the contents of a C/C++ struct or a C++ class in the Struct Visualizer, it looks like this. This example shows the contents of "*this" for the current C++ class that Seer is in. All structure members that are basic types can be edited.
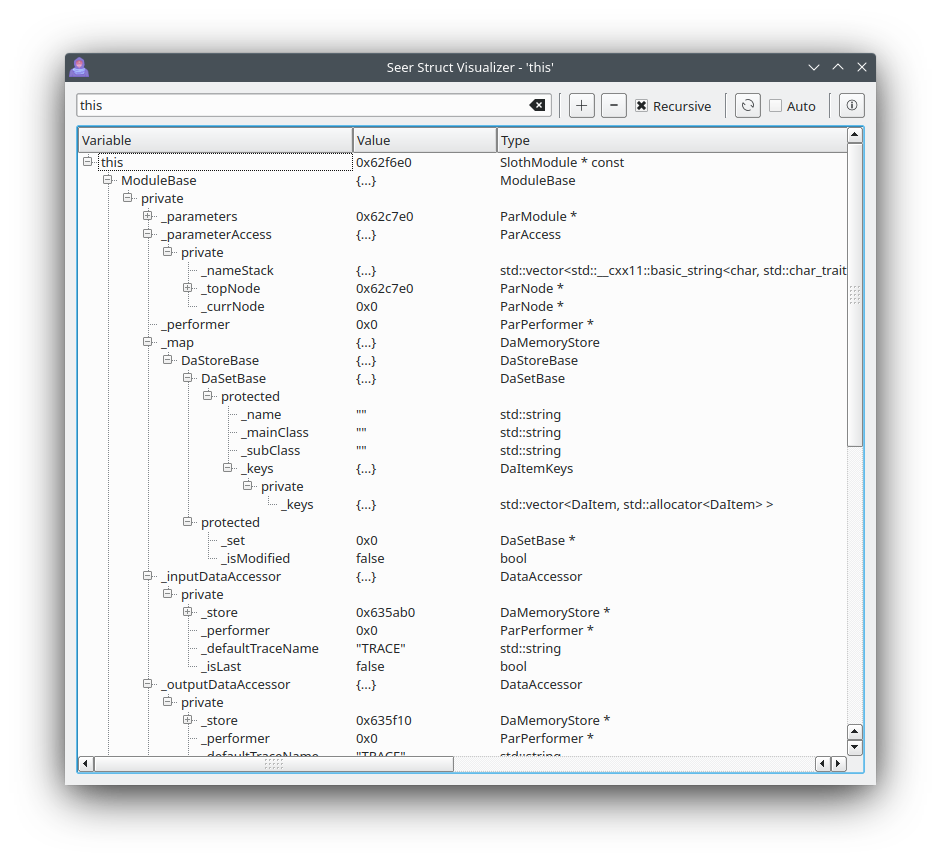
There is also a Basic Struct Visualizer that is more light weight, but can not follow pointers and can not be edited.
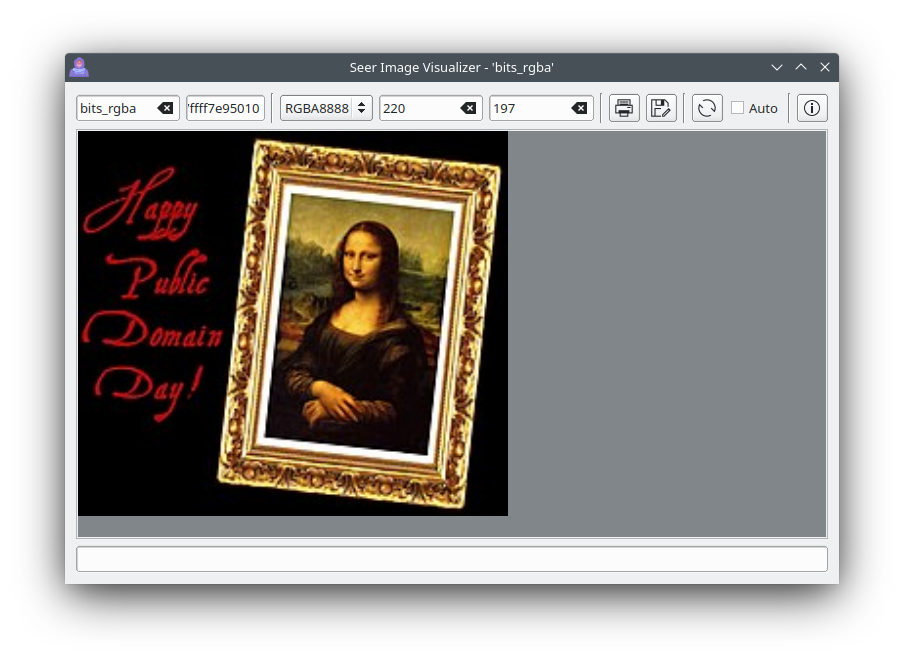
When looking at the contents of raw memory that is an image, the Image Visualizer can be used.
Seer is meant to easily start the program to debug from the command line. gdb has multiple methods for debugging a program. So Seer naturally does too.
Go to the Wiki to see all the ways to run Seer.
https://github.com/epasveer/seer/wiki/Starting-Seer
Send an email to [email protected] for any bugs or features. Or create a task in my GitHub project page.