Falcon is a communication inspection tool. It mainly enables you to test UDP, TCP and Serial communication easily. But that is not it, Falcon is packed with other capabilities:
Falcon was desinged with ease of use in mind, and I hope you will find it helpful.
Use the issues section. Please describe in details what is the issue, and I will try to answer as soon as possible.
No installation is needed for running Falcon. Just download it and run.
The next section is dedicated to brief instructions on how to use Falcon.
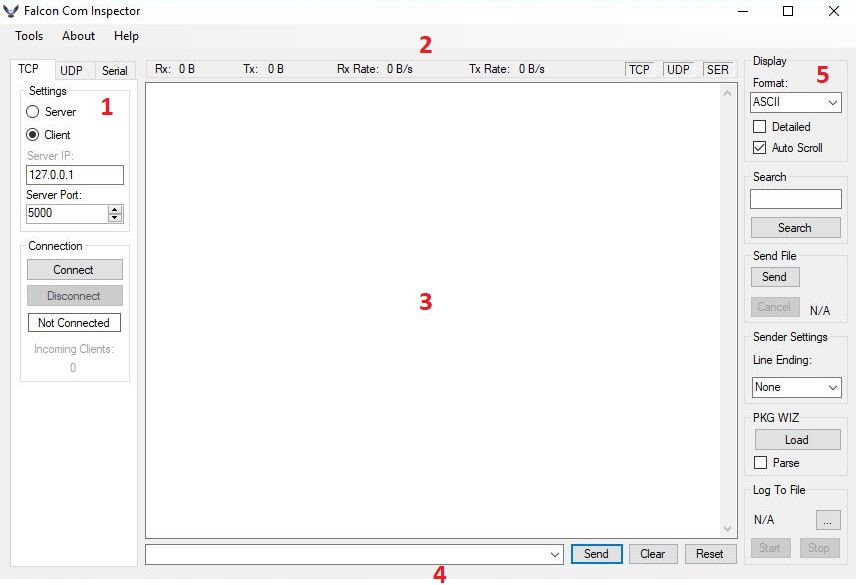
The main screen is devided to sub-sections:
here you can chose the type of connection protocol you want to listen / publish to. For TCP and UDP connection you can open either a client or a server. When choosing server, IP text box will disapear, because it is determined automatically by the PC current IP. When listening on a TCP server, an indication "Incoming clients" show you how many clients are connected to you. On Serial connection, the "COM:" list will be filled with available usb serial connections. Choose one and set the serial settings according to your needs.
Note: At all times, only a single connection is allowed.
This bar is showing you some statistics about bytes stream:
The display show the incoming bytes
This part consist of the sending text box, and 3 buttons: send, clear and reset. Write anything in the sending windows, and press "enter" or "send" to send it throught the open connection. If no connection is open, no sending attempt will be made. This text box also save the sending history. When inside that box, you can use the up/down arrows to skip throught history.
Clear button will clear the display from any characters.
Reset button will reset the statistics on the top bar.
This section enables you to set different settings from bytes representation to line ending (for sending). Most of these settings doesn't need to be explained as they speak for themselves. But here are some who do:
Features:
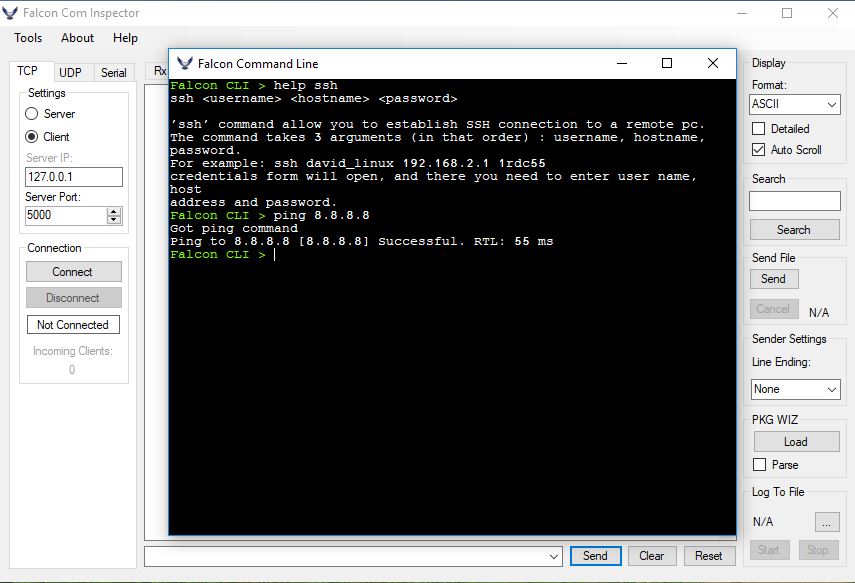
Navigate to CLI: Tools -> Command Line
The falcon CLI enables you to write a set of commands (some of them are similar to windows / linux commands) in order to use additional falcon capabilities. Those are the available commands: ssh, ping, help, clear. To understand how to use any of those commands, type "help" and then the name of the command. For example:
help ssh
This will result in an output of what is the command, its structure and example how to use it.
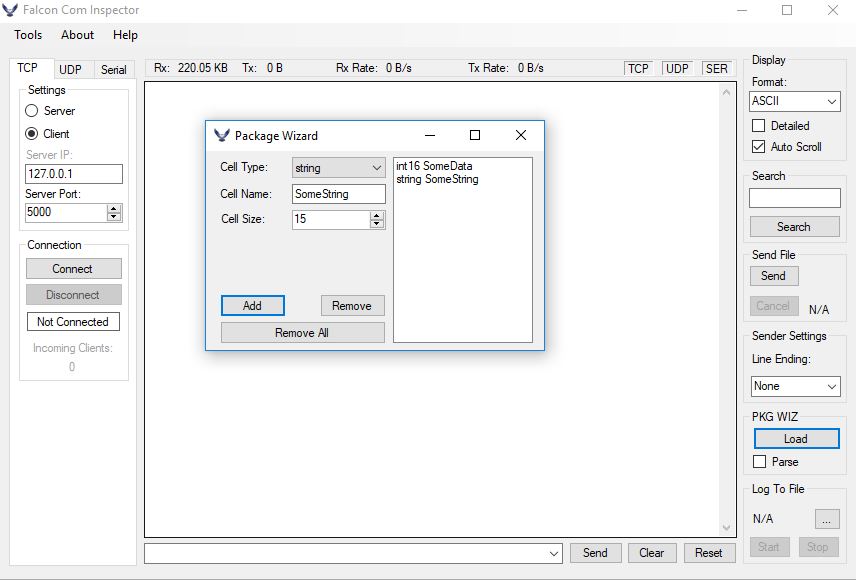
Navigate to PKG WIZ: On the right column, inside the PKG WIZ box, click "Load"
Imagine you need to implement an application level protocol. Wouldn't it be nice if you could send a dummy package of that protocol, and let Falcon parse that package for you in order to test it? Well, it can be done pretty easily.
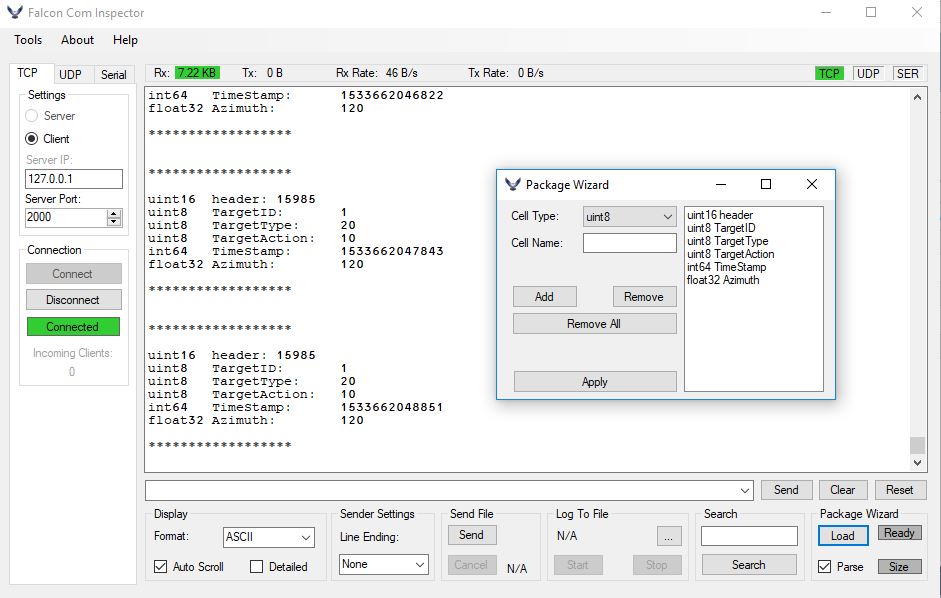
Inside the PKG WIZ manager, create a package according to your protocol:
Choose a field type, give it a name and press "Add". This will add the field to the package. Later PKG WIZ will try to parse the incoming bytes into the defined package. The order of which the fields appear in the list, is the same one used for parsing.
After you are done building the package, press "X" to close the PKG WIZ window, connect to UDP or TCP server or client, and check the "Parse" checkbox inside the PKG WIZ box on the right column. If packages are parsed successfuly, you should see something like this (depending on your package) :
Note: PKG WIZ parsing can only work with TCP or UDP connections for now.
Navigate to Plot: Tools -> Plot
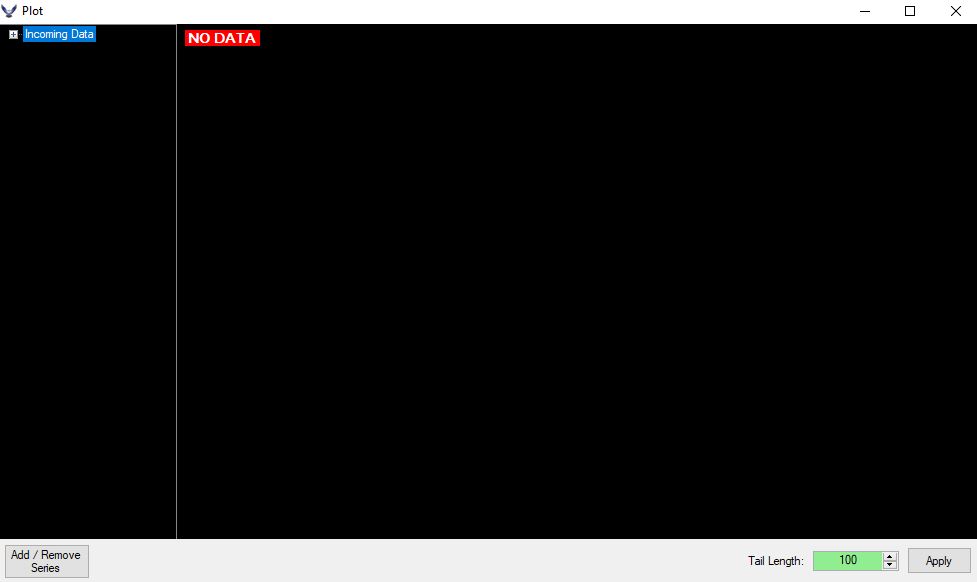
Before openning plot window, connect and make sure you are getting data inside the display. When opening the plot window, it listens on the open connection. If no incoming data, a "NO DATA" red flag will apear. Otherwise, if there is data but it is unvalid, a "INVALID DATA" red flag will apear. A valid data is a string which contains 10 doubles by "," . The string should start and end with "|" . So for example:
|-0.87,0.50,0.00,0.00,0.00,0.00,0.00,0.00,0.00,0.00|
In the above string the 2 first values are -0.87 in index 0, and 0.5 in index 1. The rest of the values are 0. While getting data, we need to add it to the plot in order to get a visual representation of it. Click on "Add/Remove Series" button at the bottom left corner of the plot window. Then, Select a series type:
For this example, add Data type, name it "some double" and select index 0. Then press add, and "X" to close the series manager. Now the values in index 0 of the incoming string should appear on the plot. In top left side there is a tree of values. Expand it to see the numeric valud of index 0.
In the bottom right corner, you can define how long will be the tail of the line on the graph. In other words: how many values since last one arrived to show on the plot. If you change this, click "Apply".
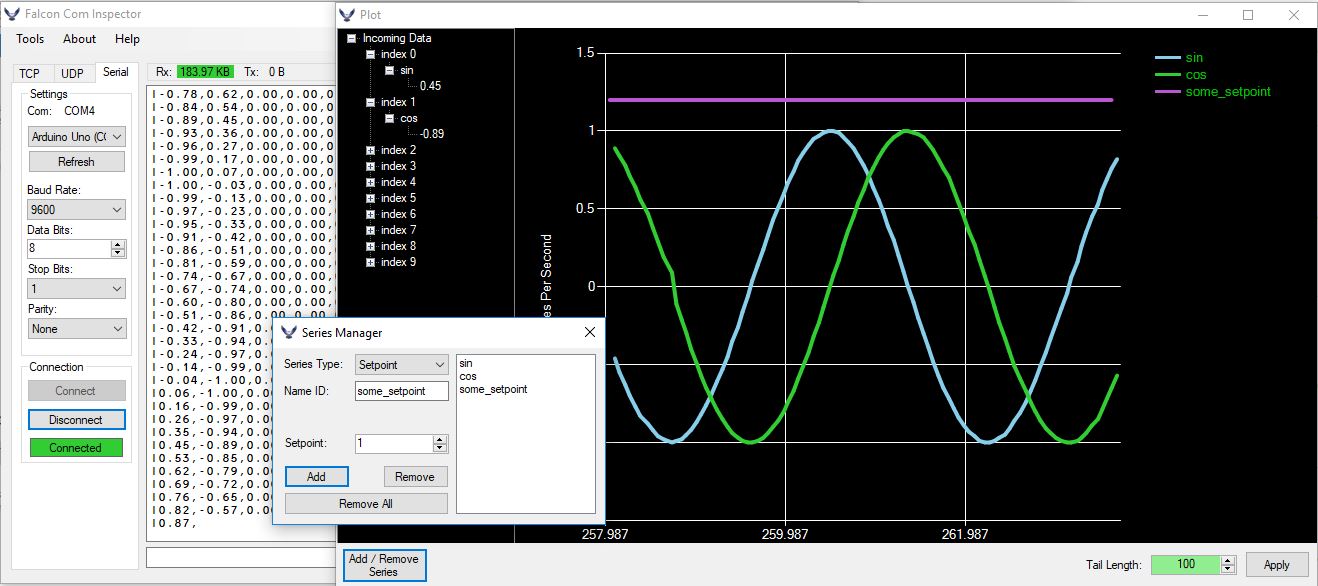
If you are using arduino and want to see some values on the plot, look at the plot example of arduino here. Flash this example to your board, open Falcon and connect to it throught Serial. Then open plot and add the desired data index. It should look something like that:
