binnacle
1.0.0
A
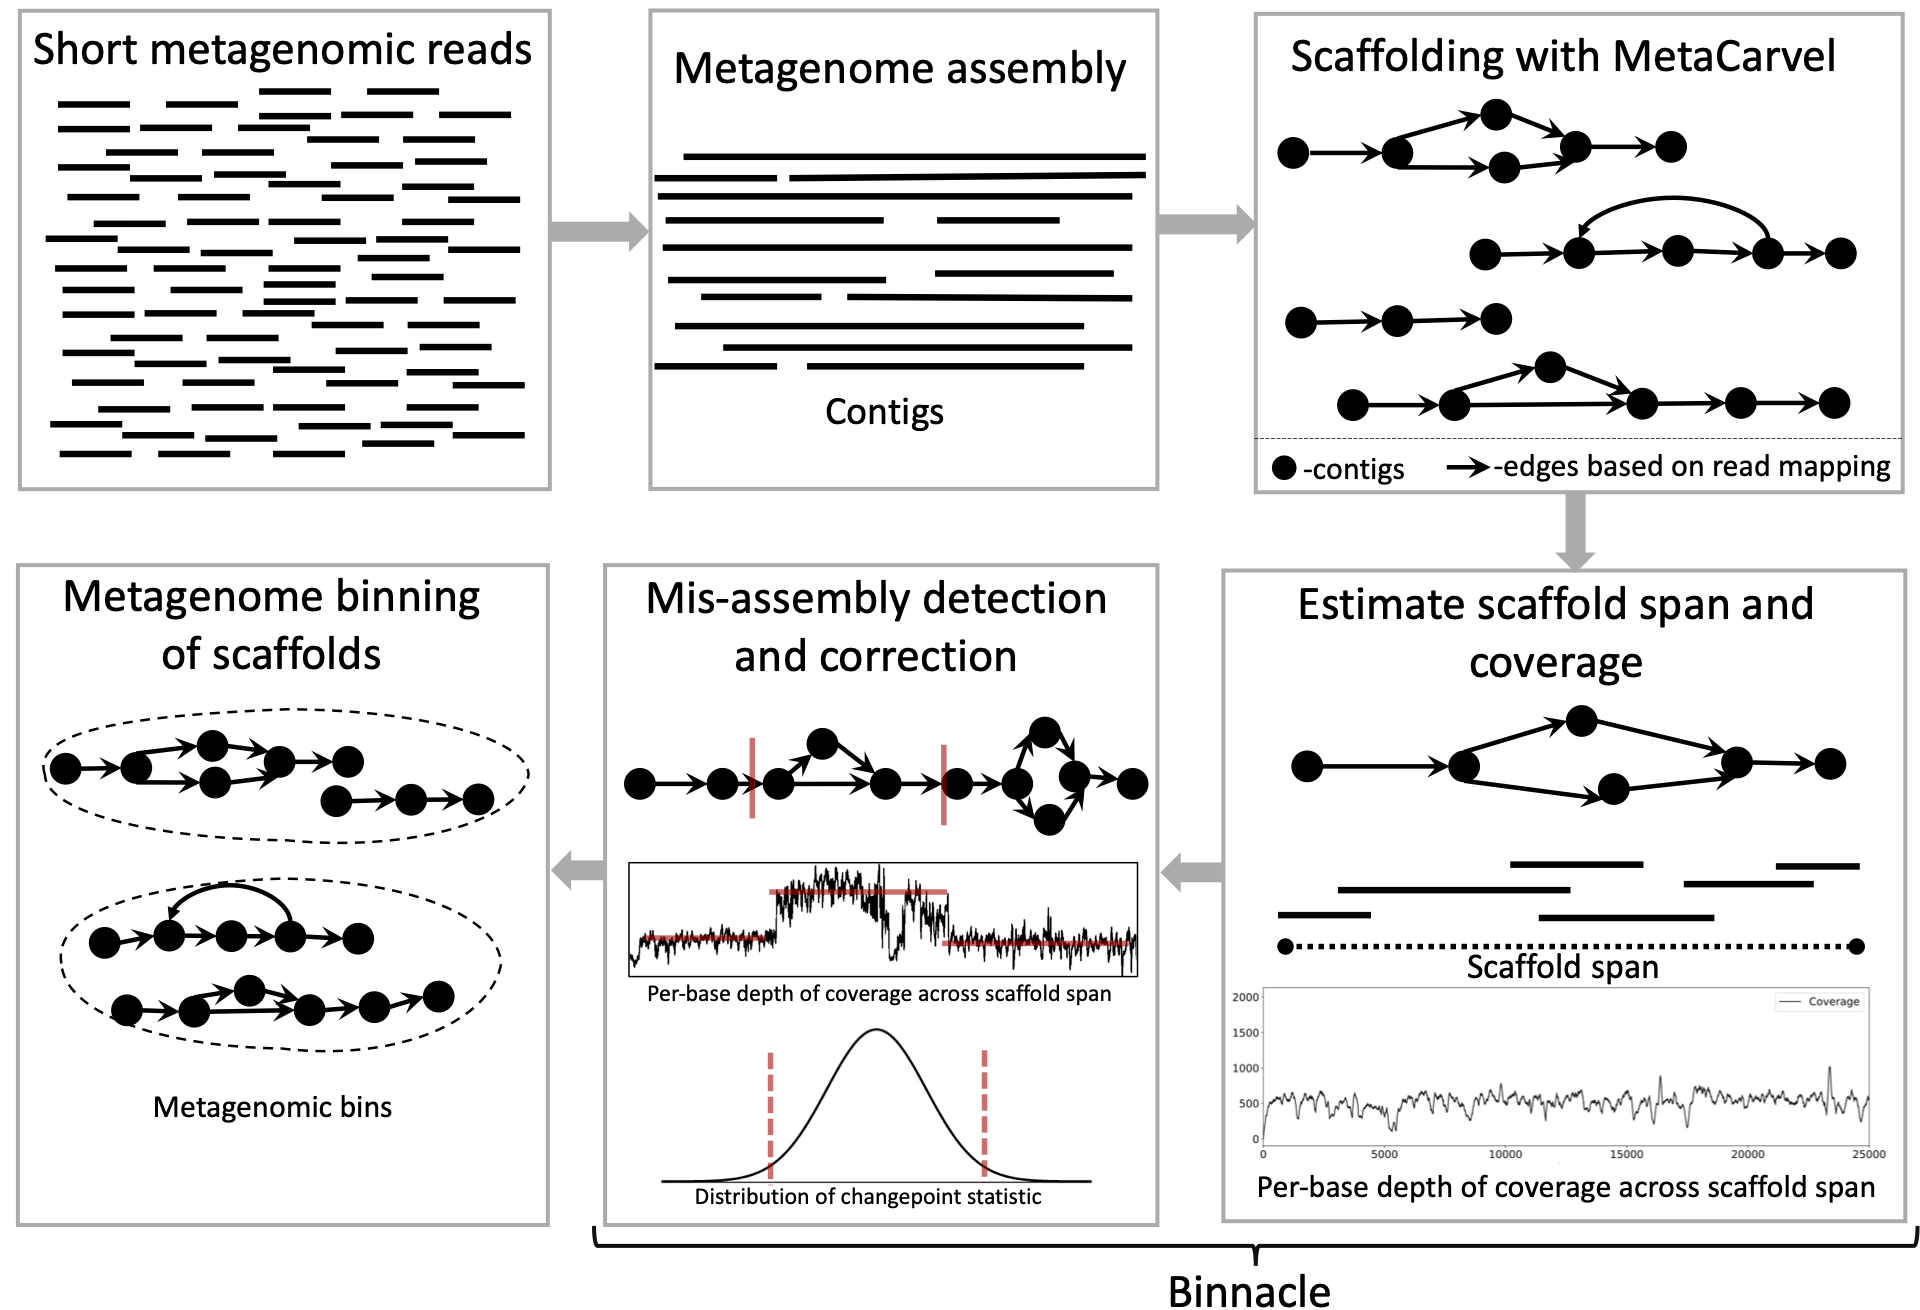
Binnacle calcula con precisión la cobertura de andamios gráficos y se integra perfectamente con los principales métodos de binning como Metabat2, Maxbin 2.0 y Concoct. El uso de andamios gráficos, a diferencia de los contigs (enfoque más común) para la agrupación mejora la contigüidad y la calidad de los contenedores metagenómicos y puede capturar un conjunto más amplio de los elementos accesorios de los genomas reconstruidos.
Para ejecutar Binnacle, necesitará Python 3.7.x, Bedtools, SamTools, Biopython, Networkx, Numpy y Pandas.
Un archivo ambiental.yml está disponible y esto se puede utilizar para crear un entorno de conda que sea adecuado para ejecutar binnacle. Aquí se proporciona la documentación detallada sobre cómo instalar estos paquetes. Utilizamos andamios gráficos que son la salida de la herramienta de andamio Metacarvel, por lo que también deberá descargar e instalar Metacarvel. Hay una guía de instalación paso a paso para Metacarvel.
En general, cuando tiene una o múltiples muestras metagenómicas, necesitamos ensamblar, andamios y contigs/andamios de contenedor de cada muestra para generar contenedores metagenómicos. Recomendamos usar Megahit para el ensamblaje y MetacArvel para andamios. Proporcionamos una guía de ayuda para trabajar a través de los pasos de ensamblaje, andamios y estimación de cobertura por base aquí.
Siga estos pasos para generar archivos para ejecutar métodos de binning con andamios gráficos:
 python Estimate_Abundances.py -g [ORIENTED.gml] -a [COVERAGE_SORTED.txt] -c [CONTIGS.fa] -d [OUTPUT_DIRECTORY]
usage: Estimate_Abundances.py [-h] [-g ASSEMBLY] [-a COVERAGE] [-bam BAMFILE]
                              [-bed BEDFILE] [-c CONTIGS] -d DIR [-o COORDS]
                              [-w WINDOW_SIZE] [-t THRESHOLD]
                              [-n NEIGHBOR_CUTOFF] [-p POSCUTOFF]
                              [-pre PREFIX]

binnacle: A tool for binning metagenomic datasets using assembly graphs and
scaffolds generated by metacarvel. Estimate_Abundances.py estimates abundance
for scaffolds generated by MetaCarvel. If the coordinates computed by binnacle
is specified then the abundance for each scaffold is estimated based on the
contig abundances and the coordinates. If the coordinates are not specified
then binnacle etimates the abundance from scratch. While calculating all vs
all abundances please specify the coordinates(Coordinates_After_Delinking.txt)
through the "coords" parameter. The abundances can be provided as a bed file,
bam file or a text file describing the per base coverage obtained by running
the genomeCoverageBed program of the bedtools suite.

optional arguments:
  -h, --help            show this help message and exit
  -g ASSEMBLY, --assembly ASSEMBLY
                        Assembly Graph generated by Metacarvel
  -a COVERAGE, --coverage COVERAGE
                        Output generated by running genomecov -d on the bed
                        file generated by MetaCarvel.
  -bam BAMFILE, --bamfile BAMFILE
                        Bam file from aligning reads to contigs
  -bed BEDFILE, --bedfile BEDFILE
                        Bed file from aligning reads to contigs. If bed file
                        is provided please provide a fasta file of the contigs
  -c CONTIGS, --contigs CONTIGS
                        Contigs generated by the assembler, contigs.fasta
  -d DIR, --dir DIR     output directory for results
  -o COORDS, --coords COORDS
                        Coordinate file generated by Binnacle
  -w WINDOW_SIZE, --window_size WINDOW_SIZE
                        Size of the sliding window for computing test
                        statistic to identify changepoints in coverages
                        (Default=1500)
  -t THRESHOLD, --threshold THRESHOLD
                        Threshold to identify outliers (Default=99)
  -n NEIGHBOR_CUTOFF, --neighbor_cutoff NEIGHBOR_CUTOFF
                        Filter size to identify outliers within (Defualt=100)
  -p POSCUTOFF, --poscutoff POSCUTOFF
                        Position cutoff to consider delinking (Default=100)
  -pre PREFIX, --prefix PREFIX
                        Prefix to be attached to all outputs
 -g Path to oriented.gml from running metacarvel on sample
-c Path to contigs obtained by assembling reads of sample
-a Coverage of contigs in ths sample by mapping to its reads -- See Wiki for how to calculate coverage information
-d Output directory
 -a Coverage of contigs in Sample 1 by mapping reads of Sample 2 -- See Wiki for how to calculate coverage information
-o Coordinates of scaffolds from Sample 1 that you would have generated from the previous step.
-d Same output directory as Sample 1
 python Collate.py -h
usage: Collate.py [-h] -d DIR [-m METHOD] [-k KEEP]

binnacle: A tool for binning metagenomic datasets using assembly graphs and
scaffolds generated by metacarvel.Estimate_Abundances.py estimates abundance
for scaffolds generated by MetaCarvel. The program Collate.py collects the
summary files generated by Estimate_Abundances.py

optional arguments:
  -h, --help            show this help message and exit
  -d DIR, --dir DIR     Output directory that contains the summary files
                        generated by running Estimate_Abundances.py
  -m METHOD, --method METHOD
                        Binning method to format the output to. Presently we
                        support 1. Metabat 2. Maxbin 3. Concoct 4. Binnacle
                        (Default)
  -k KEEP, --keep KEEP  Retain the summary files generated by
                        Estimate_Abundances.py. Defaults to True
Consulte el wiki para obtener una descripción detallada sobre la configuración del entorno de Python, los métodos para calcular la cobertura y un flujo de trabajo típico para ejecutar binnacle.
Para visualizar los andamios gráficos, recomendamos usar metagenomescope, que es un navegador basado en la web. La entrada al metagenomescopio es ensamblaje_graph_filtered.gml. Aquí se proporciona documentación detallada sobre la instalación y la ejecución del metagenomescopio.
Cite Muralidharan HS, Shah N, Meisel JS y Pop M (2021) Binnacle: usando andamios para mejorar la contigüidad y la calidad de los contenedores metagenómicos. Frente. Microbiol. 12: 638561. doi: 10.3389/fmicb.2021.638561.
Esta herramienta todavía está en desarrollo. Abra el problema aquí en GitHub o contáctenos si tiene alguna pregunta.
Harihara Muralidharan: [email protected]
Nidhi Shah: [email protected]


