Penting
Terima kasih atas minat Anda pada proyek ini. Namun, Perlu diketahui bahwa repositori ini tidak lagi dipertahankan .
Untuk kebutuhan kritis apa pun, harap pertimbangkan untuk membayar repositori dan membuat pembaruan Anda sendiri.
Peringatan
Saya memiliki kekhawatiran besar tentang validitas dan integritas data yang diakses paket ini. Saya mendesak pengguna untuk sangat berhati -hati dan skeptis ketika menggunakan alat ini, dan untuk mencari sumber alternatif untuk pekerjaan mereka.
Ini adalah resmi [Catatan: Saya tidak lagi berafiliasi dengan World Inequality Lab dan tidak dapat menawarkan jaminan bahwa perintah tersebut akan tetap fungsional di masa depan] perintah stata basis data ketimpangan dunia (wid.world). Ini memungkinkan pengguna mengunduh data langsung dari wid.world ke stata.
Pengguna harus menginstal perintah langsung dari SSC:
ssc install widDokumentasi perintah tersedia setelah instalasi menggunakan:
help widPlot jangka panjang evolusi kekayaan ketimpangan di Prancis:
wid, indicators(shweal) areas(FR) perc(p90p100 p99p100) ages(992) pop(j) clear

// Reshape and plot
reshape wide value, i(year) j(percentile) string
label variable valuep90p100 " Top 10% share "
label variable valuep99p100 " Top 1% share "

graph twoway line value * year, title( " Wealth inequality in France " ) ///
	ylabel(0.2 " 20% " 0.4 " 40% " 0.6 " 60% " 0.8 " 80% " ) ///
	subtitle( " equal-split adults " ) ///
	note( " Source: WID.world " )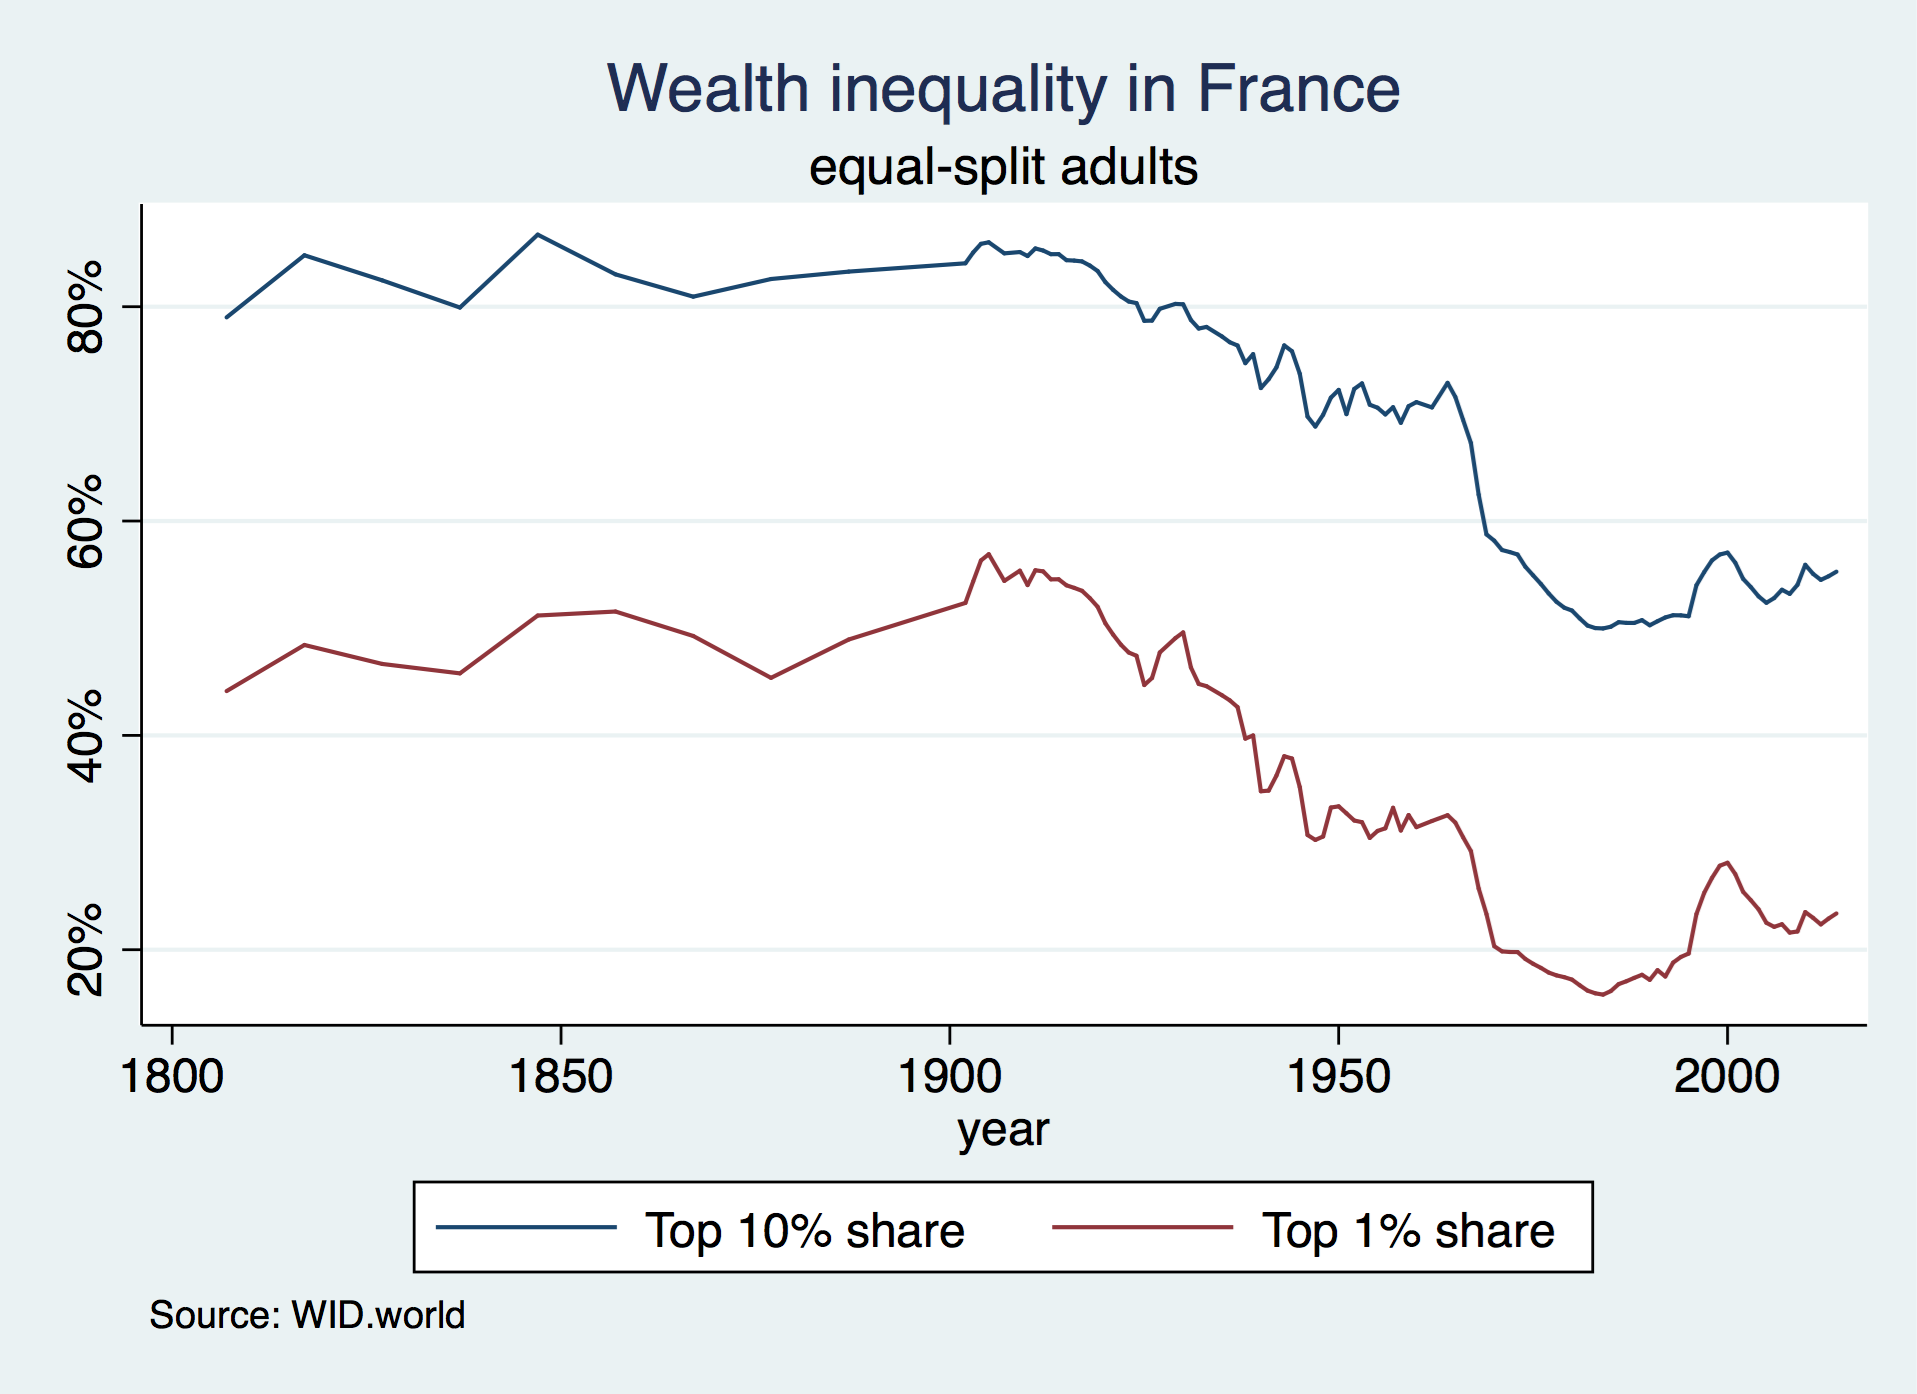
Plot evolusi pendapatan nasional sebelum pajak dari 50% populasi terbawah di Cina, Prancis dan Amerika Serikat sejak 1978 (dalam skala log):
 // Download and store the 2017 USD PPP exchange rate
wid, indicators(xlcusp) areas(FR US CN) year(2017) clear
rename value ppp
tempfile ppp
save " `ppp' "

wid, indicators(aptinc) areas(FR US CN) perc(p0p50) year(1978 / 2017) ages(992) pop(j) clear
merge n:1 country using " `ppp' " , nogenerate

// Convert to 2017 USD PPP (thousands)
replace value = value/ppp/1000

// Reshape and plot
keep country year value
reshape wide value, i(year) j(country) string
label variable valueFR " France "
label variable valueUS " United States "
label variable valueCN " China "

graph twoway line value * year, yscale(log) ylabel(1 2 5 10 20) ///
	ytitle( " 2017 PPP USD (000's) " ) ///
	title( " Average pre-tax national income of the bottom 50% " ) subtitle( " equal-split adults " ) ///
	note( " Source: WID.world " ) legend(rows(1))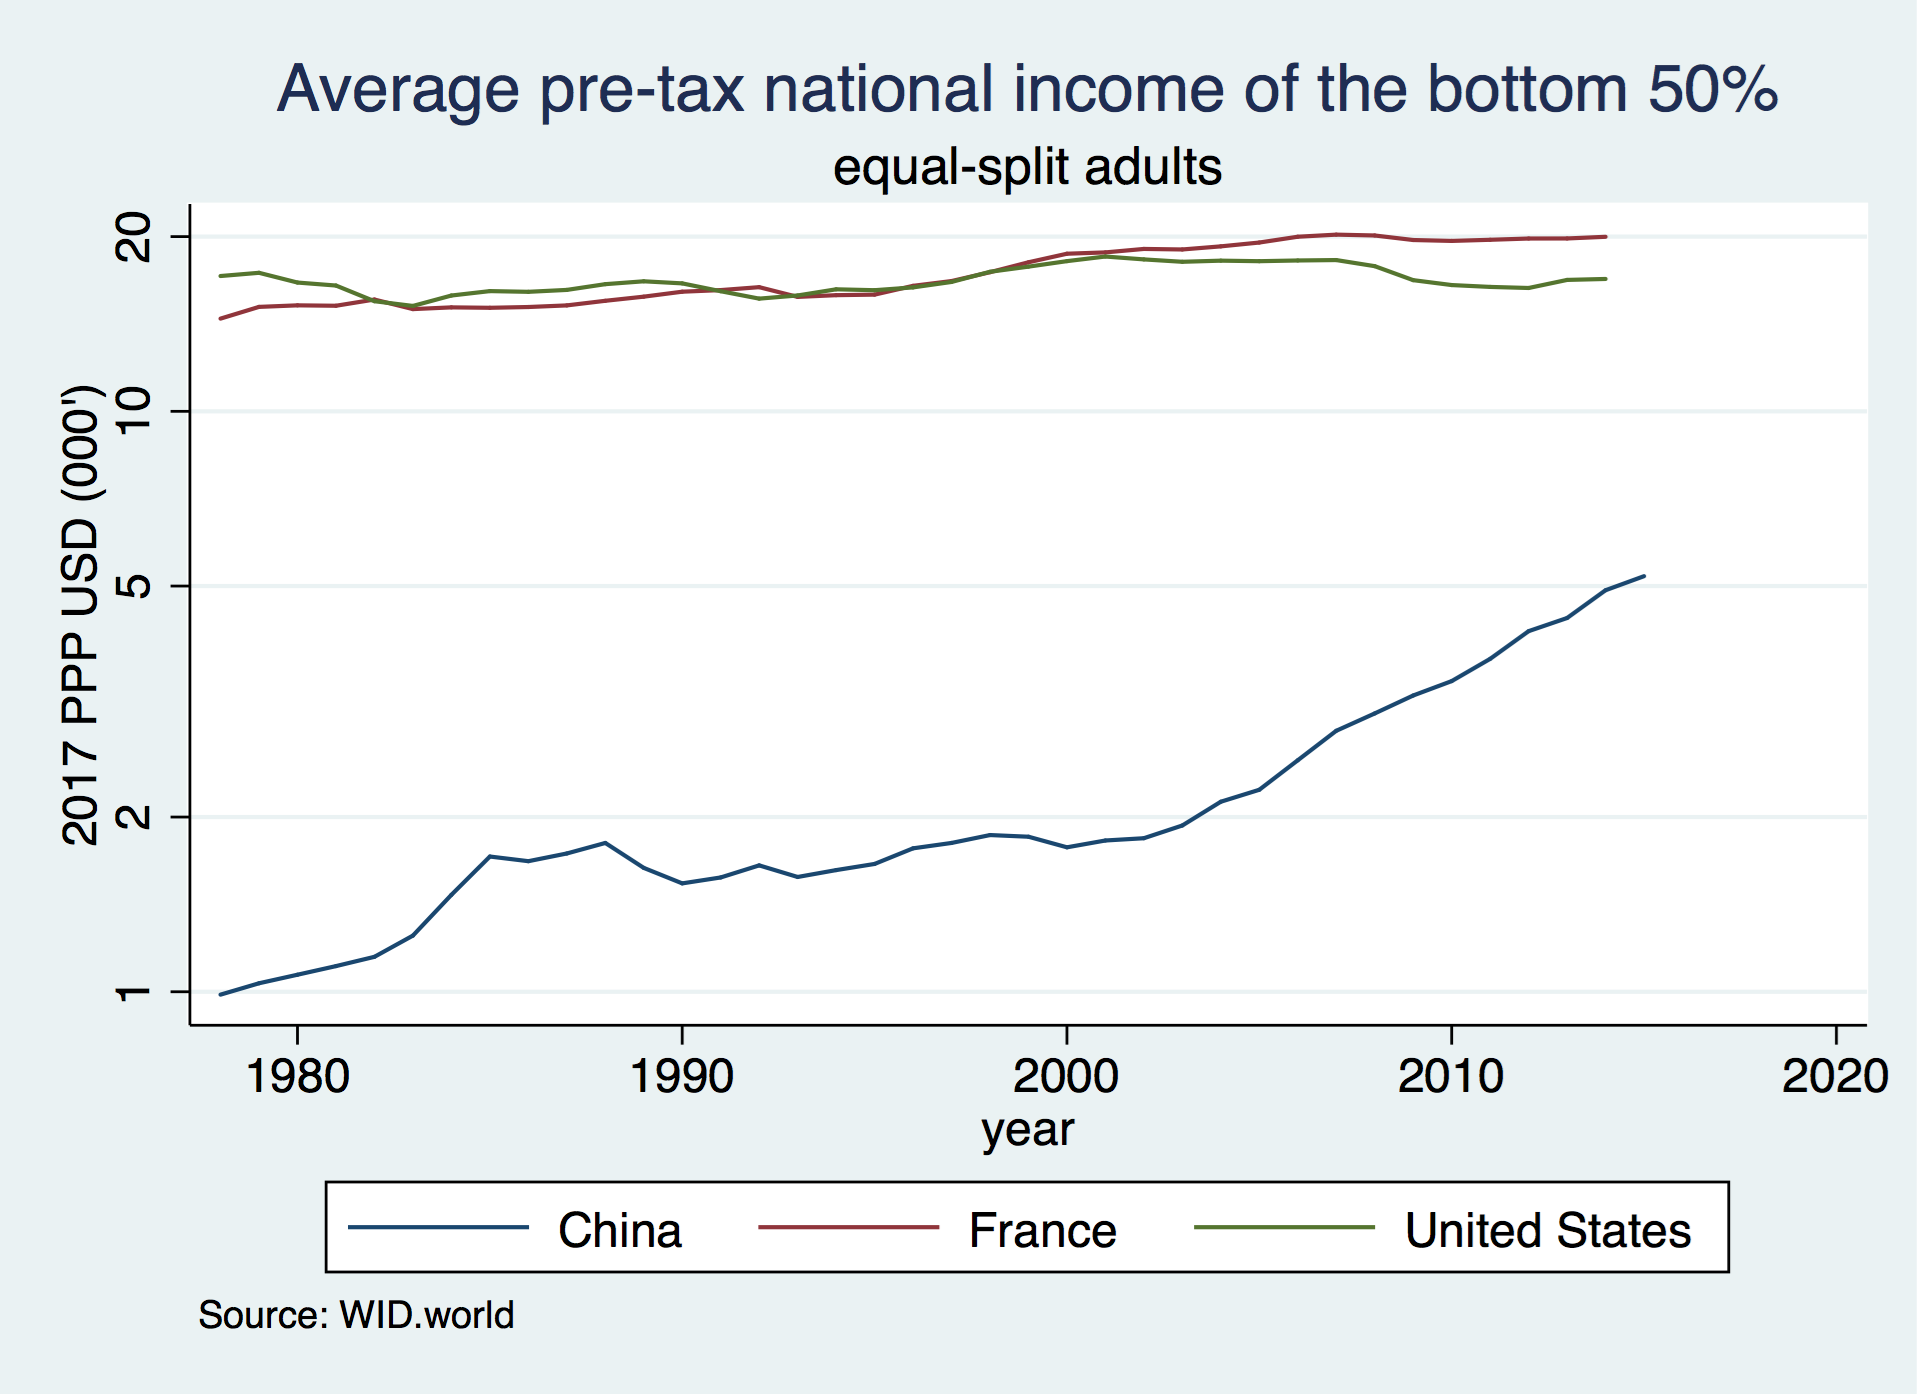
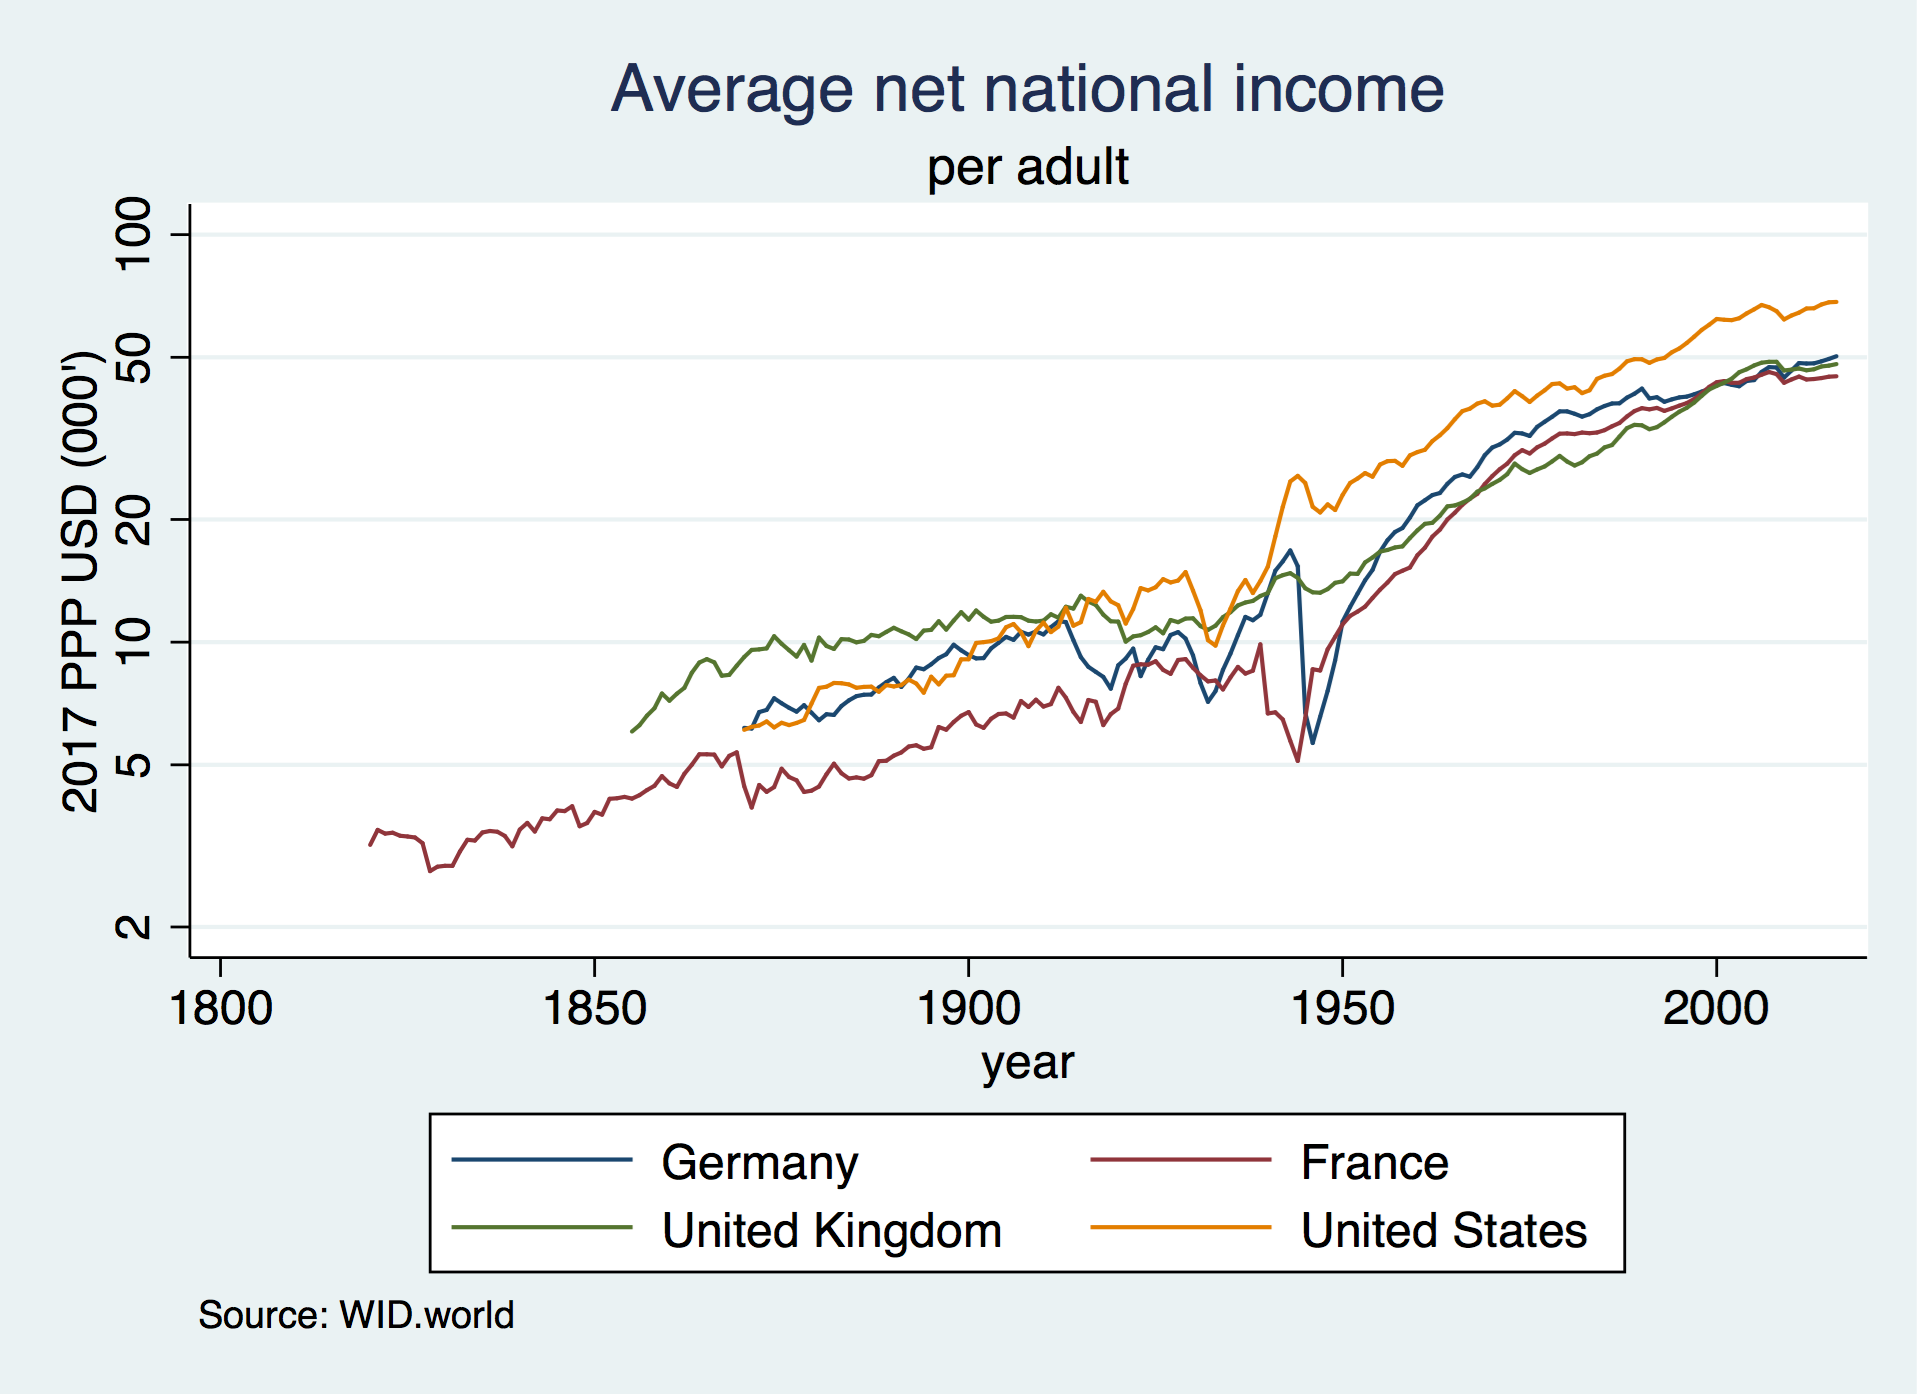
Plot evolusi jangka panjang dari pendapatan nasional rata-rata per orang dewasa di Prancis, Jerman, Inggris dan Amerika Serikat (dalam skala log):
 // Download and store the 2017 USD PPP exchange rate
wid, indicators(xlcusp) areas(FR US DE GB) year(2017) clear
rename value ppp
tempfile ppp
save " `ppp' "

// Download net national income in constant 2017 local currency
wid, indicators(anninc) areas(FR US DE GB) age(992) clear
merge n:1 country using " `ppp' " , nogenerate

// Convert to 2017 USD PPP (thousands)
replace value = value/ppp/1000

// Reshape and plot
keep country year value
reshape wide value, i(year) j(country) string
label variable valueFR " France "
label variable valueUS " United States "
label variable valueDE " Germany "
label variable valueGB " United Kingdom "

graph twoway line value * year, yscale(log) ///
	ytitle( " 2017 PPP USD (000's) " ) ylabel(2 5 10 20 50 100) ///
	title( " Average net national income " ) subtitle( " per adult " ) ///
	note( " Source: WID.world " )