smard power forecasting
1.0.0
このリポジトリは、ドイツの電力消費量を予測するためのものです。
以下に基づいており、以下からインスピレーションを得ています。
データソース: SMARD
ダウンロードしたすべてのファイルを次の場所に置きます。
/example/dataset # there is already used dataset included if you pull, but you could update
Forecast.Rmd ファイルをチェックして、SMARD-Data の更新バージョンでこのコードを実行する方法を確認してください。
使用したライブラリ:
 # Probably needed
# Load Packages
# library(fhswf)
# library(tsibbledata)
# library(broom)
# library(readr)
# library(datasets)
# library(timeDate)
# library(qlcal)
# library(corrplot)
# library(mgcv)
# library(MEFM)
# library(TTR)

packages <- c(
  "devtools",
  "ggplot2",
  "dplyr",
  "tsibble",
  "fable",
  "fabletools",
  "feasts",
  "distributional",
  "lubridate",
  "tidyr",
  "forecast",
  "zoo",
  "scales",
  "fable.prophet"
)
install.packages(packages)


library(devtools)
library(ggplot2)
library(dplyr)
library(tsibble)
library(fable)
library(fabletools)
library(feasts)
library(distributional)
library(lubridate)
library(tidyr)
library(forecast)
library(zoo)
library(scales)
library(fable.prophet)
最初は example/ フォルダーで作業してみてください。
 # Define datapaths
power_consum_path <- "dataset\stunde_2015_2024\Realisierter_Stromverbrauch_201501010000_202407090000_Stunde.csv"
power_consum_smard_prediction_path <- "dataset\propgnose_vom_smard\Prognostizierter_Stromverbrauch_202401010000_202407090000_Stunde.csv"

# Load Smard Prediction
power_consum_smard_prediction_loaded <- load_power_consum(path=power_consum_smard_prediction_path)
raw_smard_pred <- power_consum_smard_prediction_loaded$raw_data
cleaned_smard_pred <- power_consum_smard_prediction_loaded$cleaned_data

cleaned_smard_pred <- cleaned_smard_pred |>
  mutate(.model = "SMARD")
names(cleaned_smard_pred)[names(cleaned_smard_pred) == "PowerConsum"] <- ".mean"

# Load PowerConsum Data
power_consum_loaded <- load_power_consum(path=power_consum_path)
raw_power_consum <- power_consum_loaded$raw_data
cleaned_power_consum <- power_consum_loaded$cleaned_data

# Generate more features
cleaned_power_consum$localName[is.na(cleaned_power_consum$localName)] = "Working-Day"
cleaned_power_consum$MeanLastWeek <- rollapply(cleaned_power_consum$PowerConsum, width = 24*8, FUN = function(x) mean(x[1:(24*8-25)]), align = "right", fill = NA)
cleaned_power_consum$MeanLastTwoDays <- rollapply(cleaned_power_consum$PowerConsum, width = 24*3, FUN = function(x) mean(x[1:(24*3-25)]), align = "right", fill = NA)
cleaned_power_consum$MaxLastOneDay <- rollapply(cleaned_power_consum$PowerConsum, width = 24*2, FUN = function(x) max(x[1:(24*2-25)]), align = "right", fill = NA)
cleaned_power_consum$MinLastOneDay <- rollapply(cleaned_power_consum$PowerConsum, width = 24*2, FUN = function(x) min(x[1:(24*2-25)]), align = "right", fill = NA)
次の機能がデータセットと Holiday API から生成されました。
| 索引 | 列名 | 説明 |
|---|---|---|
| 1 | 日付から | DateIndex の検証用 (同様ですが未加工) |
| 2 | 電力消費 | 消費電力 (MW) |
| 3 | 日付インデックス | タイムスタンプ (yyyy-mm-dd hh:mm:ss) |
| 4 | 平日 | Mo、Di、Mi、Do、Fr、Sa、So (ドイツ語の平日) |
| 5 | 日付 | 日付 (yyyy-mm-dd) |
| 6 | 年 | yyyy年 |
| 7 | 週 | 週番号 0 ~ 53 |
| 8 | 時間 | 時間番号 0 ~ 24 |
| 9 | 月 | 月番号 1 ~ 12 |
| 10 | ローカル名 | タイムスタンプの休日名 |
| 11 | 仕事の日 | 1/0 勤務日 (Werktag) の場合は 1 |
| 12 | モー | 1/0 月曜日の場合は 1 |
| 13 | ディ | 1/0 火曜日の場合は 1 |
| 14 | ミ | 1/0 水曜日の場合は 1 |
| 15 | する | 1/0 木曜日の場合は 1 |
| 16 | 神父 | 1/0 金曜日の場合は 1 |
| 17 | サ | 1/0 土曜日の場合は 1 |
| 18 | それで | 1/0 日曜日の場合は 1 (月曜から土曜を使用する場合は不要) |
| 19 | 休日 | 1/0 休日の場合は 1 |
| 20 | 勤務日休日週末 | 休日、週末、または平日の場合 (プロットの場合は Char です)。 |
| 21 | 休日と仕事の日 | 1/0 休日が平日の場合は 1 |
| 22 | 昨日は仕事の日ではありませんでした | 1/0 最後の日が就業日ではなかった場合は 1 |
| 23 | 昨日は仕事の日ではなかった、そして今は仕事の日 | 1/0 前日が就業日ではなく、現在が就業日である場合は 1 |
| 24 | 次の日は仕事の日ではないそして今は仕事の日 | 1/0 次の日が勤務日ではなく、現在は勤務日である場合は 1 |
| 25 | 最終日は週末ではなく休日でした | 1/0 最後の日が週末ではなく休日だった場合は 1 |
| 26 | 次の日は休日であり週末ではありません | 1/0 次の日が週末ではなく休日の場合は 1 |
| 27 | 祝日名 | localName (祝日の名前) に似ています |
| 28 | 年末 | 1/0 年末の場合 (第 52 週または第 53 週) |
| 29 | 今年の最初の週 | 1/0 年始の場合(第1週) |
| 30 | 休日延長 | 1/0 時差休日(翌日まで6時間) |
| 31 | 休日平滑化 | HolidayExtend + sin(2*pi(時間)+1)/24) |
| 32 | 先週の平均 | 先週の平均消費電力 (シフト: 24*8-25) |
| 33 | 平均最後の 2 日間 | 過去 2 日間の平均 PowerConsum (シフト: 24*3-25) |
| 34 | MaxLastOneDay | 最終日の最大消費電力 (シフト: 24*2-25) |
| 35 | 最小最終一日 | 最終日の最小消費電力 (シフト: 24*2-25) |
この研究には、SMARD からの 2015 年から 2024 年のドイツの電力消費量のデータセットがあります。
図 1 は、欠損値 (赤色)、重複したタイムスタンプ (濃い赤色)、および時間経過に伴う電力消費量 (灰色) を時間単位の解像度で示した生のデータセットを示しています。毎年 1 つの欠損値と 1 つの重複値があるため、データセットをクリーンアップするのは簡単でした。全体的にはほぼクリーンなセット。データセットをクリーンアップすると、電力消費に関する妥当な観察結果が得られます。
最後の観測値を取得することでギャップを埋める簡単なアプローチがあります (解像度が十分に大きく、欠損値がほとんどないため可能です)。最初の値は重複のために保持されました。
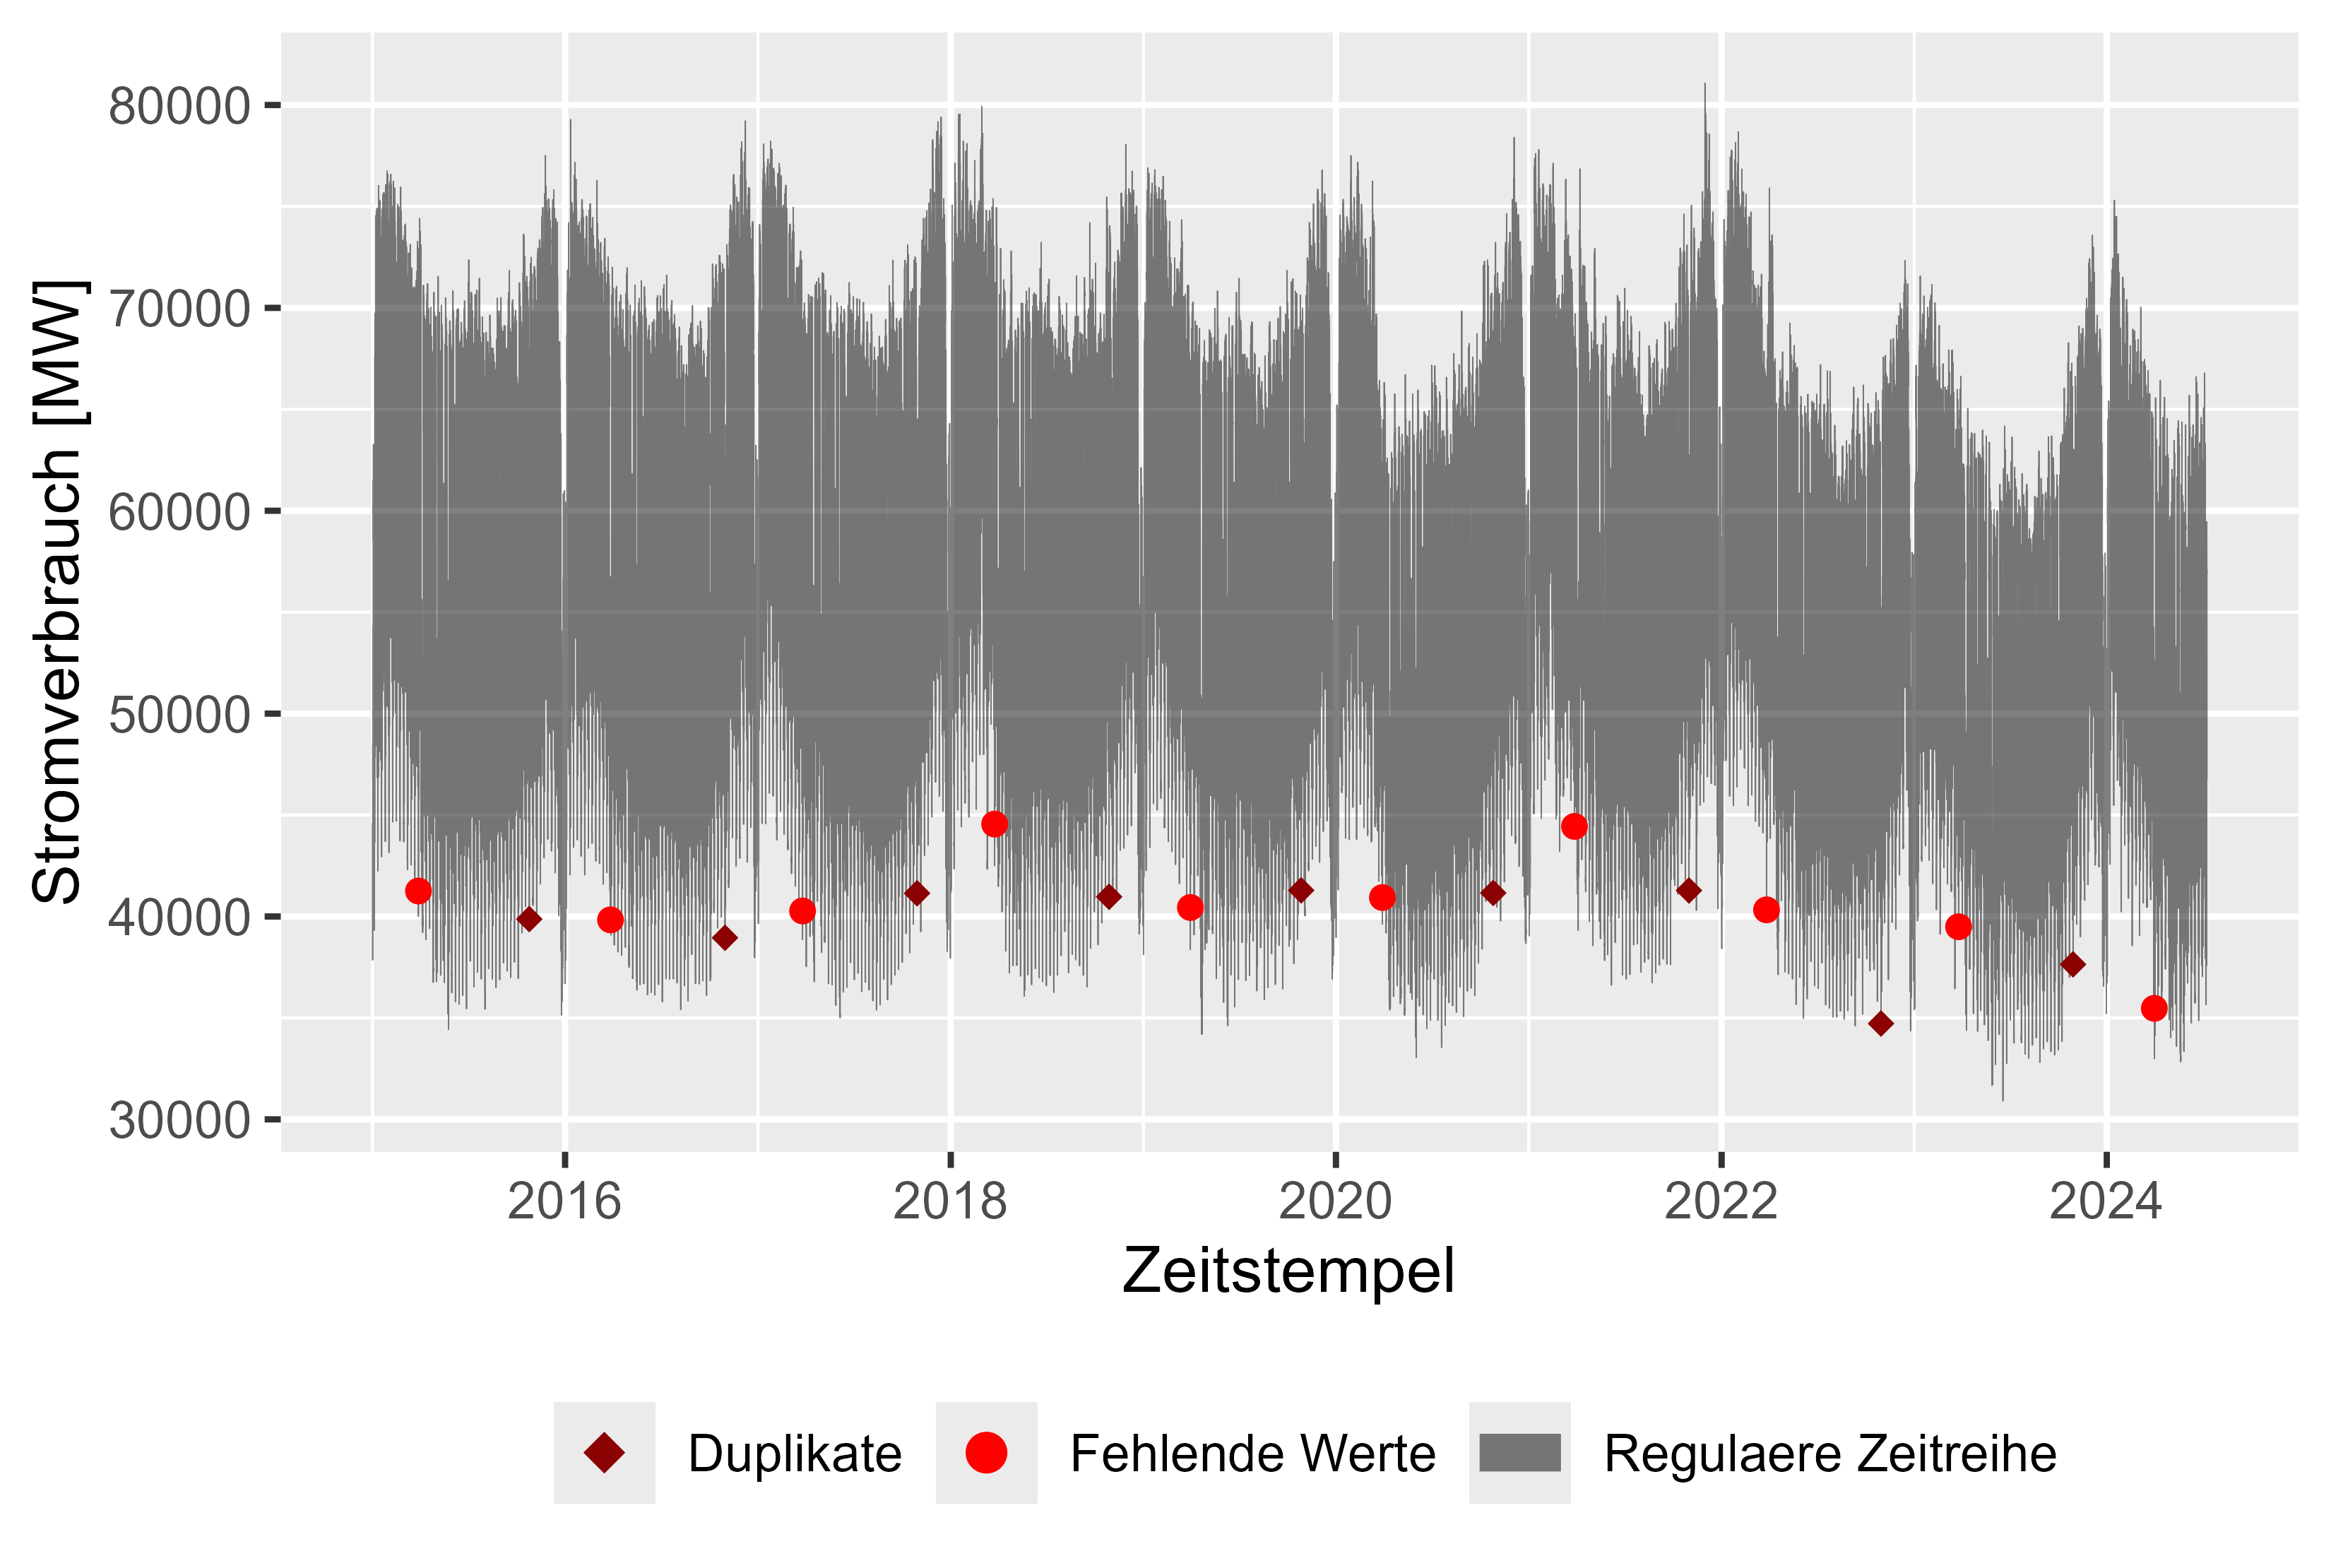 図 1 生の電力消費量
 local_name_colors <- c(
  "Christi Himmelfahrt" = palette()[2],
  "Erster Weihnachtstag" = palette()[2],
  "Karfreitag" = palette()[2],
  "Neujahr" = palette()[2],
  "Ostermontag" = palette()[2],
  "Pfingstmontag" = palette()[2],
  "Reformationstag" = palette()[2],
  "Tag der Arbeit" = palette()[2],
  "Tag der Deutschen Einheit" = palette()[2],
  "Zweiter Weihnachtstag" = palette()[2],
  "Regulärer Tag" = palette()[1]
)


week_colors <- c(
  "Mo" = palette()[1],
  "Di" = palette()[1],
  "Mi" = palette()[1],
  "Do" = palette()[1],
  "Fr" = palette()[1],
  "Sa" = palette()[2],
  "So" = palette()[2]
)

working_colors <- c("1" = "#2E9FDF", "0" = "#FC4E07")

whw_colors <- c(
  "FeiertagnKein Wochenende" = "black",
  "Kein FeiertagnKein Wochenende" = "red",
  "Kein FeiertagnWochenende" = "orange",
  "FeiertagnWochenende" = "blue"
)

p <- cleaned_power_consum |>
    gg_tsdisplay(PowerConsum, plot_type = "partial", lag = 100)

ggsave(
  "plots/power_consum_acf_pacf.png",
  plot = p,
  width = 5.5,
  height = 3.7,
  dpi = 600
)

plot_calculated_features(
  cleaned_power_consum = cleaned_power_consum,
  file_name = "plots/MinLastOneDay.png",
  x = "MinLastOneDay",
  y = "PowerConsum",
  x_label = "Minimaler Stromverbrauch vom letzten Tag [MW]",
  y_label = "Stromverbrauch [MW]"
)

plot_calculated_features(
  cleaned_power_consum = cleaned_power_consum,
  file_name = "plots/MaxLastOneDay.png",
  x = "MaxLastOneDay",
  y = "PowerConsum",
  x_label = "Maximaler Stromverbrauch vom letzten Tag [MW]",
  y_label = "Stromverbrauch [MW]"
)

plot_calculated_features(
  cleaned_power_consum = cleaned_power_consum,
  file_name = "plots/MeanLastWeek.png",
  x = "MeanLastWeek",
  y = "PowerConsum",
  x_label = "Durchschnittlicher Stromverbrauch der letzten 7 Tage [MW]",
  y_label = "Stromverbrauch [MW]"
)


plot_calculated_features(
  cleaned_power_consum = cleaned_power_consum,
  file_name = "plots/MeanLastTwoDays.png",
  x = "MeanLastTwoDays",
  y = "PowerConsum",
  x_label = "Durchschnittlicher Stromverbrauch der letzten 2 Tage [MW]",
  y_label = "Stromverbrauch [MW]"
)

plot_histogram_by_group(
  cleaned_power_consum,
  group_name = "WorkdayHolidayWeekend",
  file_name = "plots\workday_holiday_weekend_histogram.png",
  colors = whw_colors,
  x="PowerConsum",
  x_label = "Stromverbrauch [MW]",
  y_label = "Häufigkeit",
  name_0 = "Wochenende oder Feiertage",
  name_1 = "Werktag"
)


plot_histogram_by_group(
  cleaned_power_consum,
  group_name = "WorkDay",
  file_name = "plots\workday_histogram.png",
  colors = working_colors,
  x="PowerConsum",
  x_label = "Stromverbrauch [MW]",
  y_label = "Häufigkeit",
  name_0 = "Wochenende oder Feiertage",
  name_1 = "Werktag"
)

plot_histogram_by_group(
  cleaned_power_consum,
  group_name = "Holiday",
  file_name = "plots\holiday_histogram.png",
  colors = working_colors,
  x="PowerConsum",
  x_label = "Stromverbrauch [MW]",
  y_label = "Häufigkeit",
  name_0 = "Werktag oder Wochenende",
  name_1 = "Feiertag"
)

plot_histogram_by_group(
  cleaned_power_consum,
  group_name = "HolidayAndWorkDay",
  file_name = "plots\holiday_workday_histogram.png",
  colors = working_colors,
  x="PowerConsum",
  x_label = "Stromverbrauch [MW]",
  y_label = "Häufigkeit",
  name_0 = "Wochenende oder Werktag",
  name_1 = "Feiertag am Werktag"
)

plot_by_group(
  cleaned_power_consum,
  group_name = "HolidayName",
  file_name = "plots\holiday_boxplot.png",
  colors = local_name_colors,
  title = "Übersicht der einzelnen Feiertage",
  y="PowerConsum",
  y_label="Stromverbrauch [MW]",
  x_label="Jahre"
)

plot_by_group(
  cleaned_power_consum,
  group_name = "Weekday",
  file_name = "plots\weekday_boxplot.png",
  colors = week_colors,
  title = "Übersicht der einzelnen Wochentage",
  y = "PowerConsum",
  y_label="Stromverbrauch [MW]",
  x_label="Jahre"
)

plot_by_group(
  cleaned_power_consum,
  group_name = "WorkDay",
  file_name = "plots\workday_boxplot.png",
  colors = working_colors,
  title = "Übersicht, ob Feiertag (FALSE) oder Werktag (TRUE)",
  y = "PowerConsum",
  y_label="Stromverbrauch [MW]",
  x_label="Jahre"
)


plot_by_column(
  df = cleaned_power_consum,
  x = "Hour",
  y = "PowerConsum",
  x_label = "Stunden",
  y_label = "Stromverbrauch [MW]",
  file_name = "plots\hour_boxplot.png",
  title = "Übersicht der einzelnen Stunden"
)

plot_by_column(
  df = cleaned_power_consum,
  x = "Month",
  y = "PowerConsum",
  x_label = "Monate",
  y_label = "Stromverbrauch [MW]",
  file_name = "plots\month_boxplot.png",
  title = "Übersicht der einzelnen Monate"
)

plot_by_column(
  df = cleaned_power_consum,
  x = "Week",
  y = "PowerConsum",
  x_label = "Woche",
  y_label = "Stromverbrauch [MW]",
  file_name = "plots\week_boxplot.png",
  title = "Übersicht der einzelnen Wochen"
)

plot_by_column(
  df = cleaned_power_consum,
  x = "Year",
  y = "PowerConsum",
  x_label = "Jahr",
  y_label = "Stromverbrauch [MW]",
  file_name = "plots\year_boxplot.png",
  title = "Übersicht der einzelnen Jahre"
)

plot_year_month_week_day(
  df=cleaned_power_consum,
  date_column="DateIndex",
  y="PowerConsum",
  from_year=2015,
  to_year=2024,
  from_week=0,
  to_week=53,
  year_for_week=2018,
  from_day=1,
  to_day=30,
  month_for_day=4,
  year_for_day=2018,
  from_month=1,
  to_month=12,
  year_for_month=2018,
  holiday="Holiday",
  day_of_week = "Weekday"
)
次のセクションでは、データについてさらに詳しく説明します。ここからは年間の表現から始めます。
図 2 は、2015 年から 2024 年の年次を表しています。ここで、年の初めには電力消費量が増加し、年末(クリスマス、新年)には電力消費量が減少していることがわかります。全体的には笑顔か弓のような形をしています。
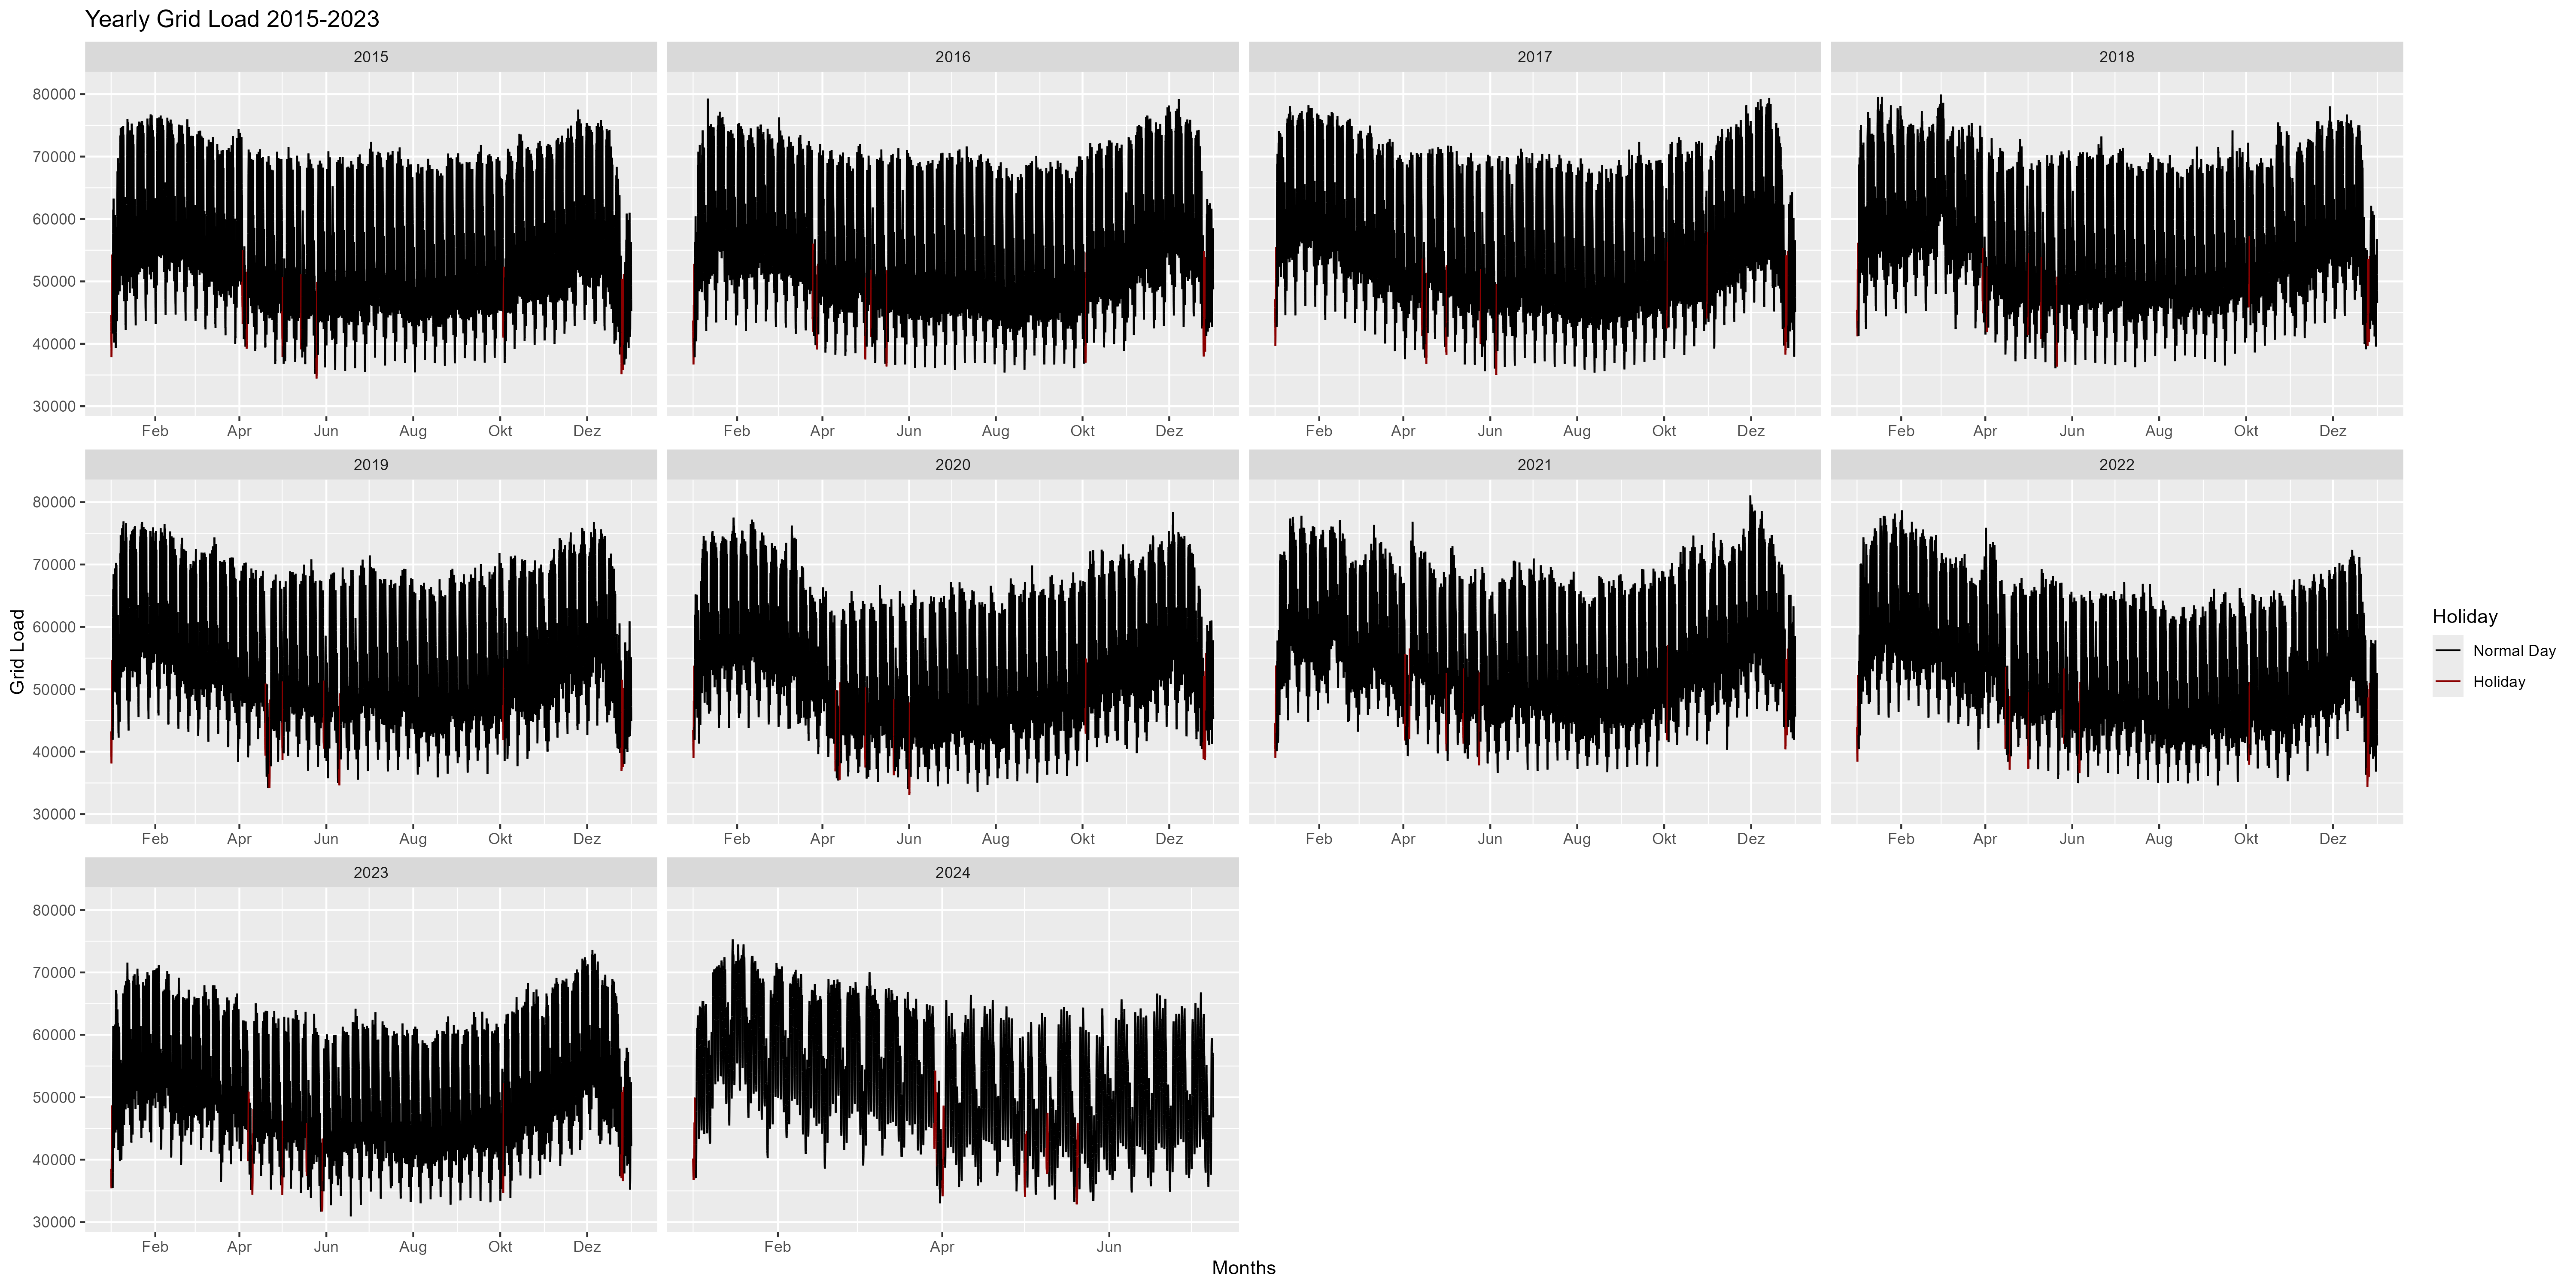 図 2 単一の側面としての毎年の電力消費量
すべての年を集計して週に分割してみましょう。図 3 の箱ひげ図はすべての年を結合したものです。パターンをさらに詳しく見ることができます。年の初めと終わりは赤色で表され、通常の「笑顔の形」からの減少を示します。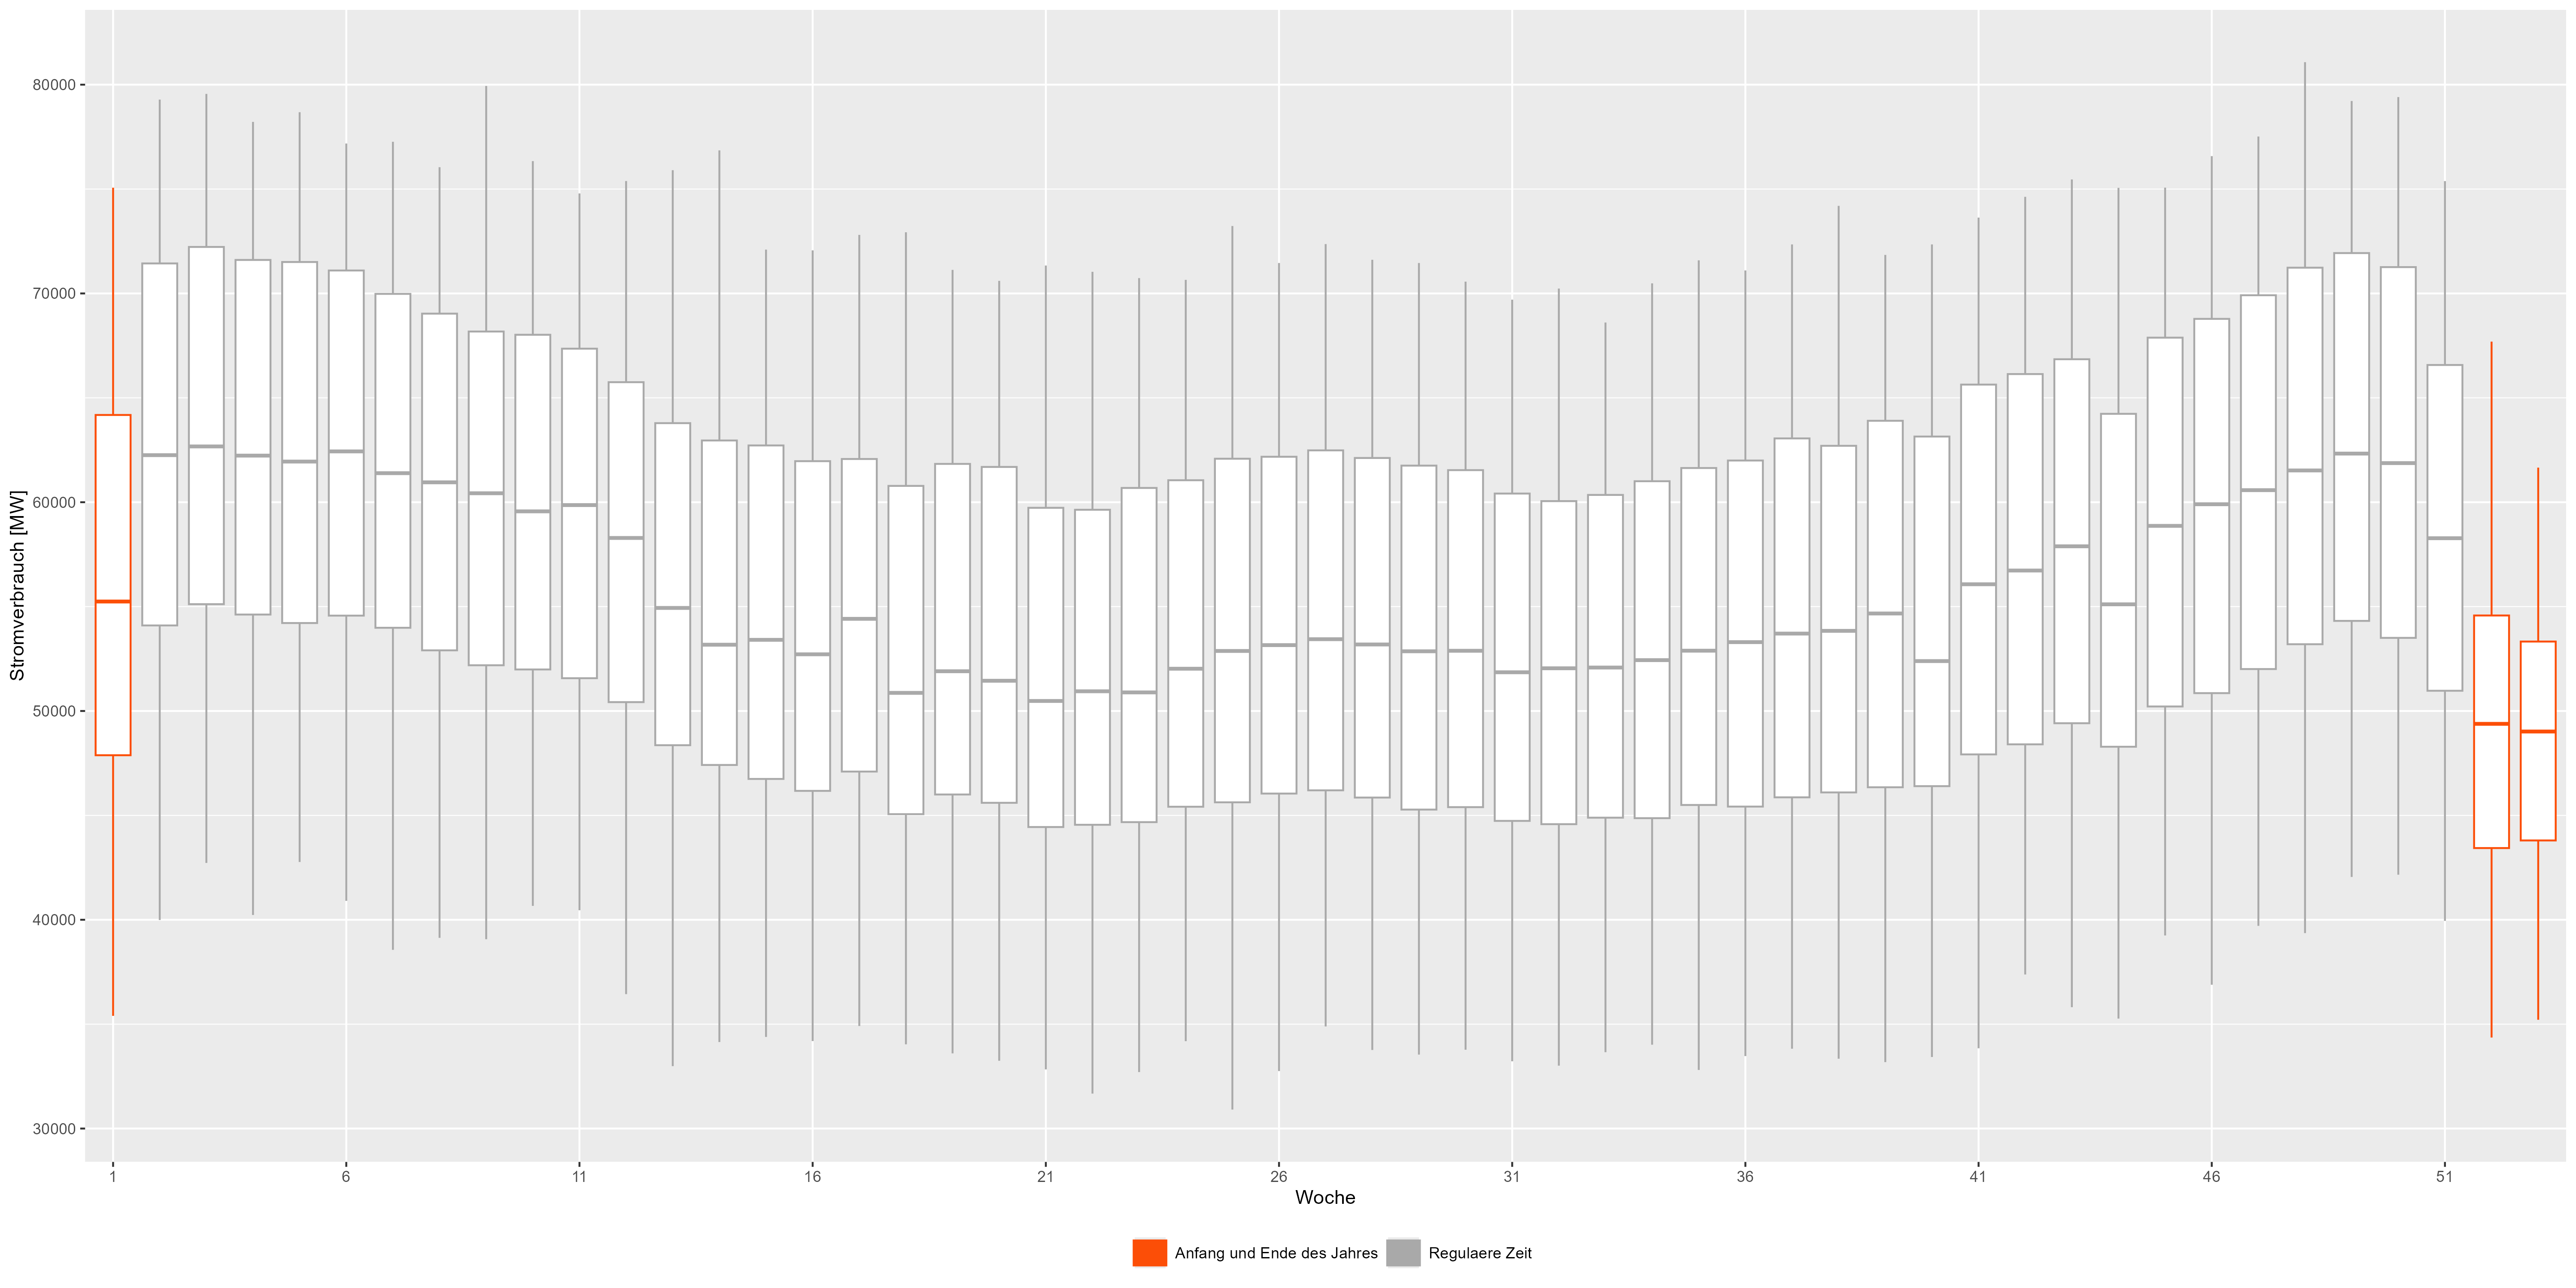 図 3 電力消費量の週ごとの集計データ
さらに詳しく見て、たとえば 2018 年を見てみましょう。図 4 は、2018 年の月次表示です。ここでは、年末をより詳細に観察できます。 12月24日頃から電力消費量が減少します。ここでは週末と祝日 (赤) も注目に値します。すべての週末とすべての休日で減少。
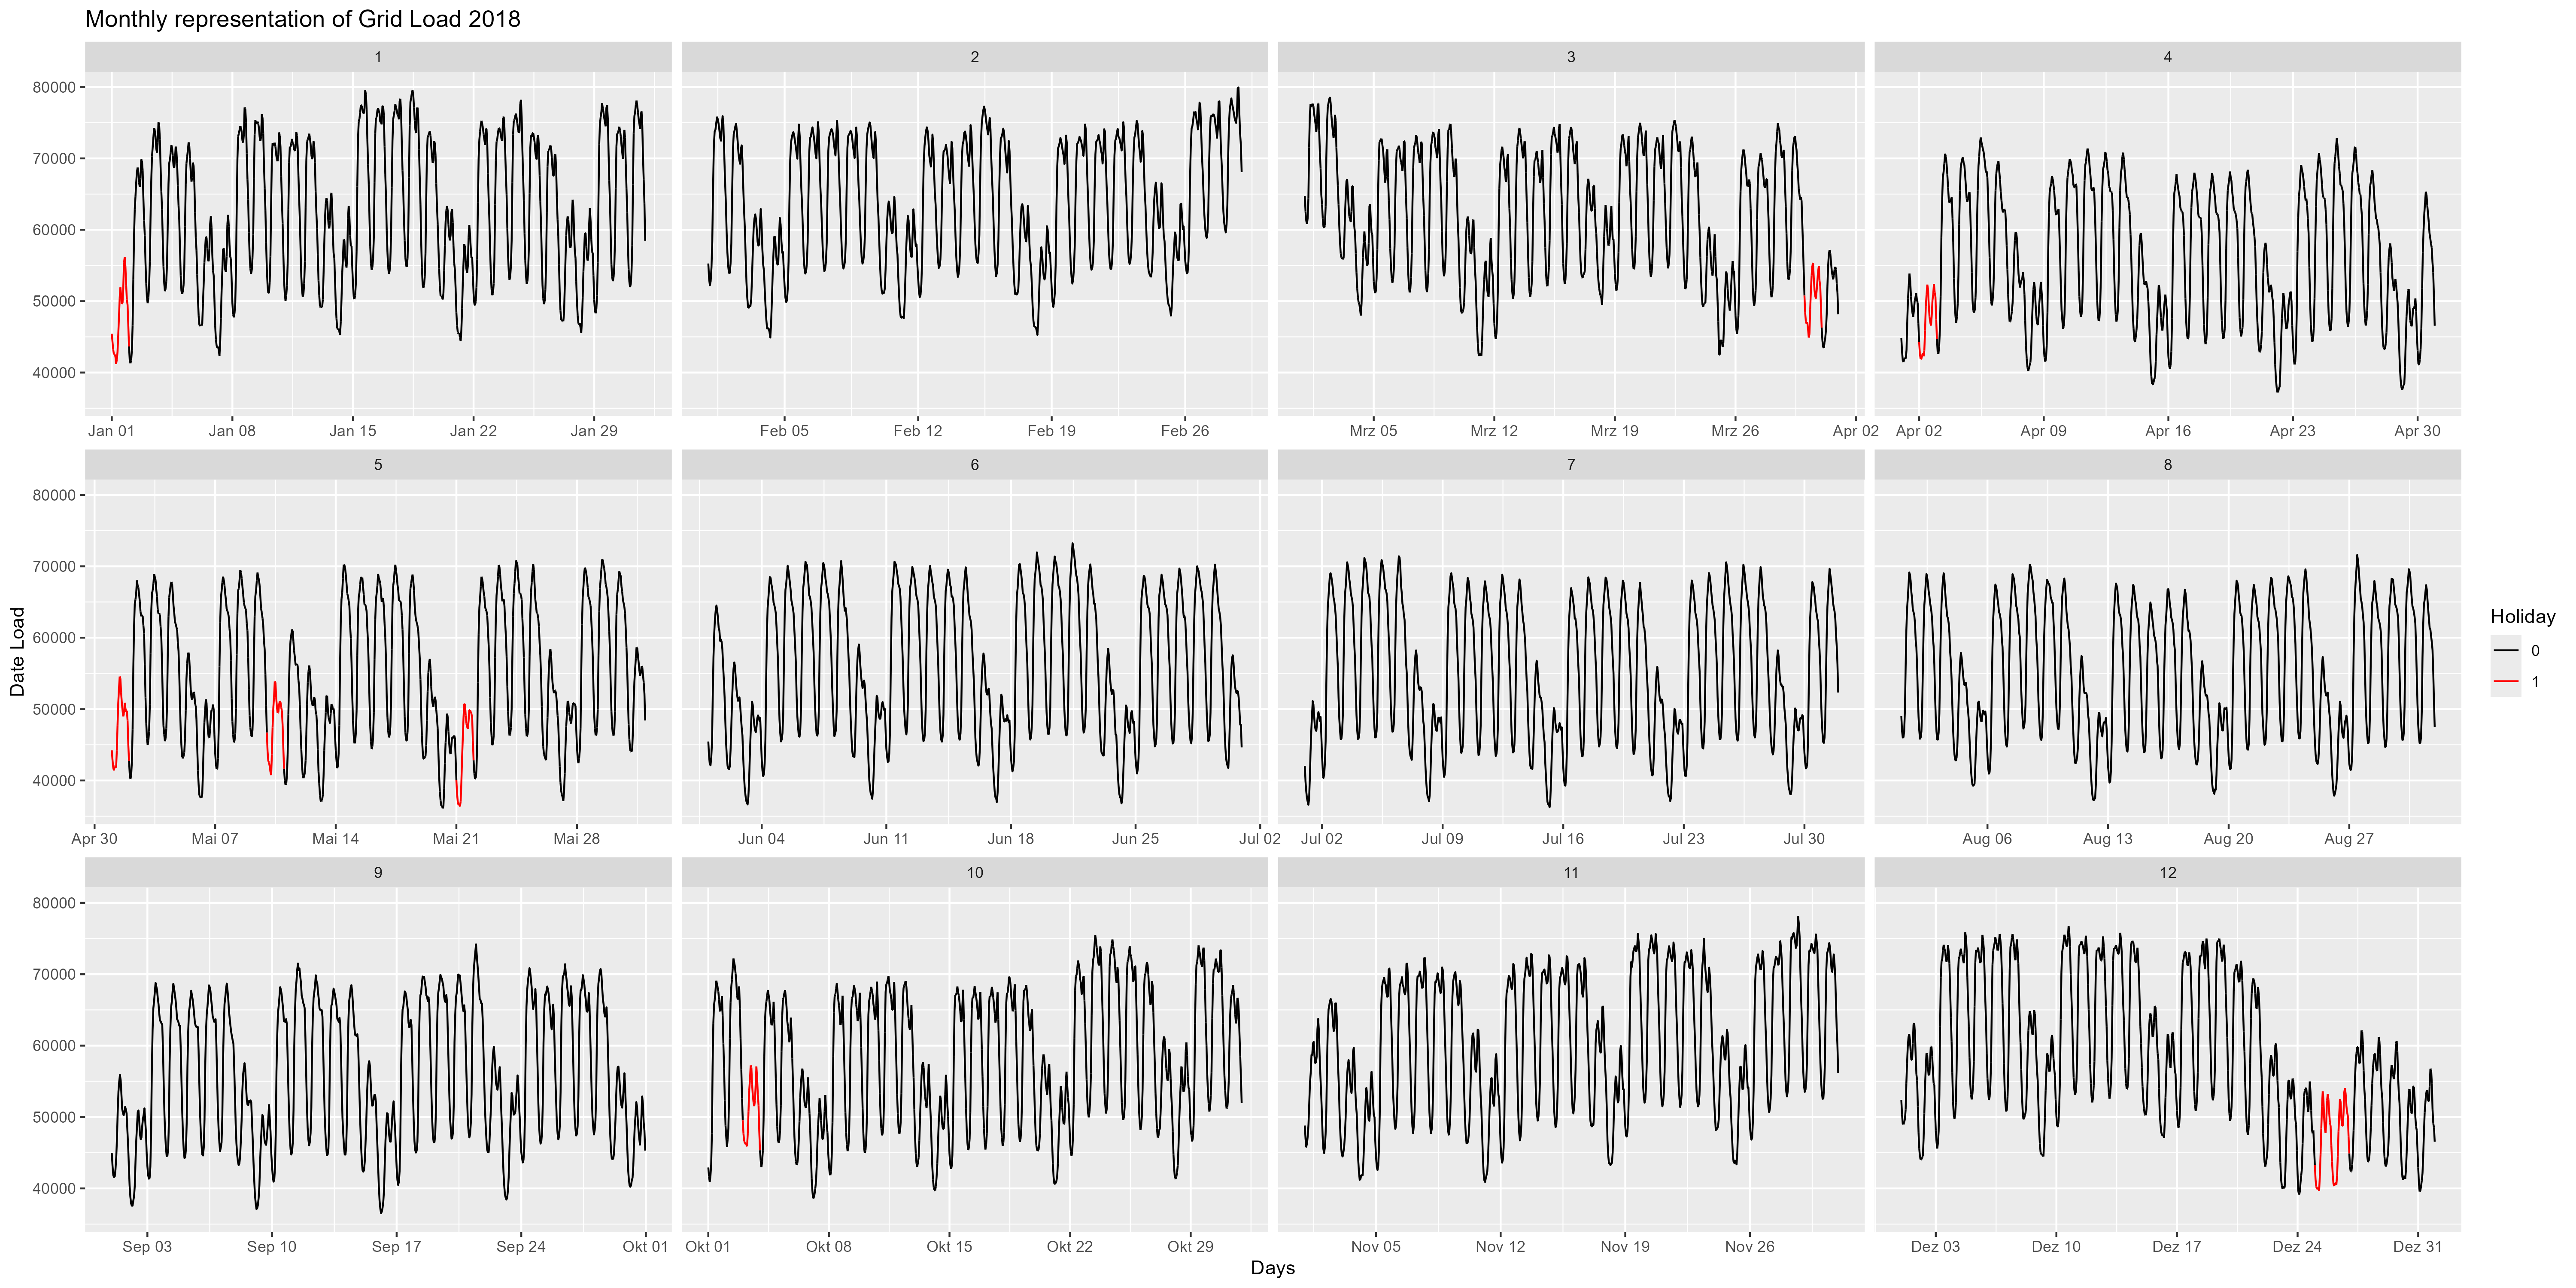 図 4 単一の側面としての毎月の電力消費量
さらに進んで、データの 1 時間ごとの表現を確認することもできます。図 5 は、時間ごとに集計された箱ひげ図を示しています。また、夜間(21:00~06:00)が減少し、昼間/勤務時間(06:00~21:00)が増加しています。これもモデルに含める必要があるパターンです。
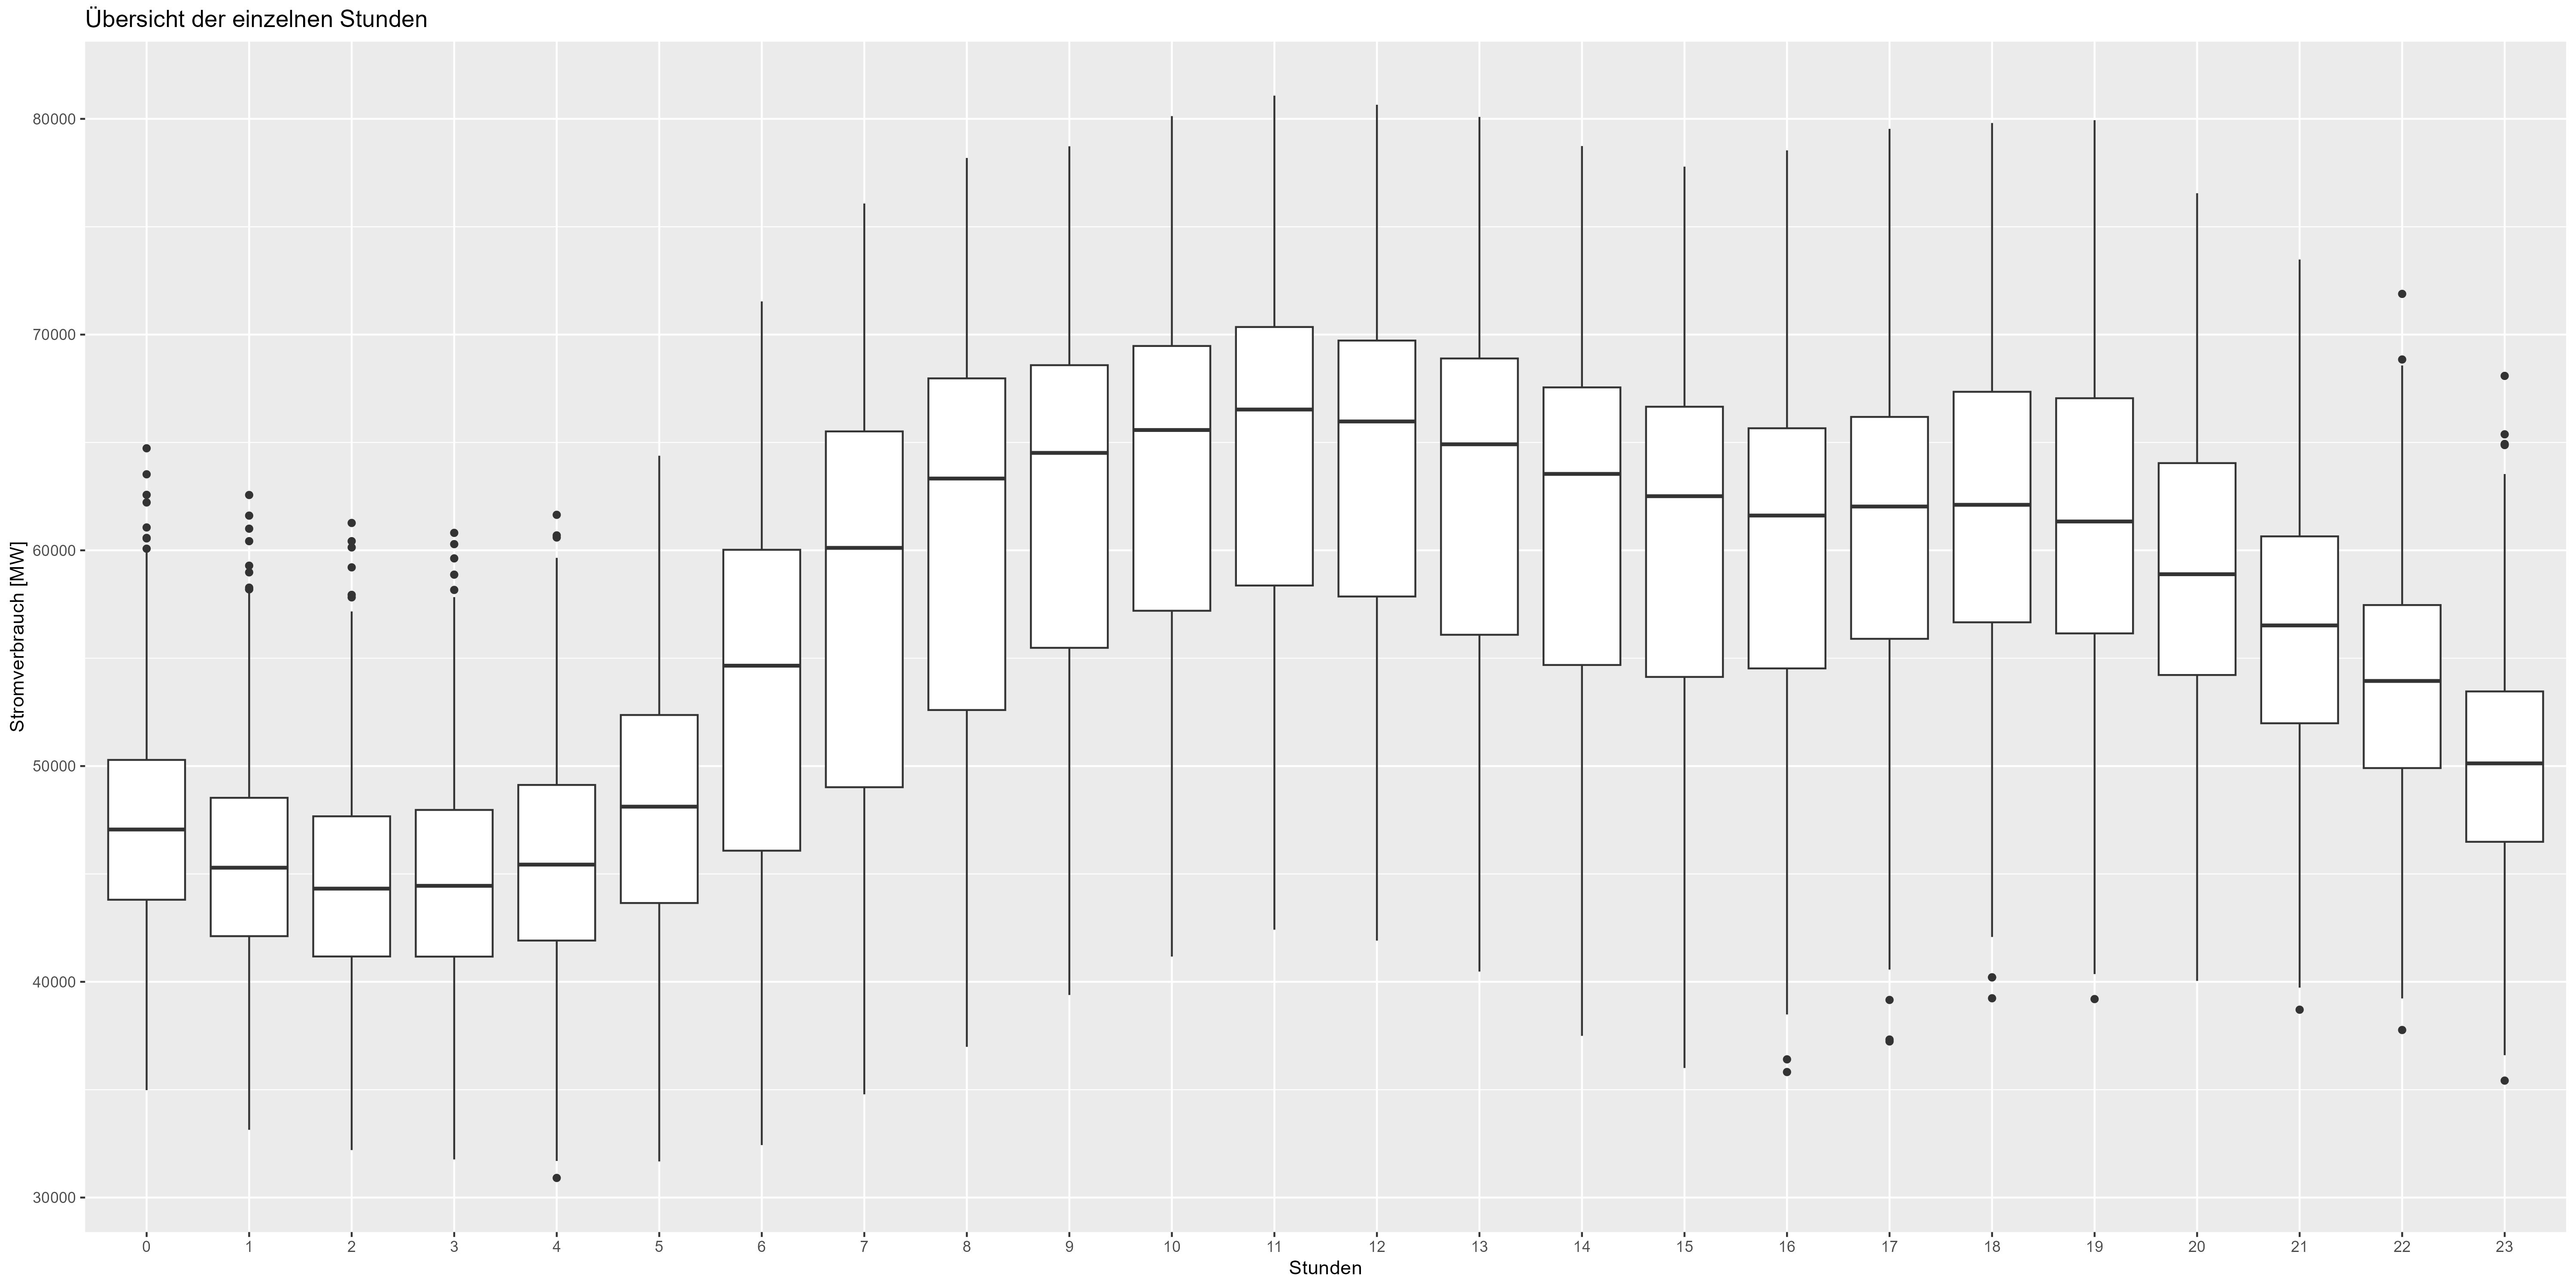 図 5 電力消費時間ごとの集計データ
平日の話をしましょう。週末の想定どおり電力消費量が減少します。 「ドゥルヒシュニット」は平均です。図 6 は、長年にわたるすべての平日 (集計) を示しています。週末には最大 10,000 MW の減少が見られます。
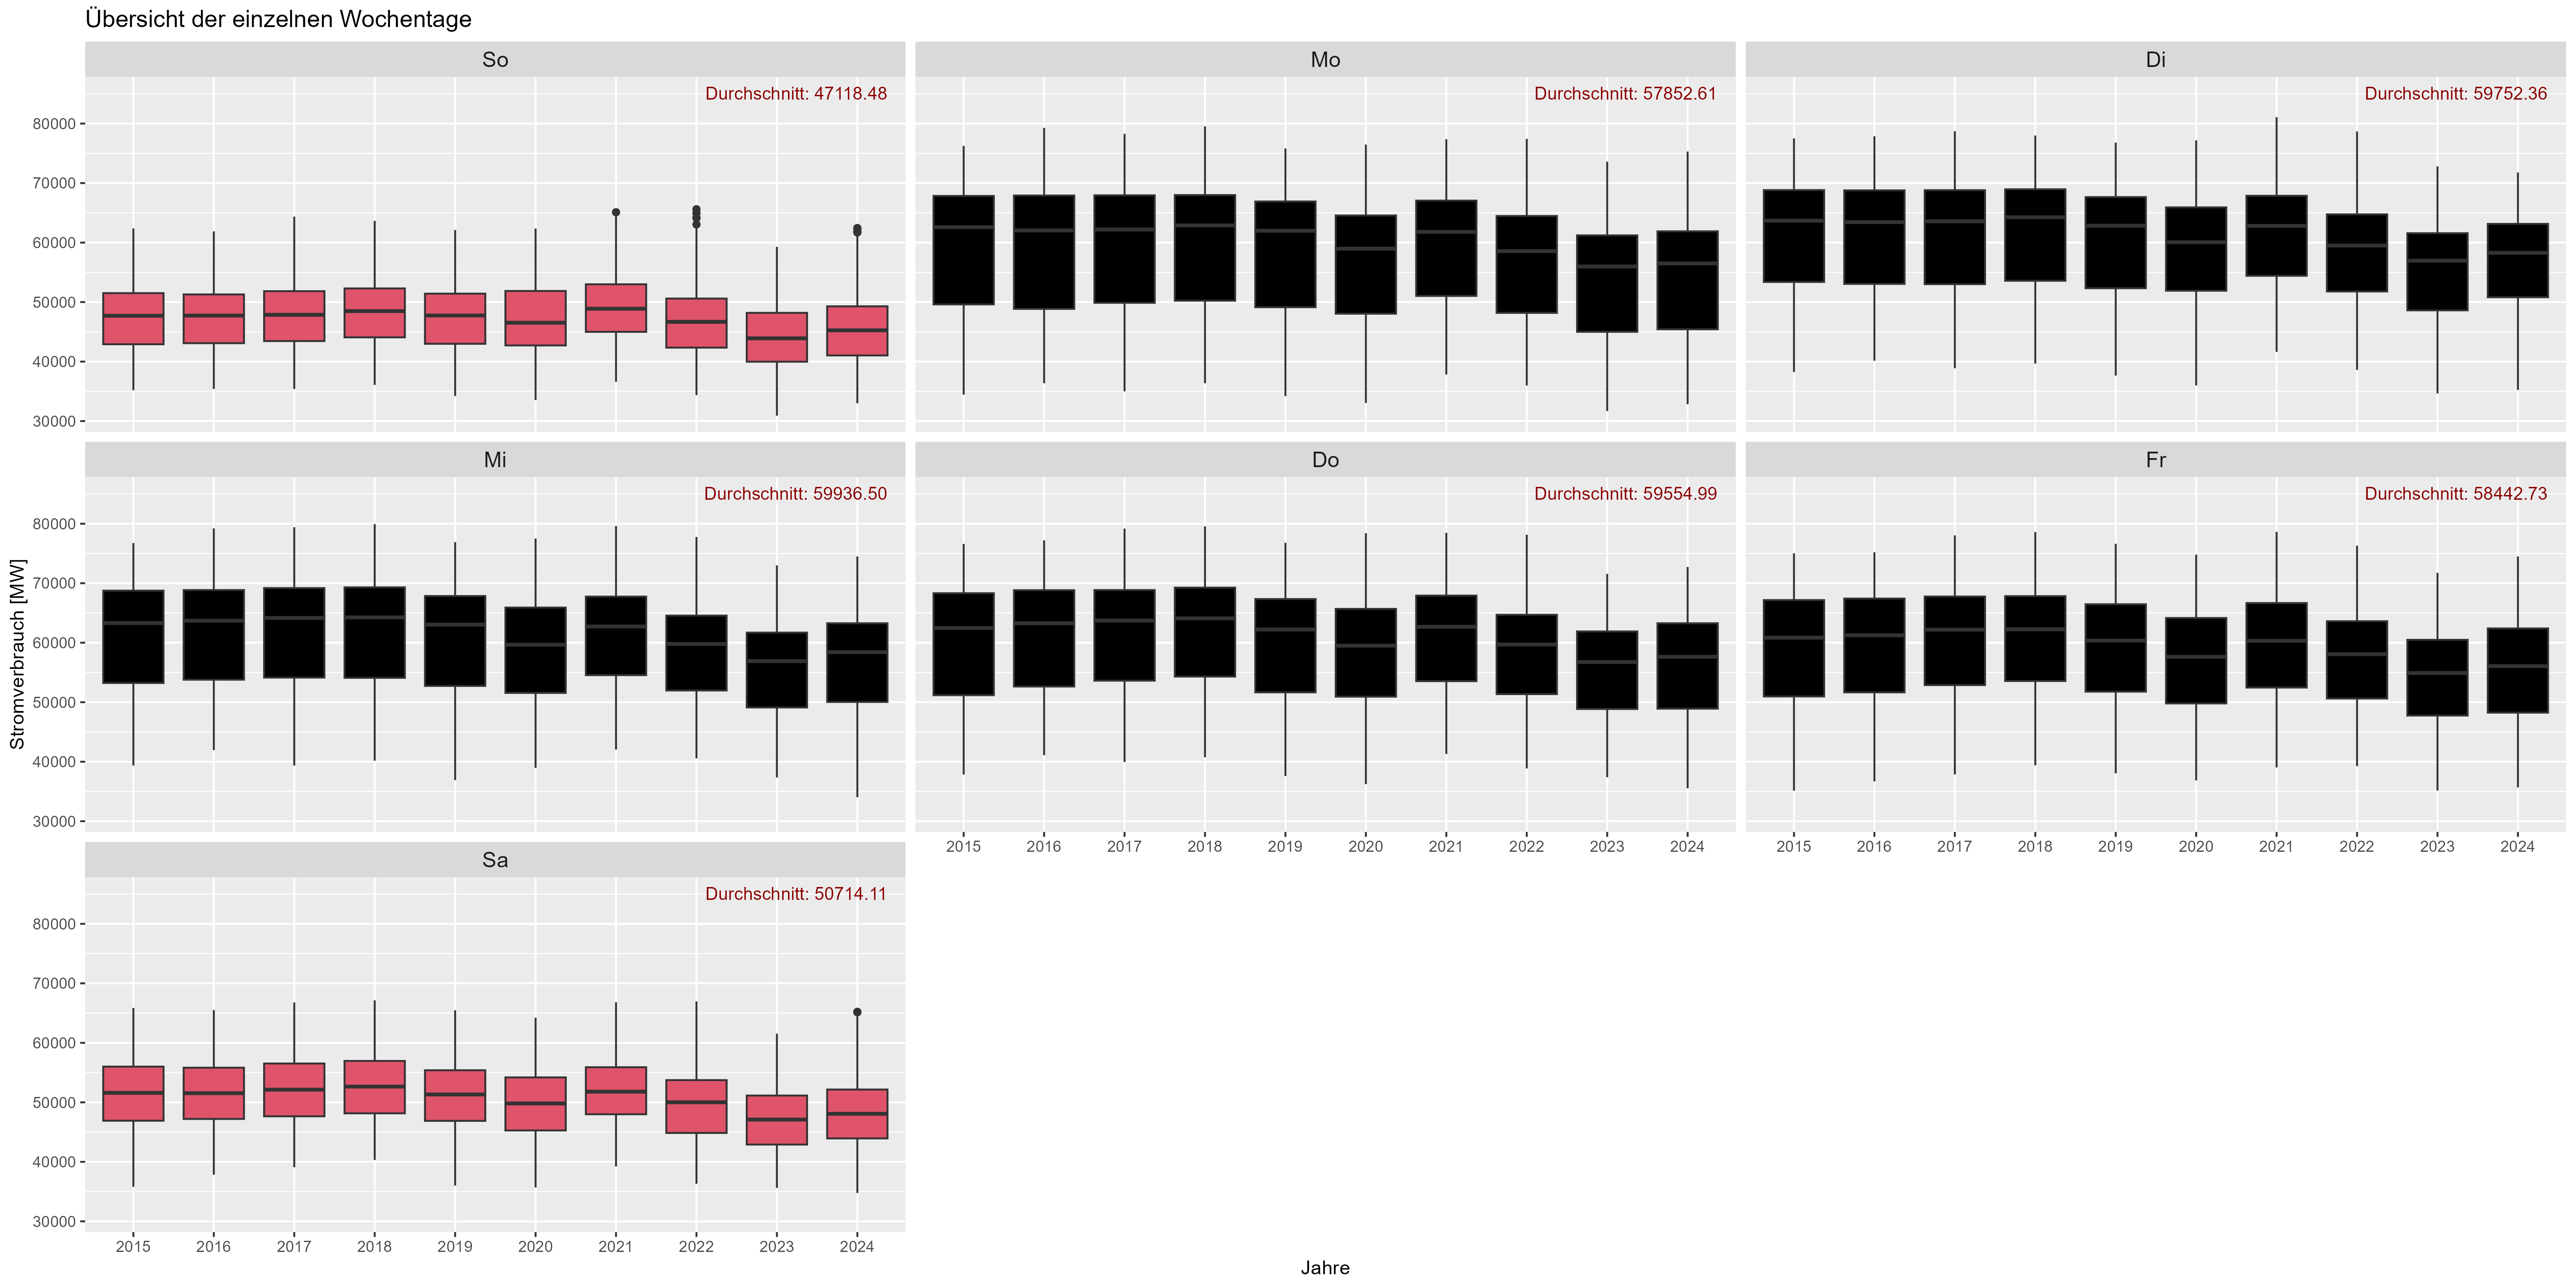 図 6 消費電力の「曜日効果」
図 8 は休日の影響を示しています。 「Durchschnitt」は、長年にわたる平均電力消費量です。休日 (赤) と比較して、「営業日」 (ダークグレー) では電力消費量が大幅に増加しています。ここで、休日は電力消費にとって週末のように機能すると仮定できます。」
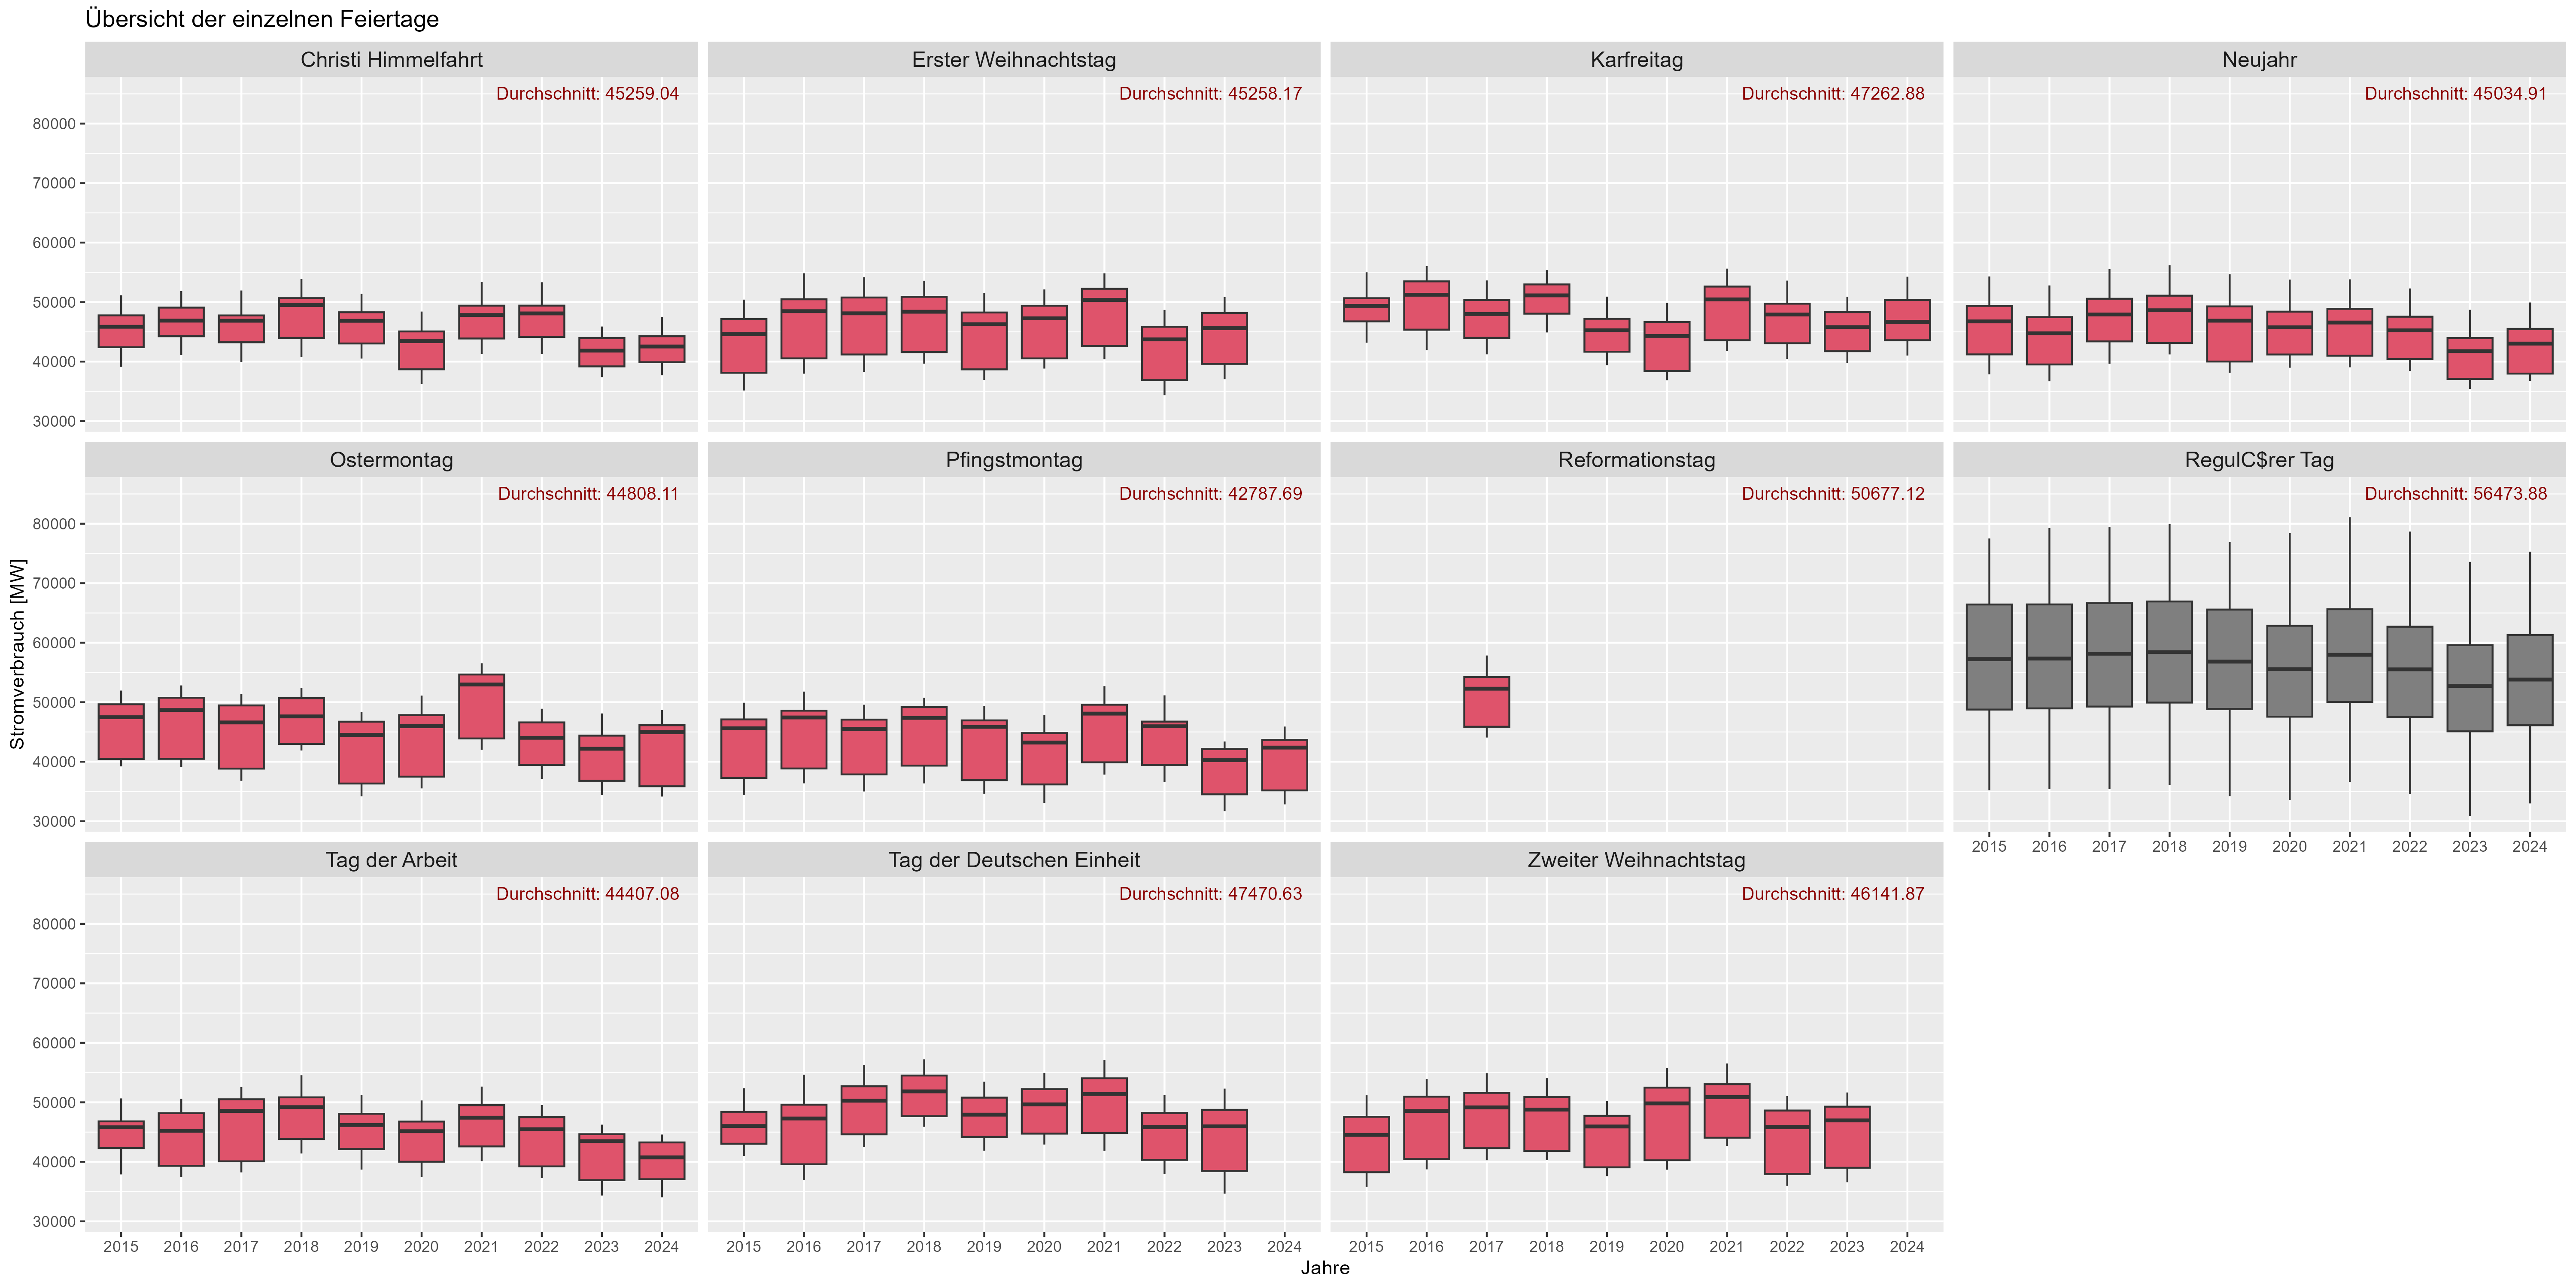 図6 消費電力「休日効果」
図 7 は、日ごとのさまざまな行動を表しています。 4つのカテゴリがあります。 「Feiertag Kein Wochenende」は、休日ではあるが週末ではないことを意味します。 「Feiertag Wochenende」は休日、週末を意味します。 「Kein Feiertag Kein Wochenende」は通常の勤務日を意味し、「Kein Feiertag Wochenende」は単なる週末を意味します。想定どおり、非定常営業日でも同様の分布を観察できます。
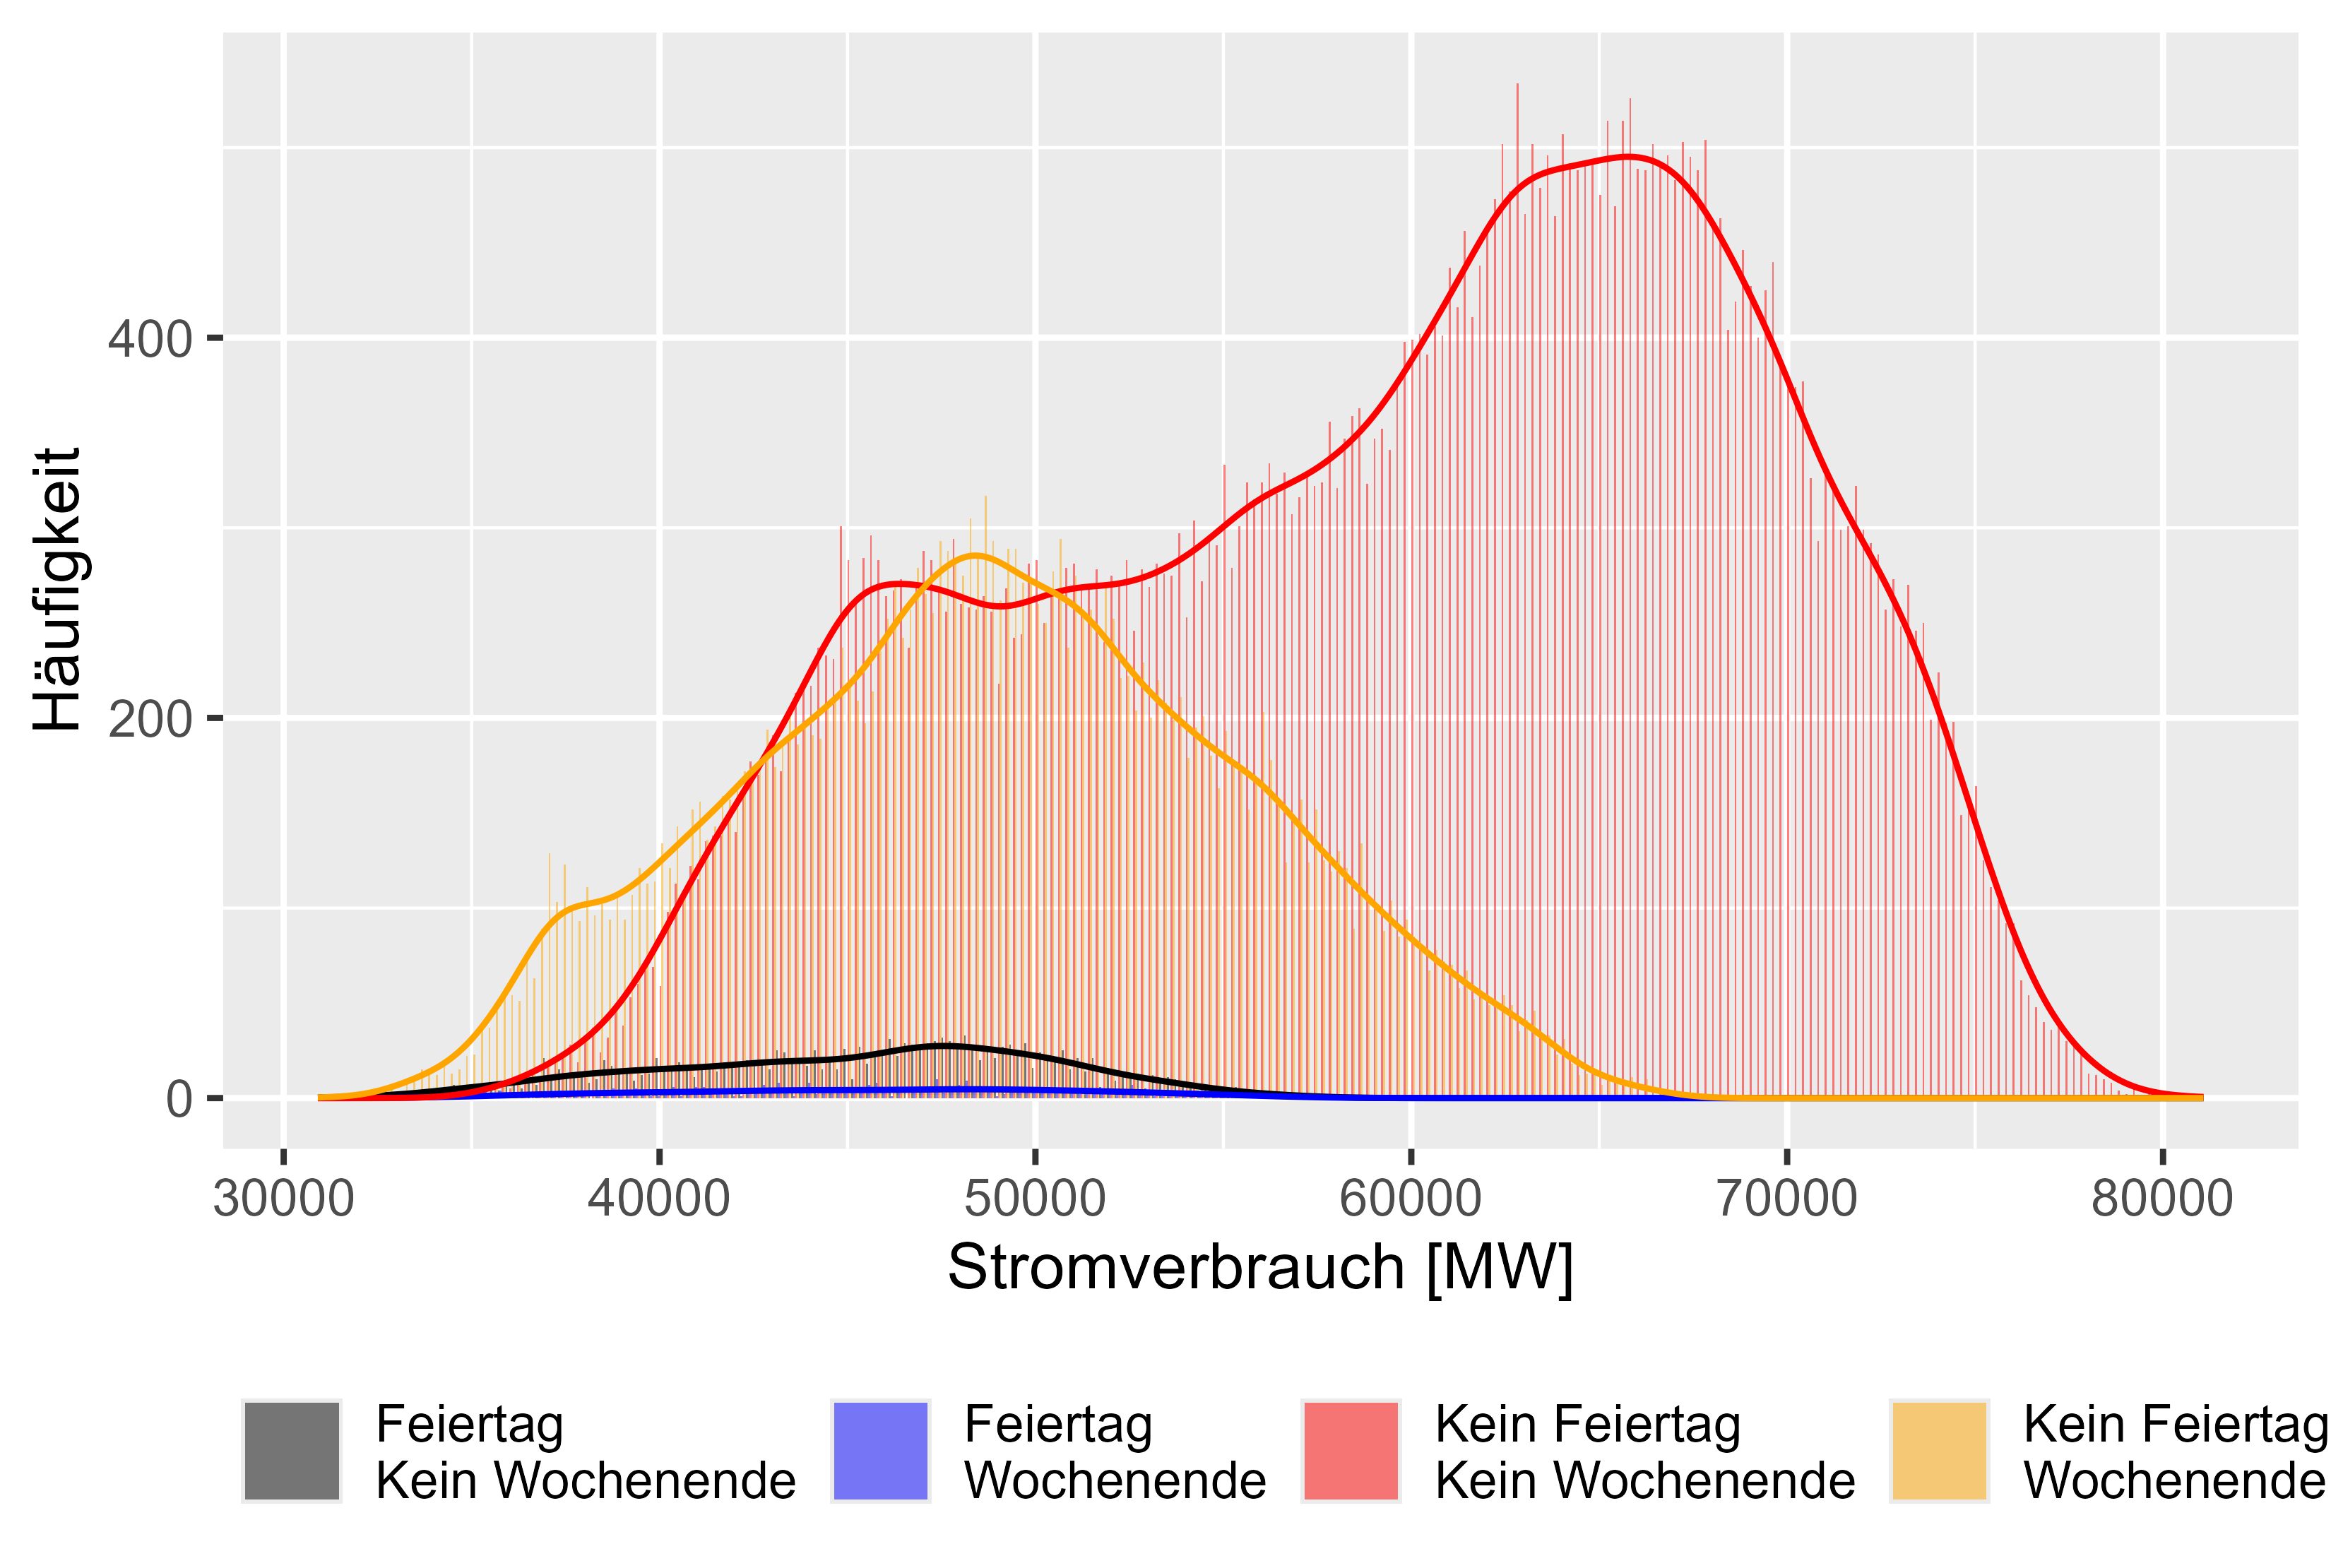 図 7 消費電力の「異なる効果」の比較
MeanLastTwoDays、MeanLastWeek、MaxLastOneDay、MinLastOneDay などの時間差値が生成された特徴です。
DOI で説明されているものと同様: 10.1109/TPWRS.2011.2162082 - セミパラメトリック加算モデルに基づく短期負荷予測
図 8 ~ 11 (赤色は非稼働日) は、実際の電力消費量に対するこの遅れた値を表しています。
この生成された特徴には軽い相関関係があります。
 # Check Correlation
cor <- cor(cleaned_power_consum[sapply(cleaned_power_consum, is.numeric)], method = c("pearson", "kendall", "spearman"), use = "complete.obs")
| 特徴 | PowerConsum との相関関係 |
|---|---|
| 休日平滑化 | -0.556194 |
| 先週の平均 | 0.389044 |
| 平均最後の 2 日間 | 0.201253 |
| MaxLastOneDay | 0.320193 |
| 最小最終一日 | 0.348583 |
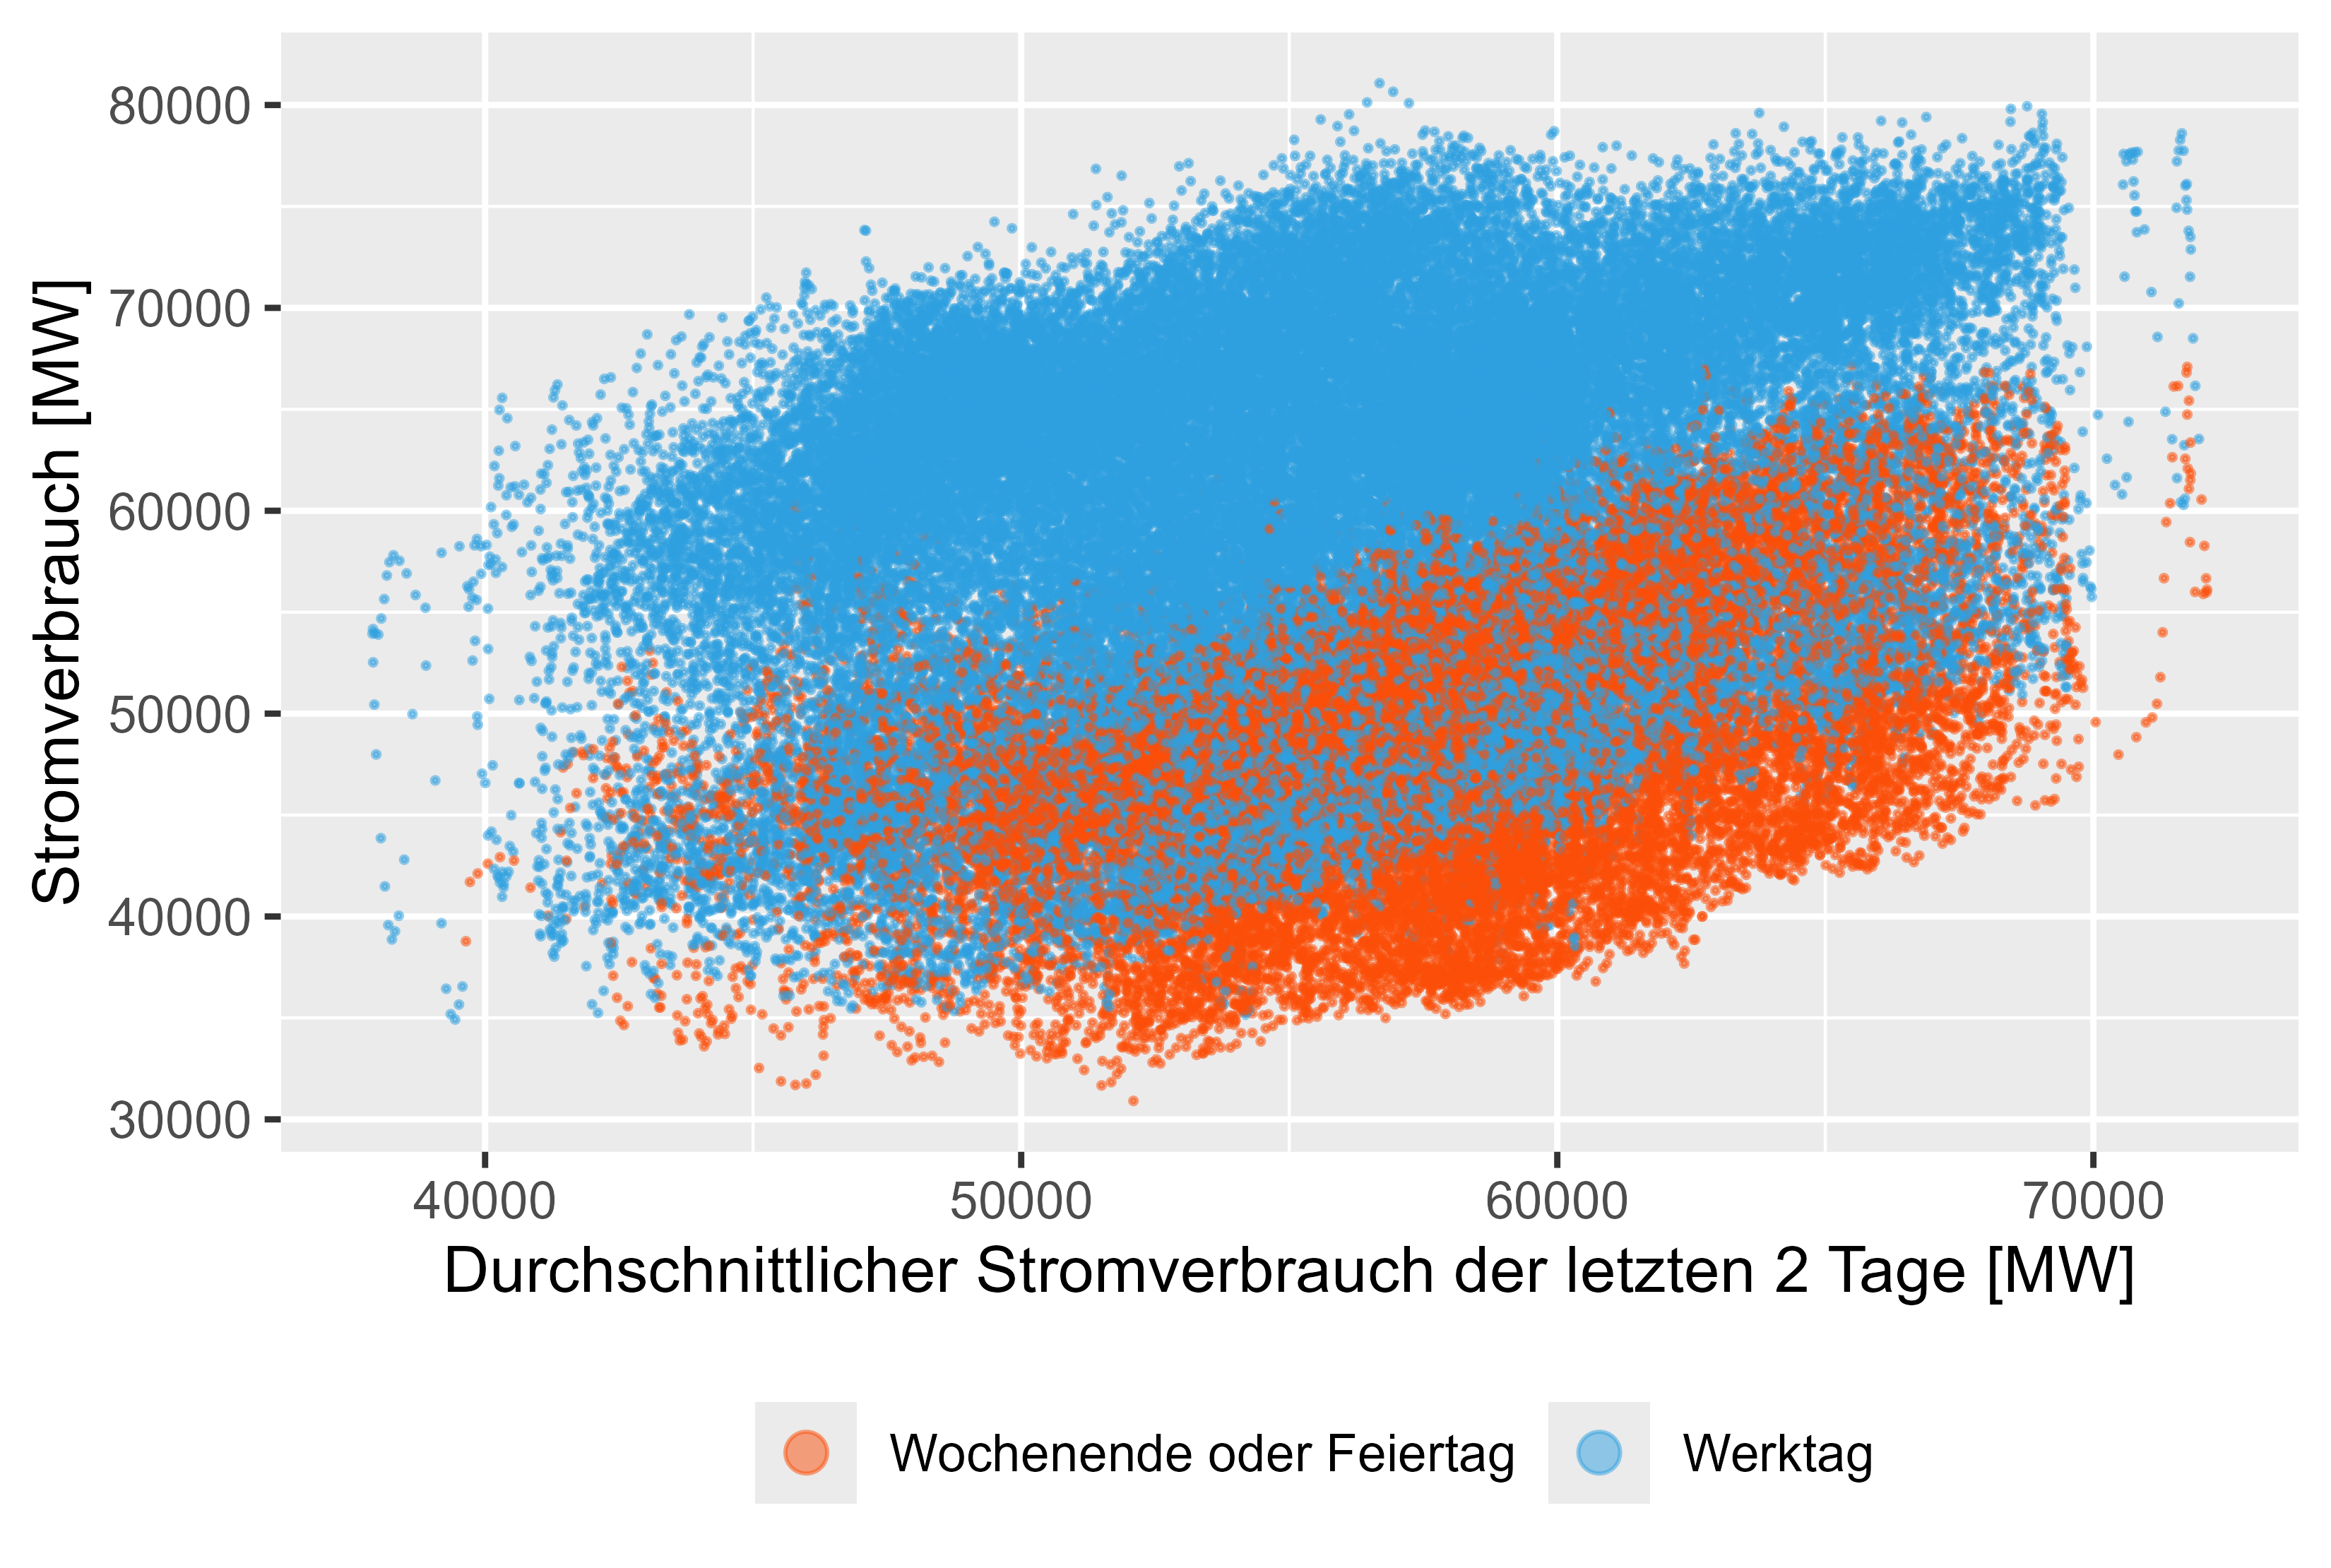 図 8 消費電力 - MeanLastTwoDays
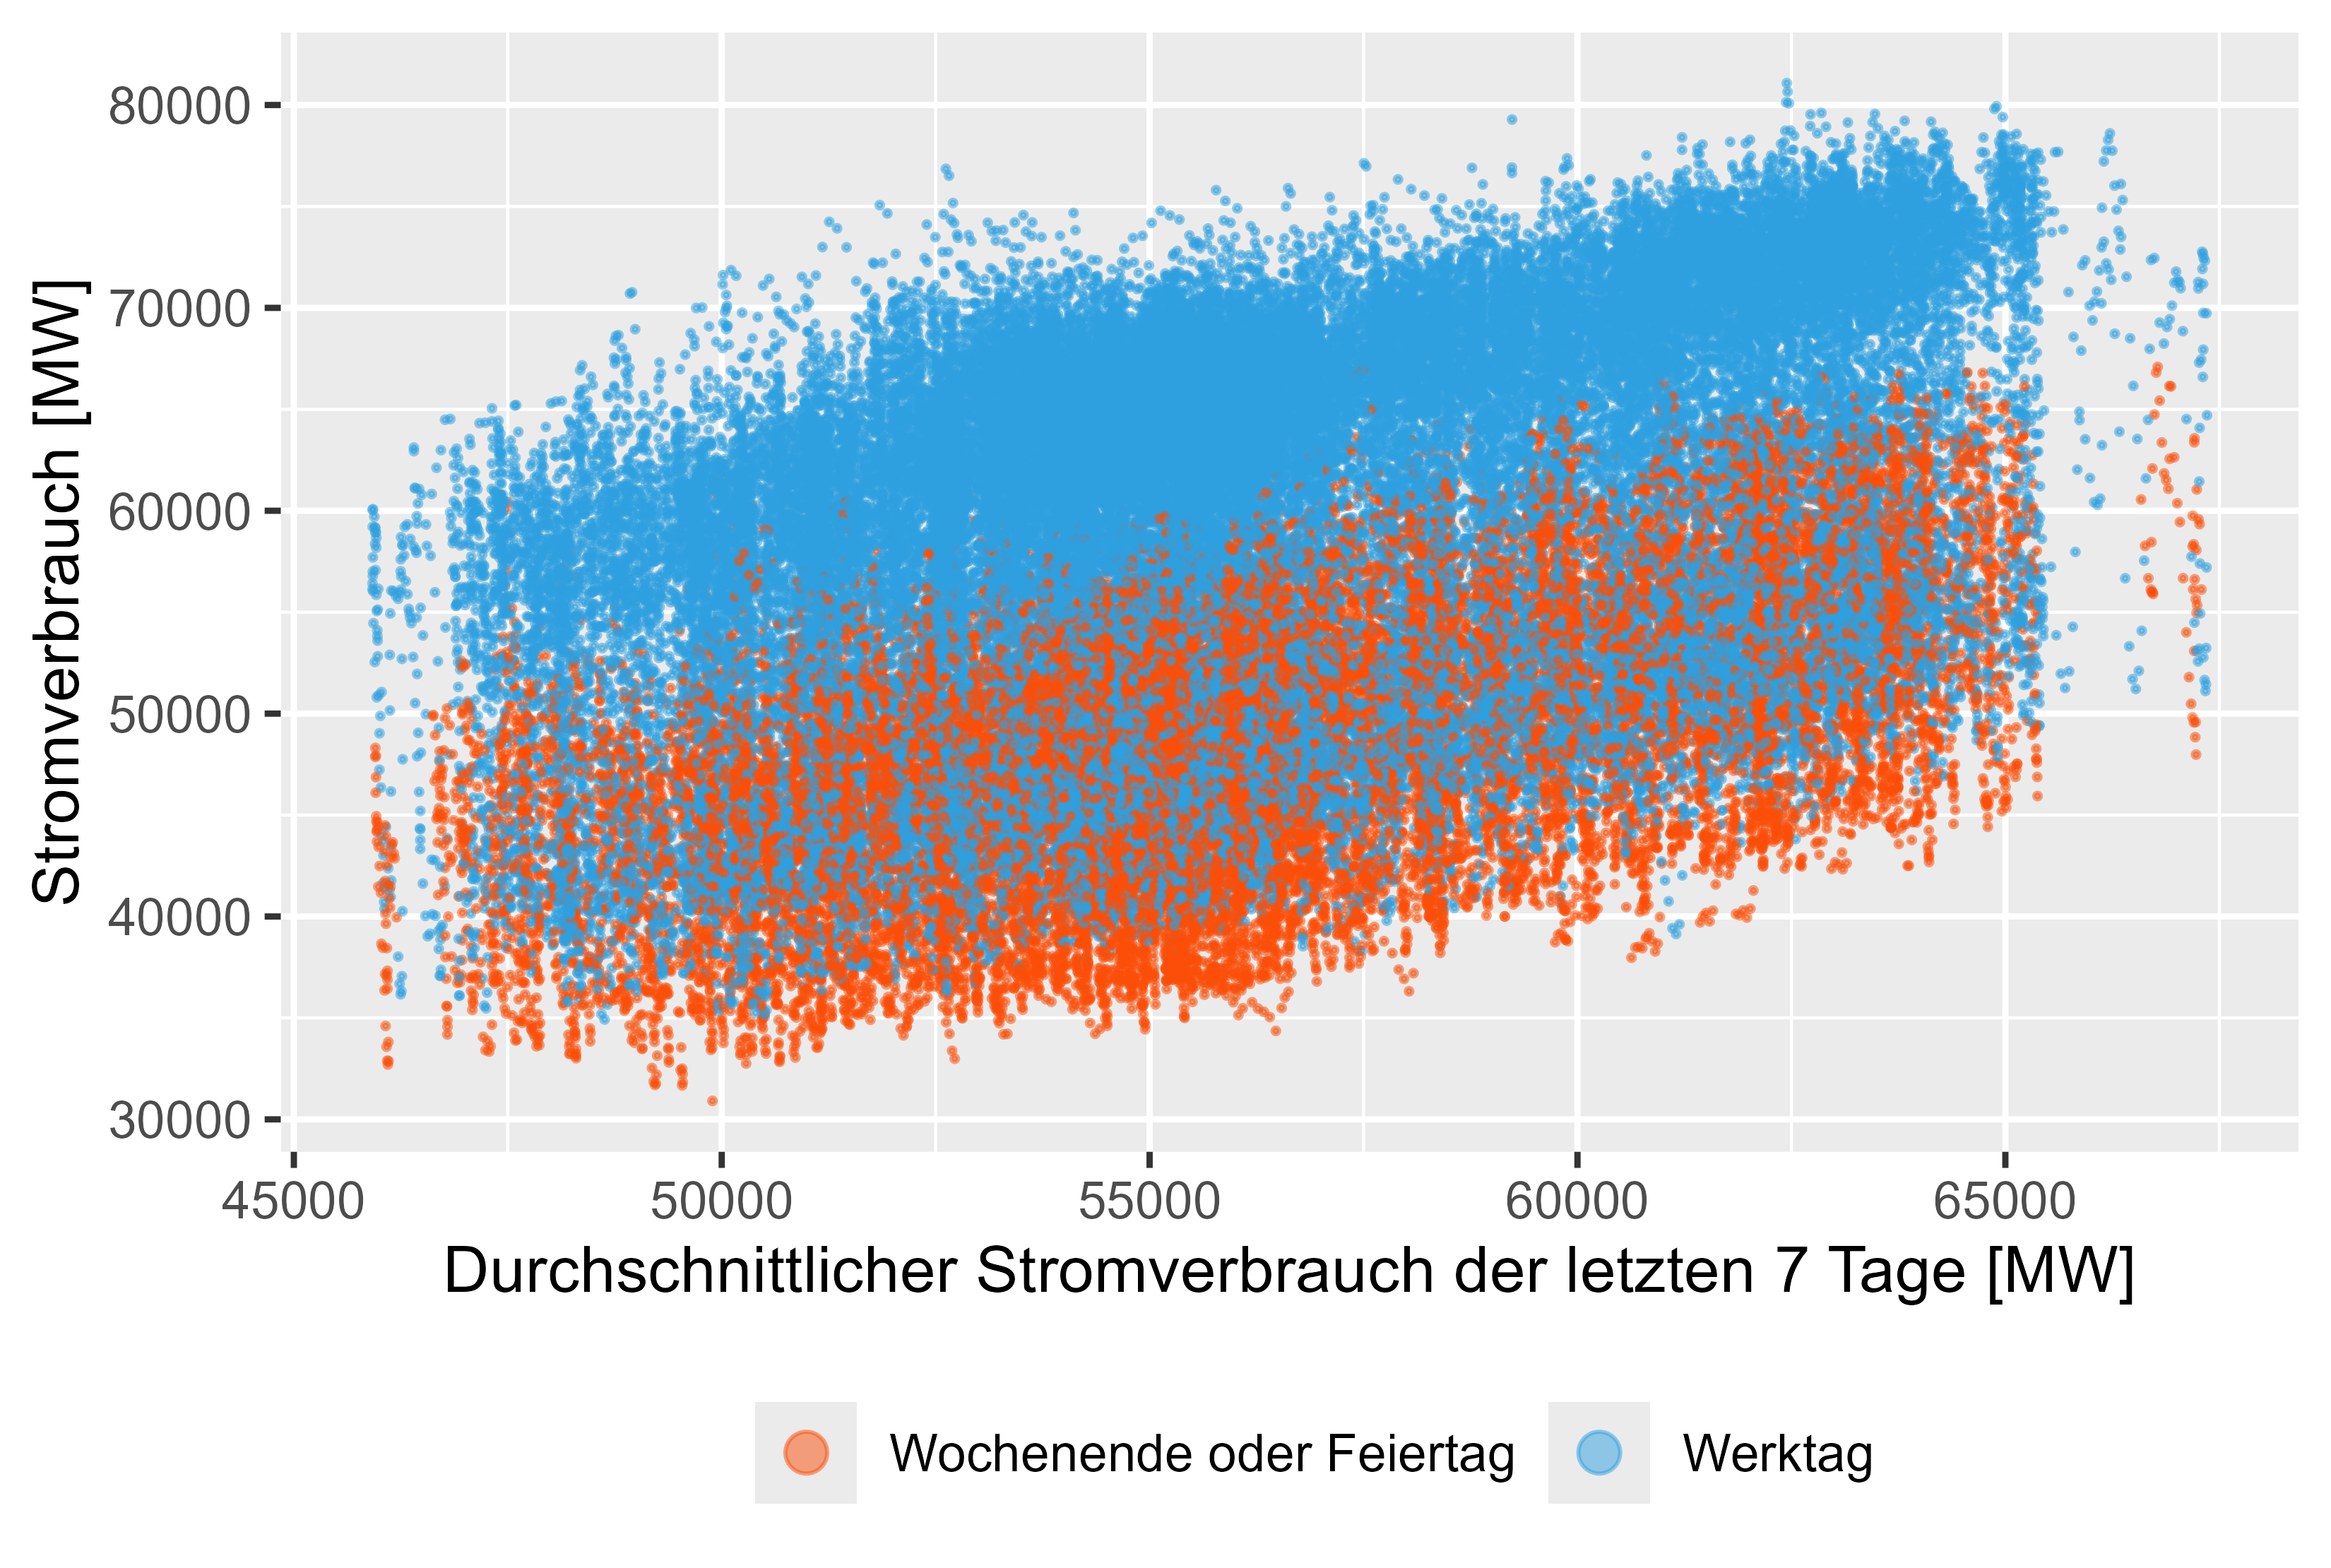 図 9 消費電力 - 先週の平均
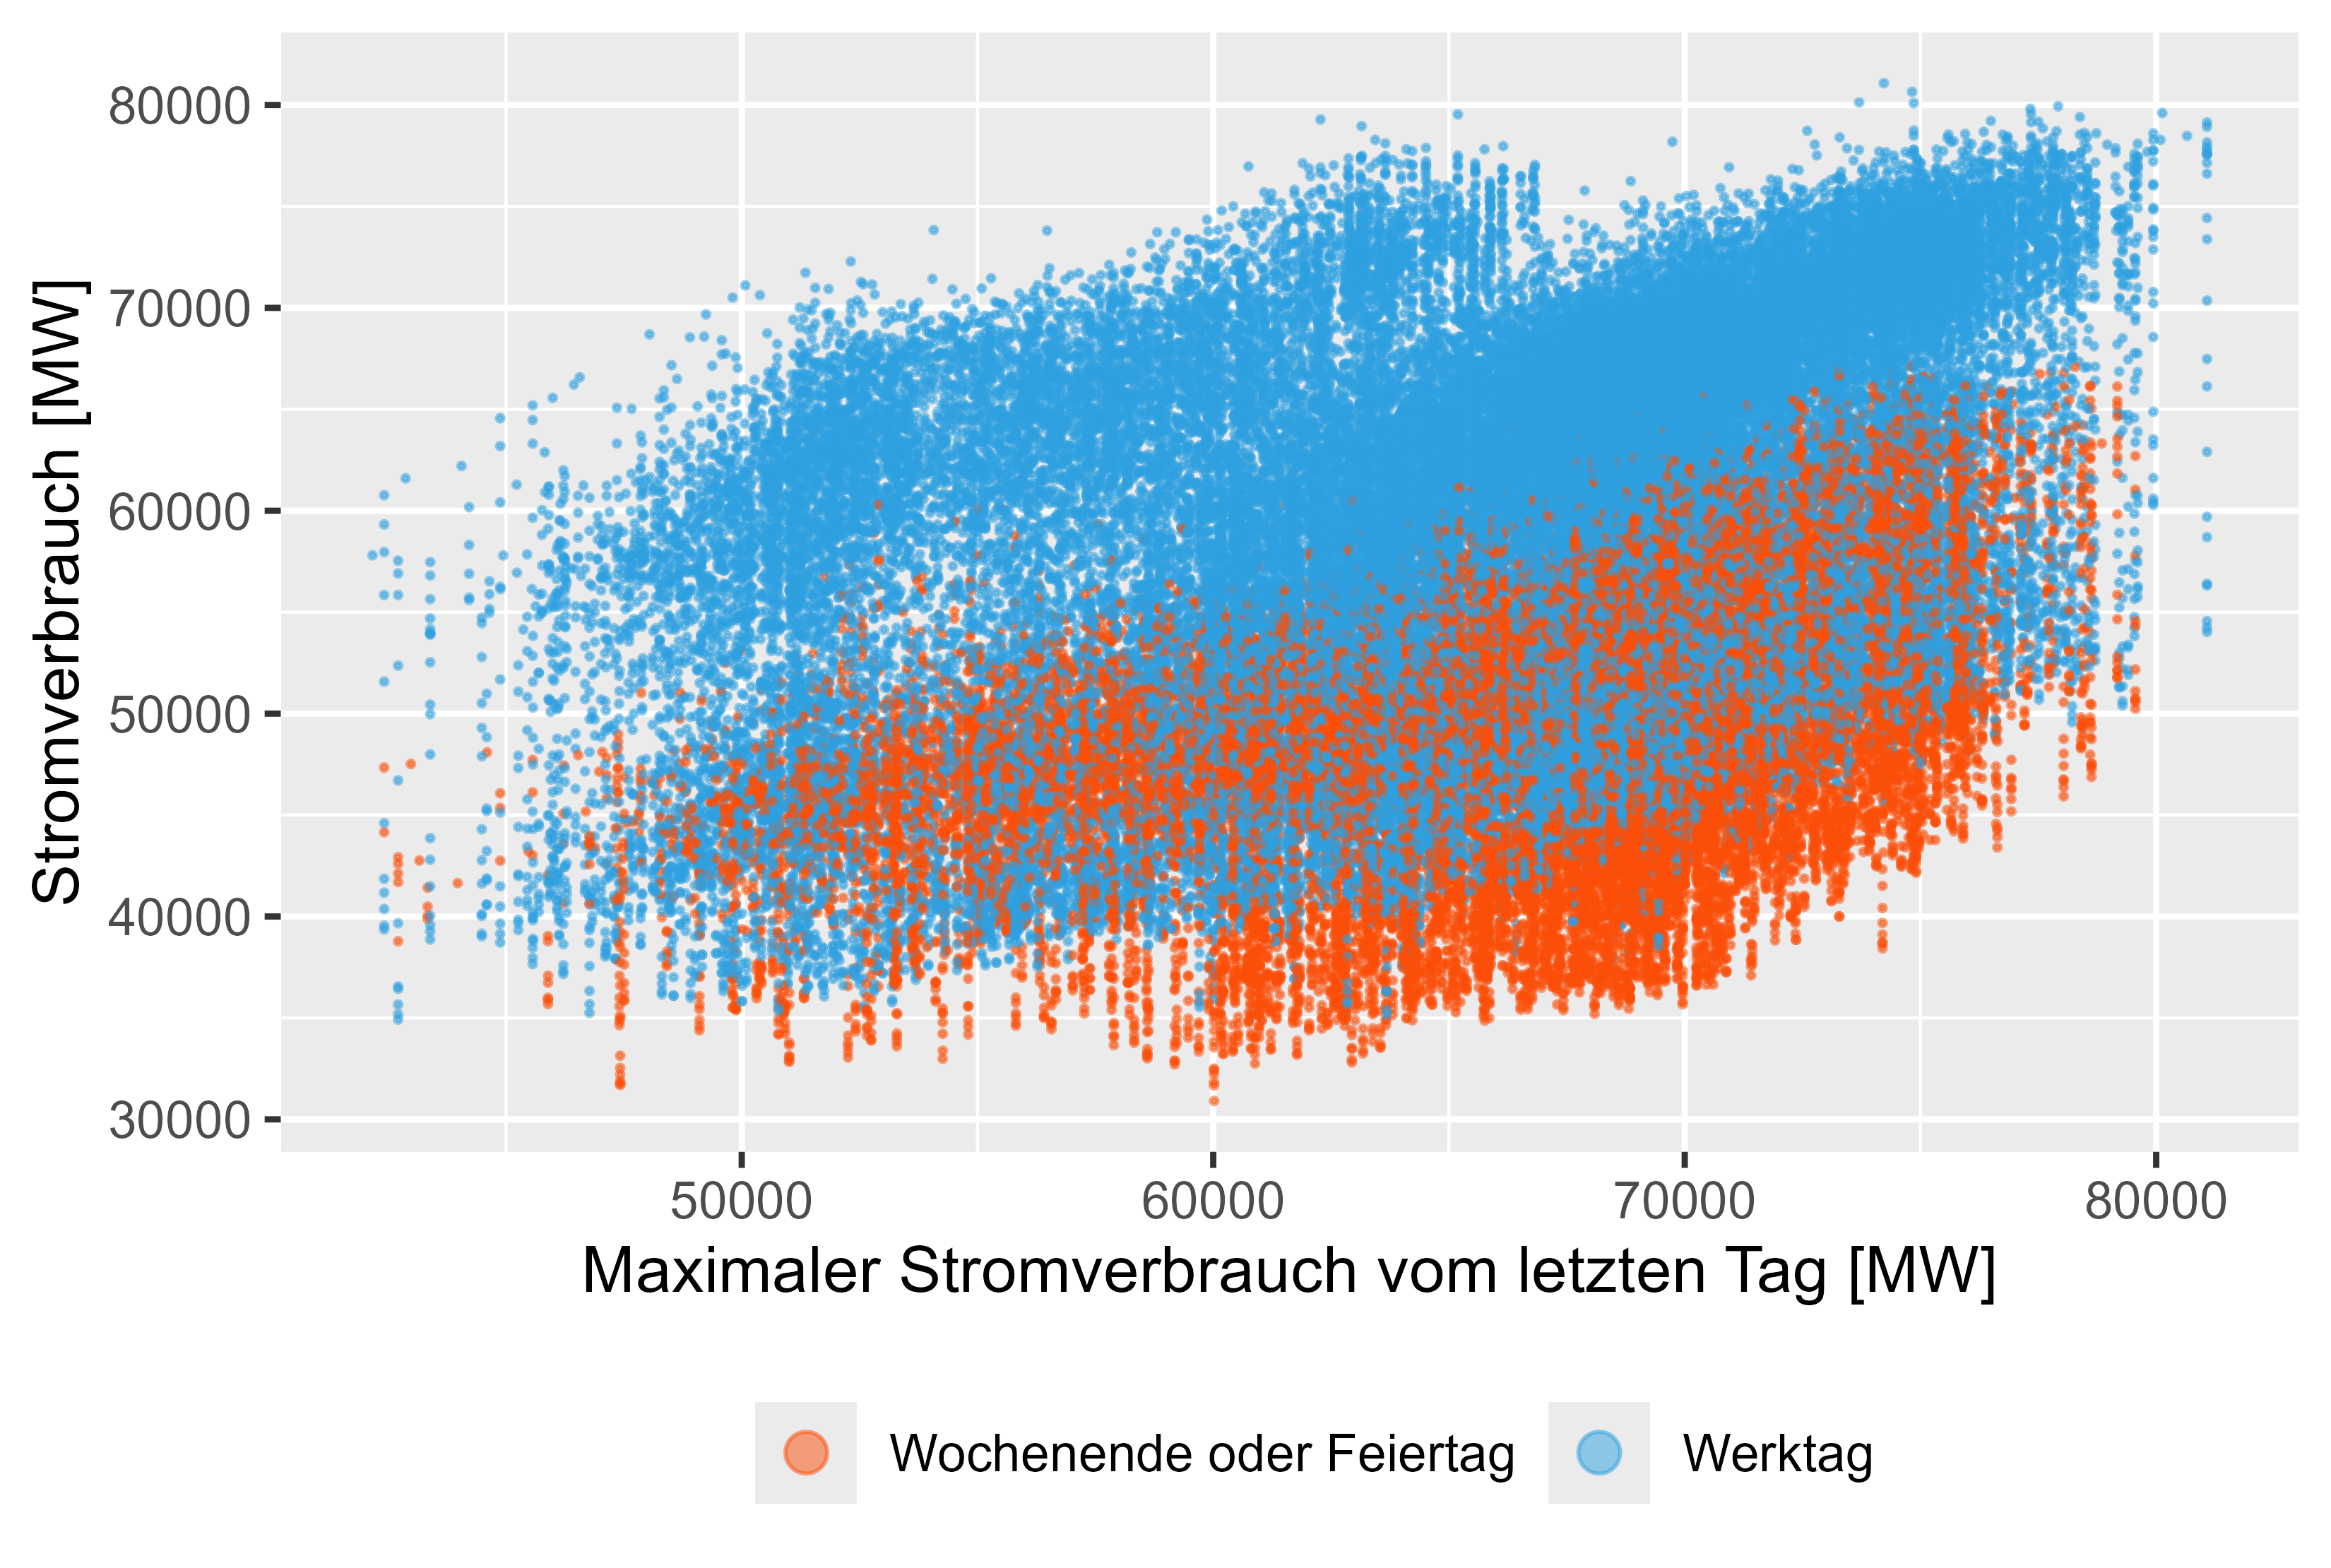 図 10 消費電力 - MaxLastOneDay
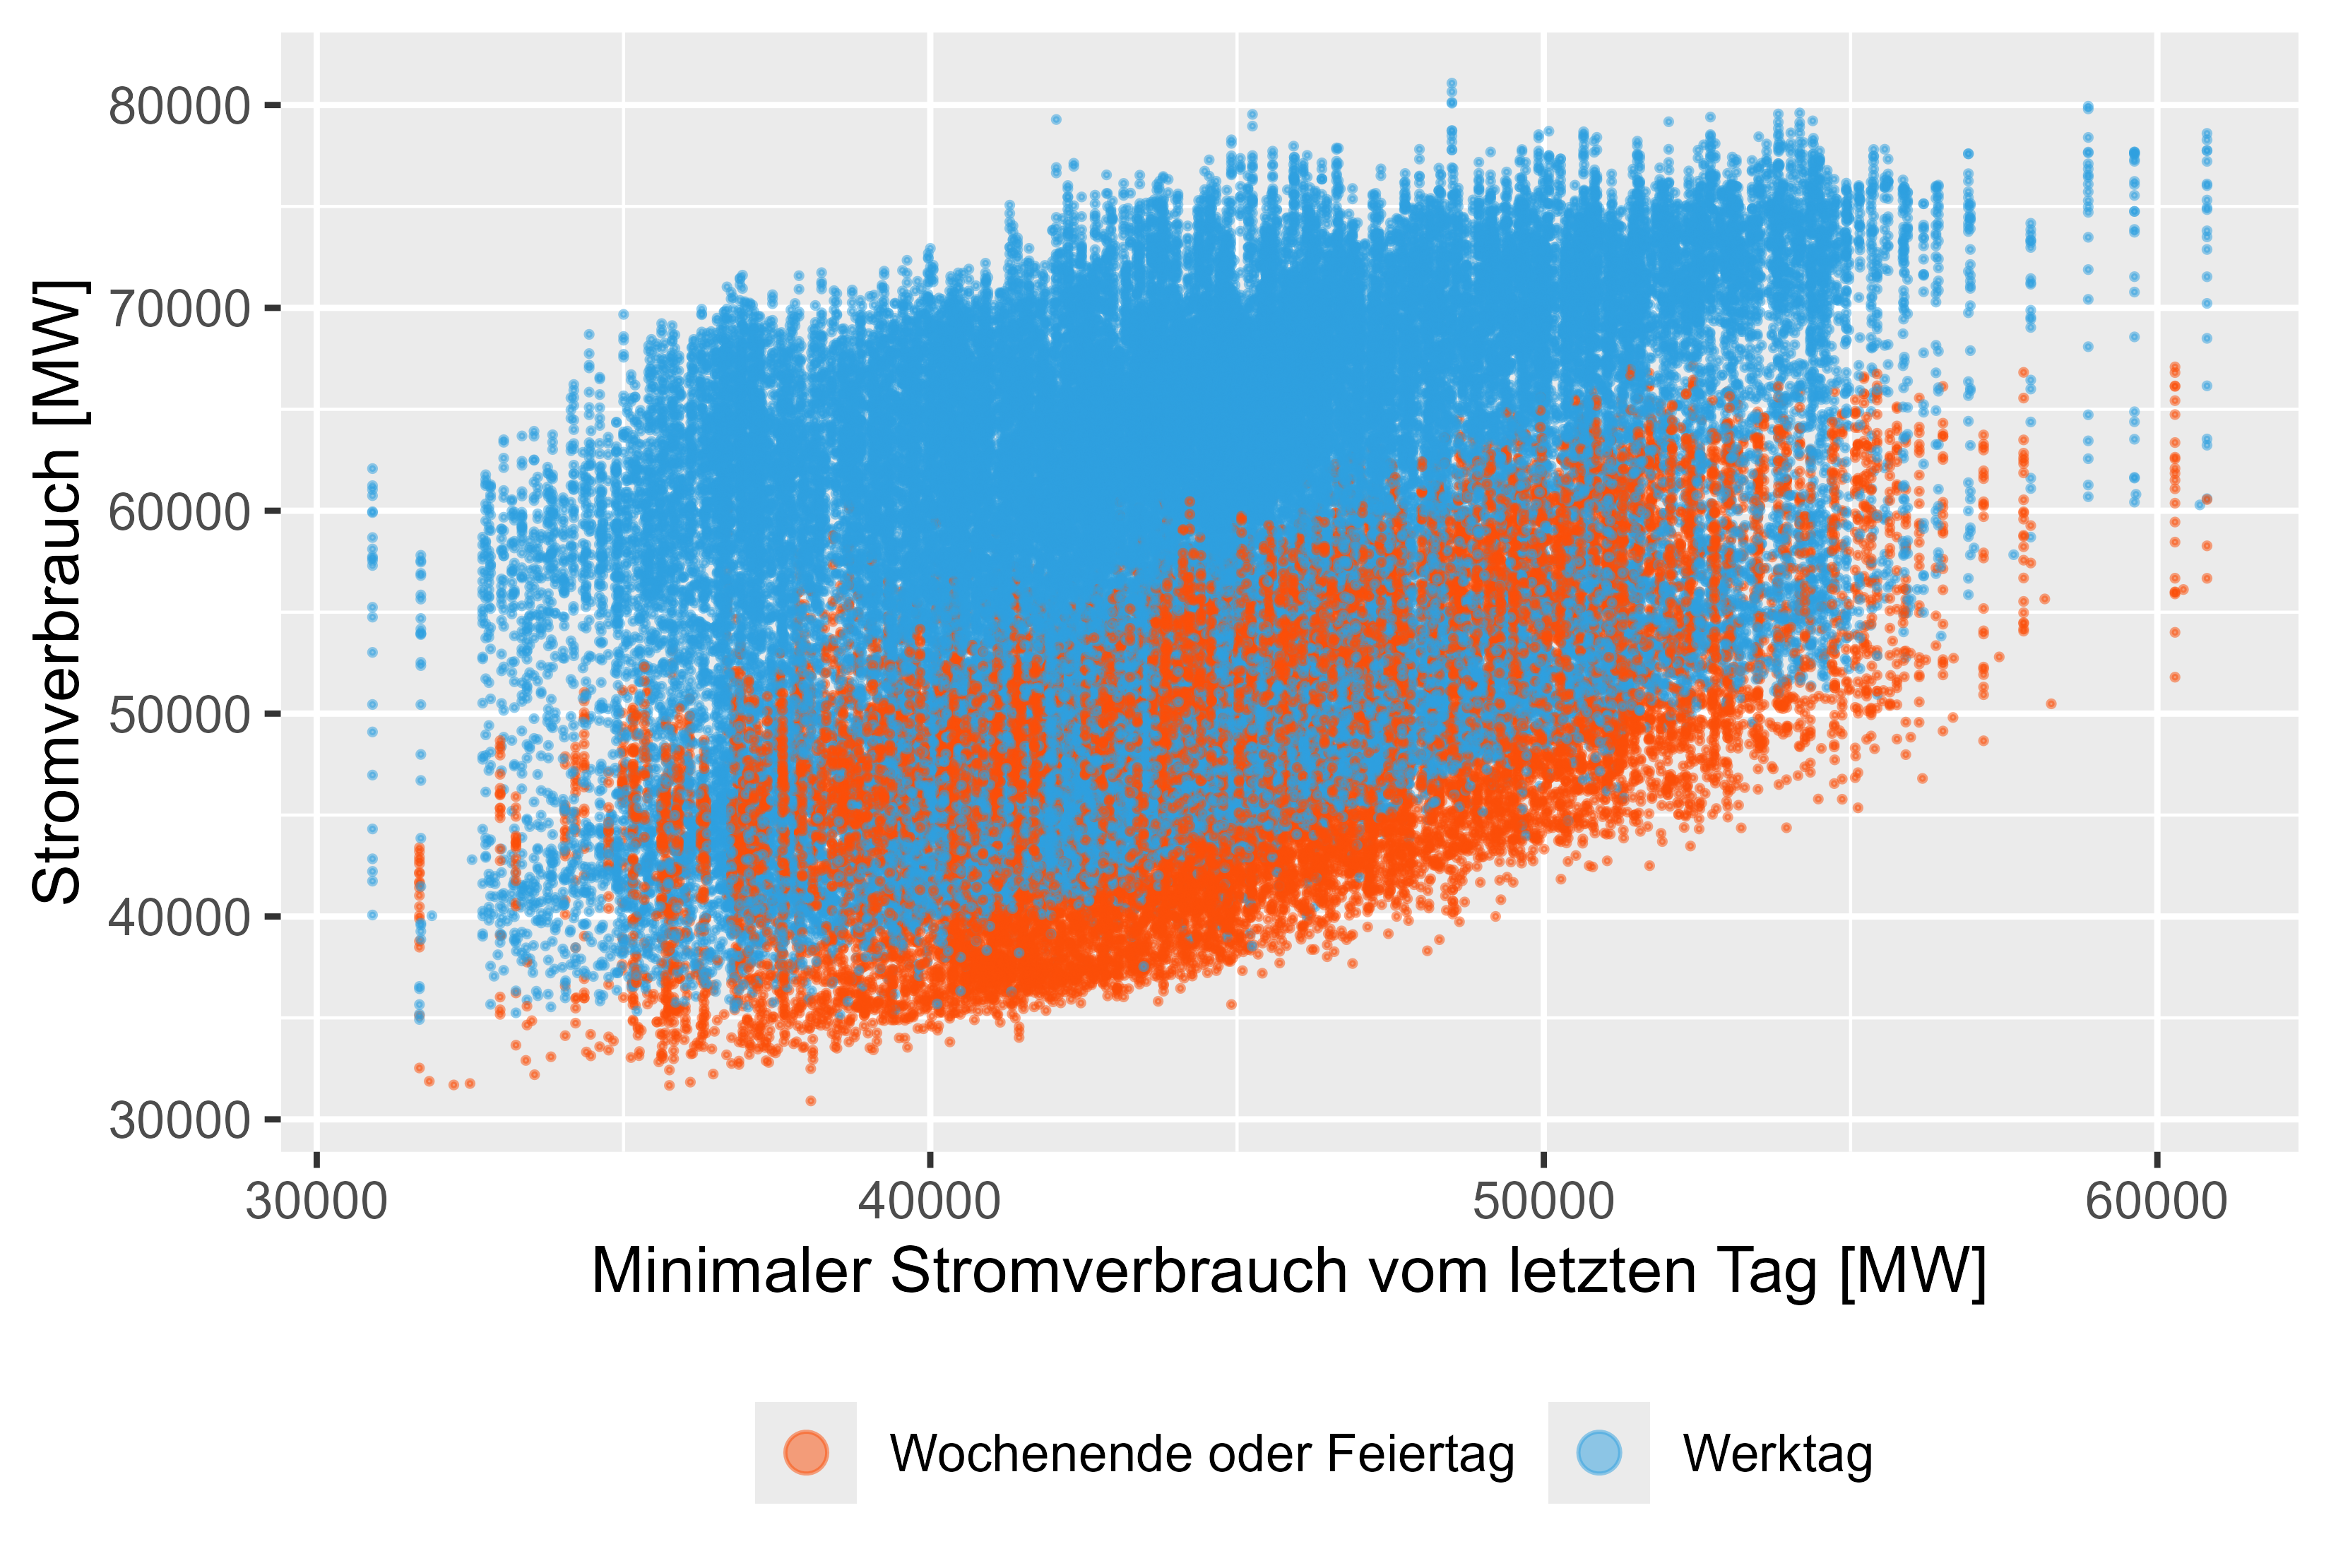 図 11 消費電力 - MinLastOneDay
複雑な季節性があります。時間単位の解像度には、年、週、日の季節性があります。モデルによって追跡する必要があるもの。ここでの解決策は、「予測: 原則と実践」第 12.1 章「複雑な季節性」で説明されているように、フーリエ項を使用して cos() および sin() を介して複雑な季節性を表し、組み立てます。
ACF および PACF プロットを少し見ると、顕著なスパイクはほとんどありませんが、これは 96 個の遅れた値を表しているだけです。 1 年間に約 9,000 件の遅れた観測を取得すると、複雑な季節性が存在することになります。このため、フーリエ項を使用する方が簡単です。また、PDQ と pdq コンポーネントを見つけるだけではうまく機能しませんでした。
 ARIMA(...
stepwise=FALSE,
greedy=FALSE,
approx=FALSE)
自体。また、フーリエ項を使用しない場合、トレーニング時間は大幅に増加します。
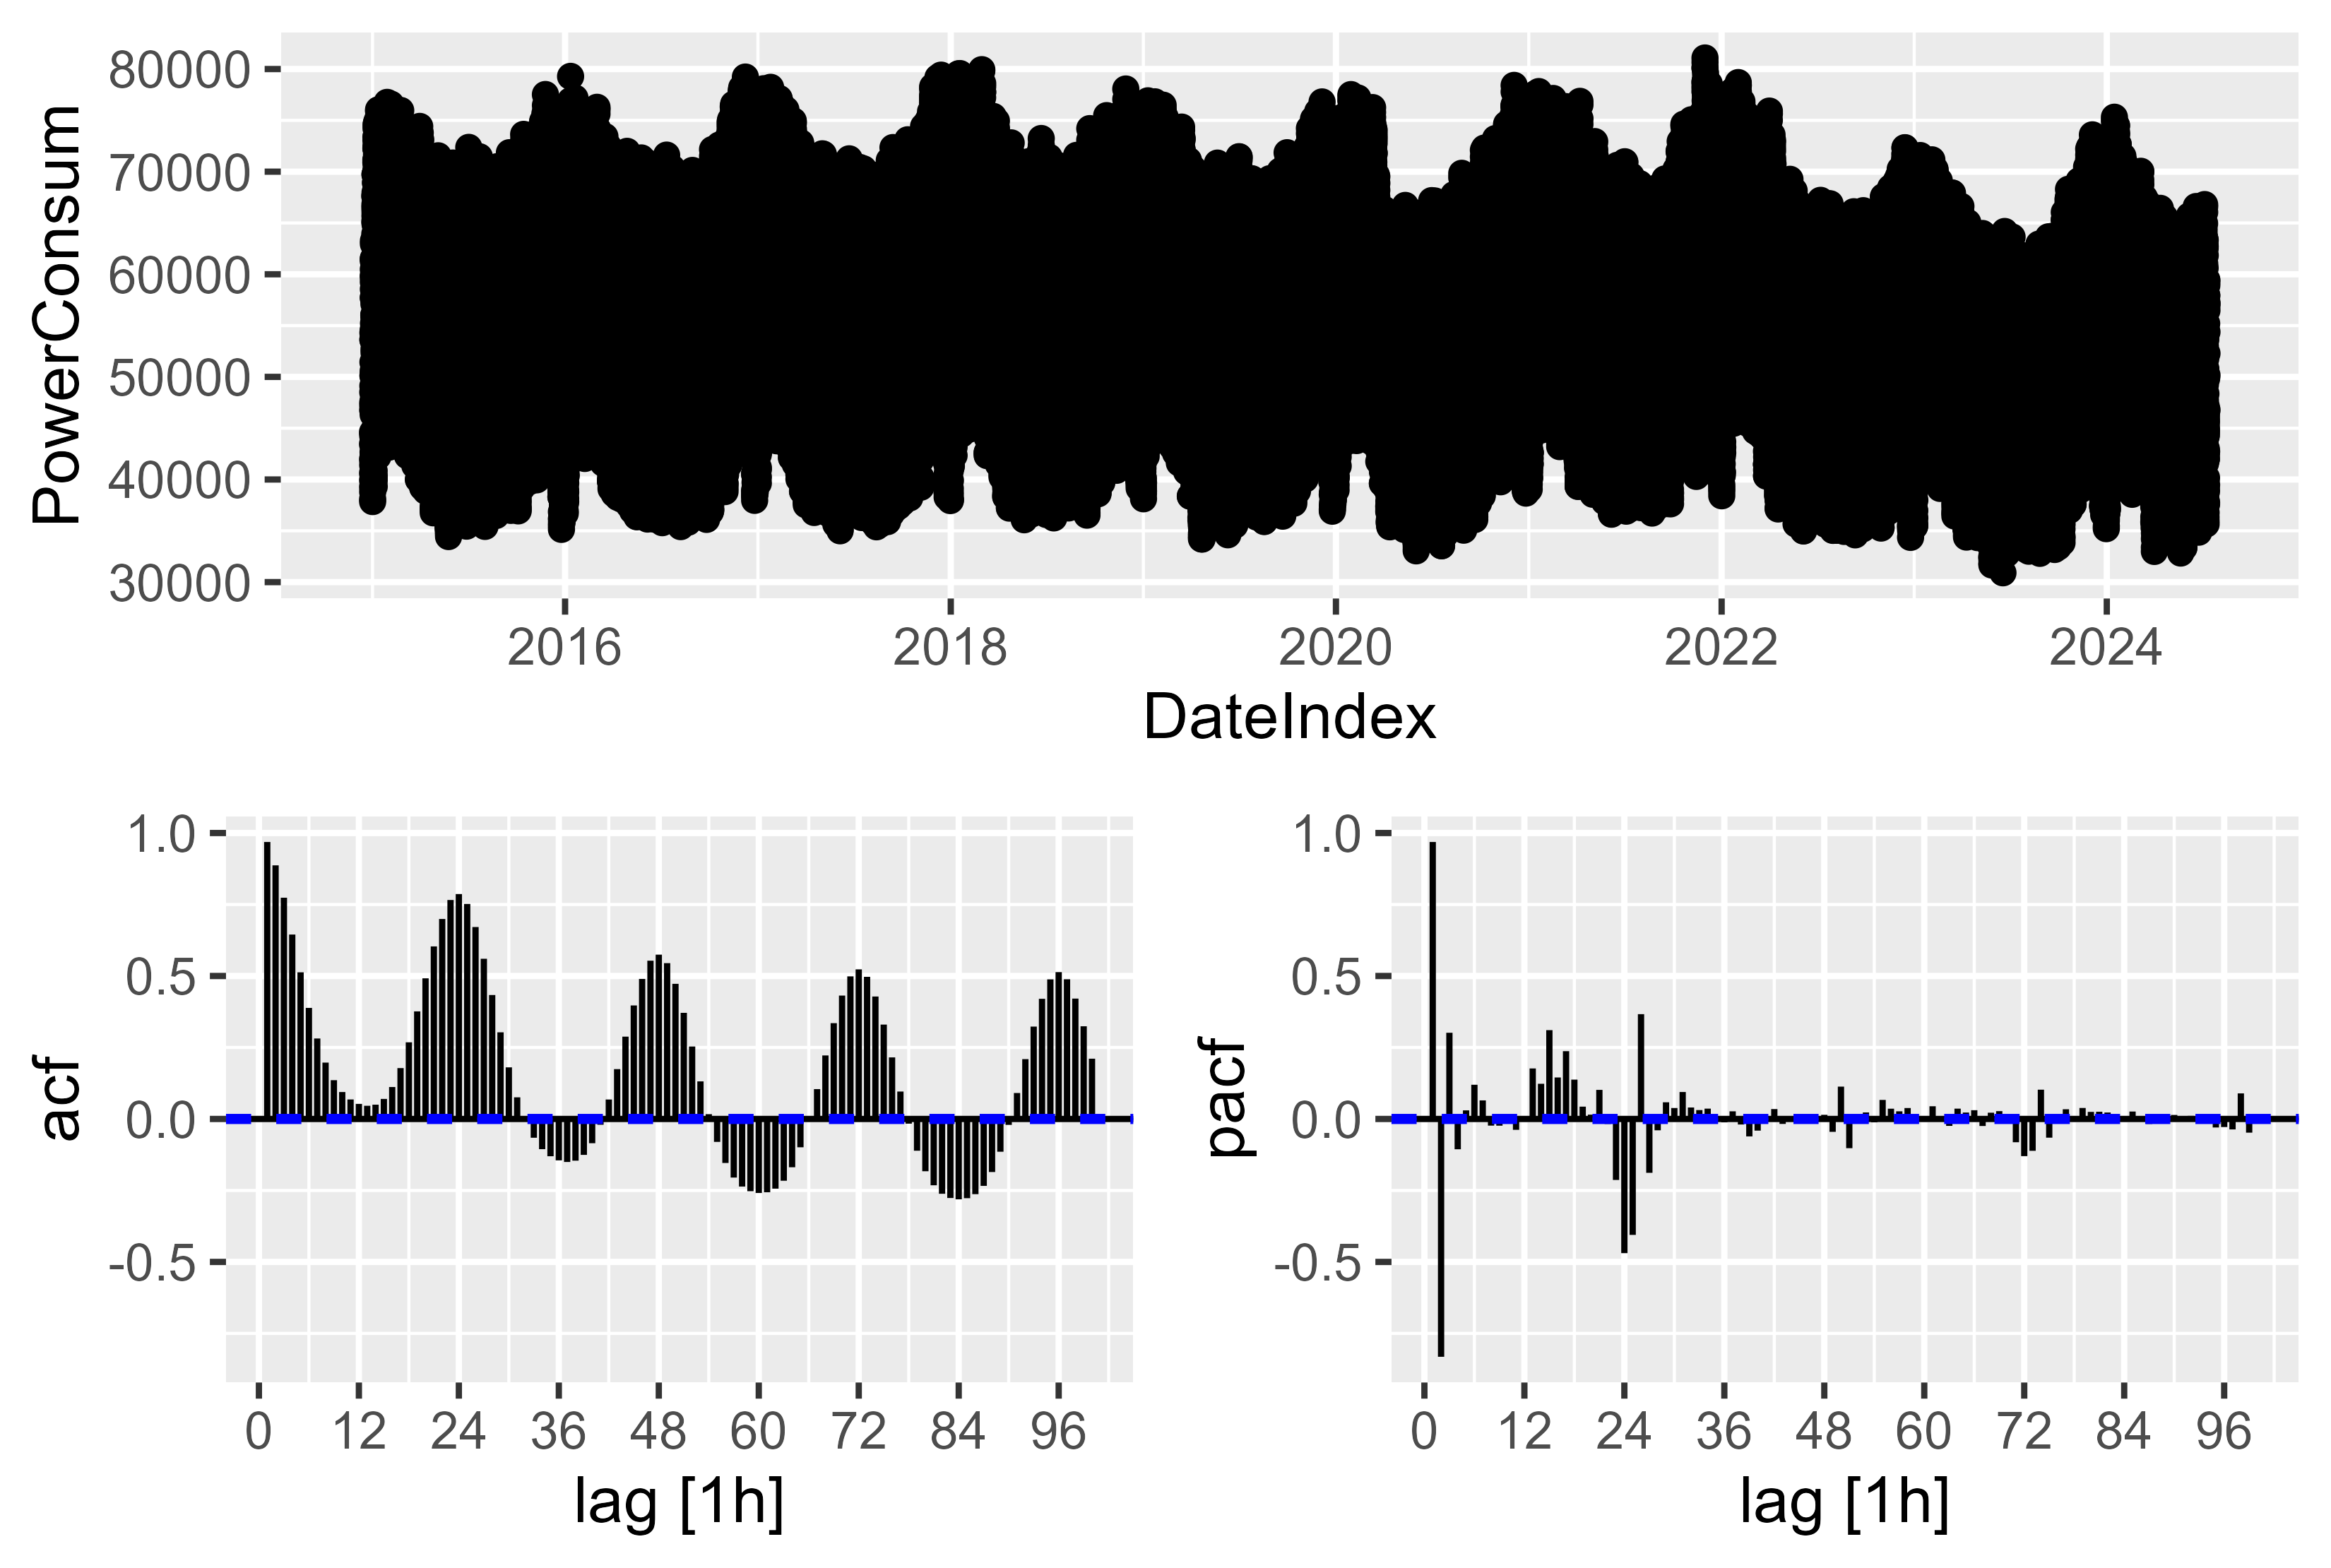 図 12 電力消費量 - ACF PACF の生の電力消費量のプロット
この作業で見つかった最良の機能の組み合わせは次のとおりです。
モデルを比較するには、メトリクス MAE と MAPE を使用します。 SMARD は、SMARD ページの「Bundesnetzagentur」のモデルです。 Prophet モデルも試用され、安定したパフォーマンスを示しましたが、十分ではありませんでした。
SMARD の予測値は、MAPE 3.6% に達しました。 <- この研究には含まれていません。
トレーニングデータ:
これまでに見つかった最良のモデルは LHM + DHR (線形調和モデル + 動的調和回帰)
このアイデアは、線形モデルを ARIMA モデルとアンサンブルすることです。 ARIMA モデルでは休日のダミー変数を扱うのが難しかったためです。そこでアンサンブルモデルが役に立ちました。
 train_power_consum <- cleaned_power_consum |>
    filter(year(DateIndex) > 2020 & (year(DateIndex) < 2024))

generate_models(model_name = "model/mean_naive_drift",
                train_power_consum = train_power_consum)

train_power_consum_v5 <- train_power_consum |>
  mutate(HolidaySmoothed = Holiday + sin(2 * pi * (as.numeric(Hour)+1) / 24))

holiday_effect_model <- lm(
  PowerConsum ~
    HolidaySmoothed,
  data = train_power_consum_v5
)

saveRDS(holiday_effect_model, file = "ensemble_model/version_5/holiday_effect_2021_2023.rds")

train_power_consum_v5$Residuals <- residuals(holiday_effect_model)

fit <- train_power_consum_v5 |>
  model(
    ARIMA = ARIMA(Residuals ~
                    PDQ(0,0,0)
                  + pdq(d=0)
                  + MeanLastWeek
                  + WorkDay
                  + EndOfTheYear # new
                  + FirstWeekOfTheYear # new
                  + MeanLastTwoDays
                  + MaxLastOneDay
                  + MinLastOneDay
                  + fourier(period = "day", K = 6)
                  + fourier(period = "week", K = 7)
                  + fourier(period = "year", K = 3)
    )
  )

saveRDS(fit, file = "ensemble_model/version_5/arima_2021_2023.rds")
モデルの効果と仕組みを視覚化できました。図 13 は、このモデルの背後にある考え方を示しています。まず最初に、LHM モデルを当てはめて残差を計算します。残差によって DHR モデルをトレーニングし、両方を合計します。これは LHM のミラーのようなもので、値を上部に押し戻します。
LHM モデルの場合、ここでは 24 時間ごとに繰り返され、休日または平日に減少または増加する正弦曲線という単純なアプローチを使用します。
新しいデータの LHM を予測することで、新しいデータの残差を予測できます。残差 + LHM は、値を「正しい」位置に戻します。
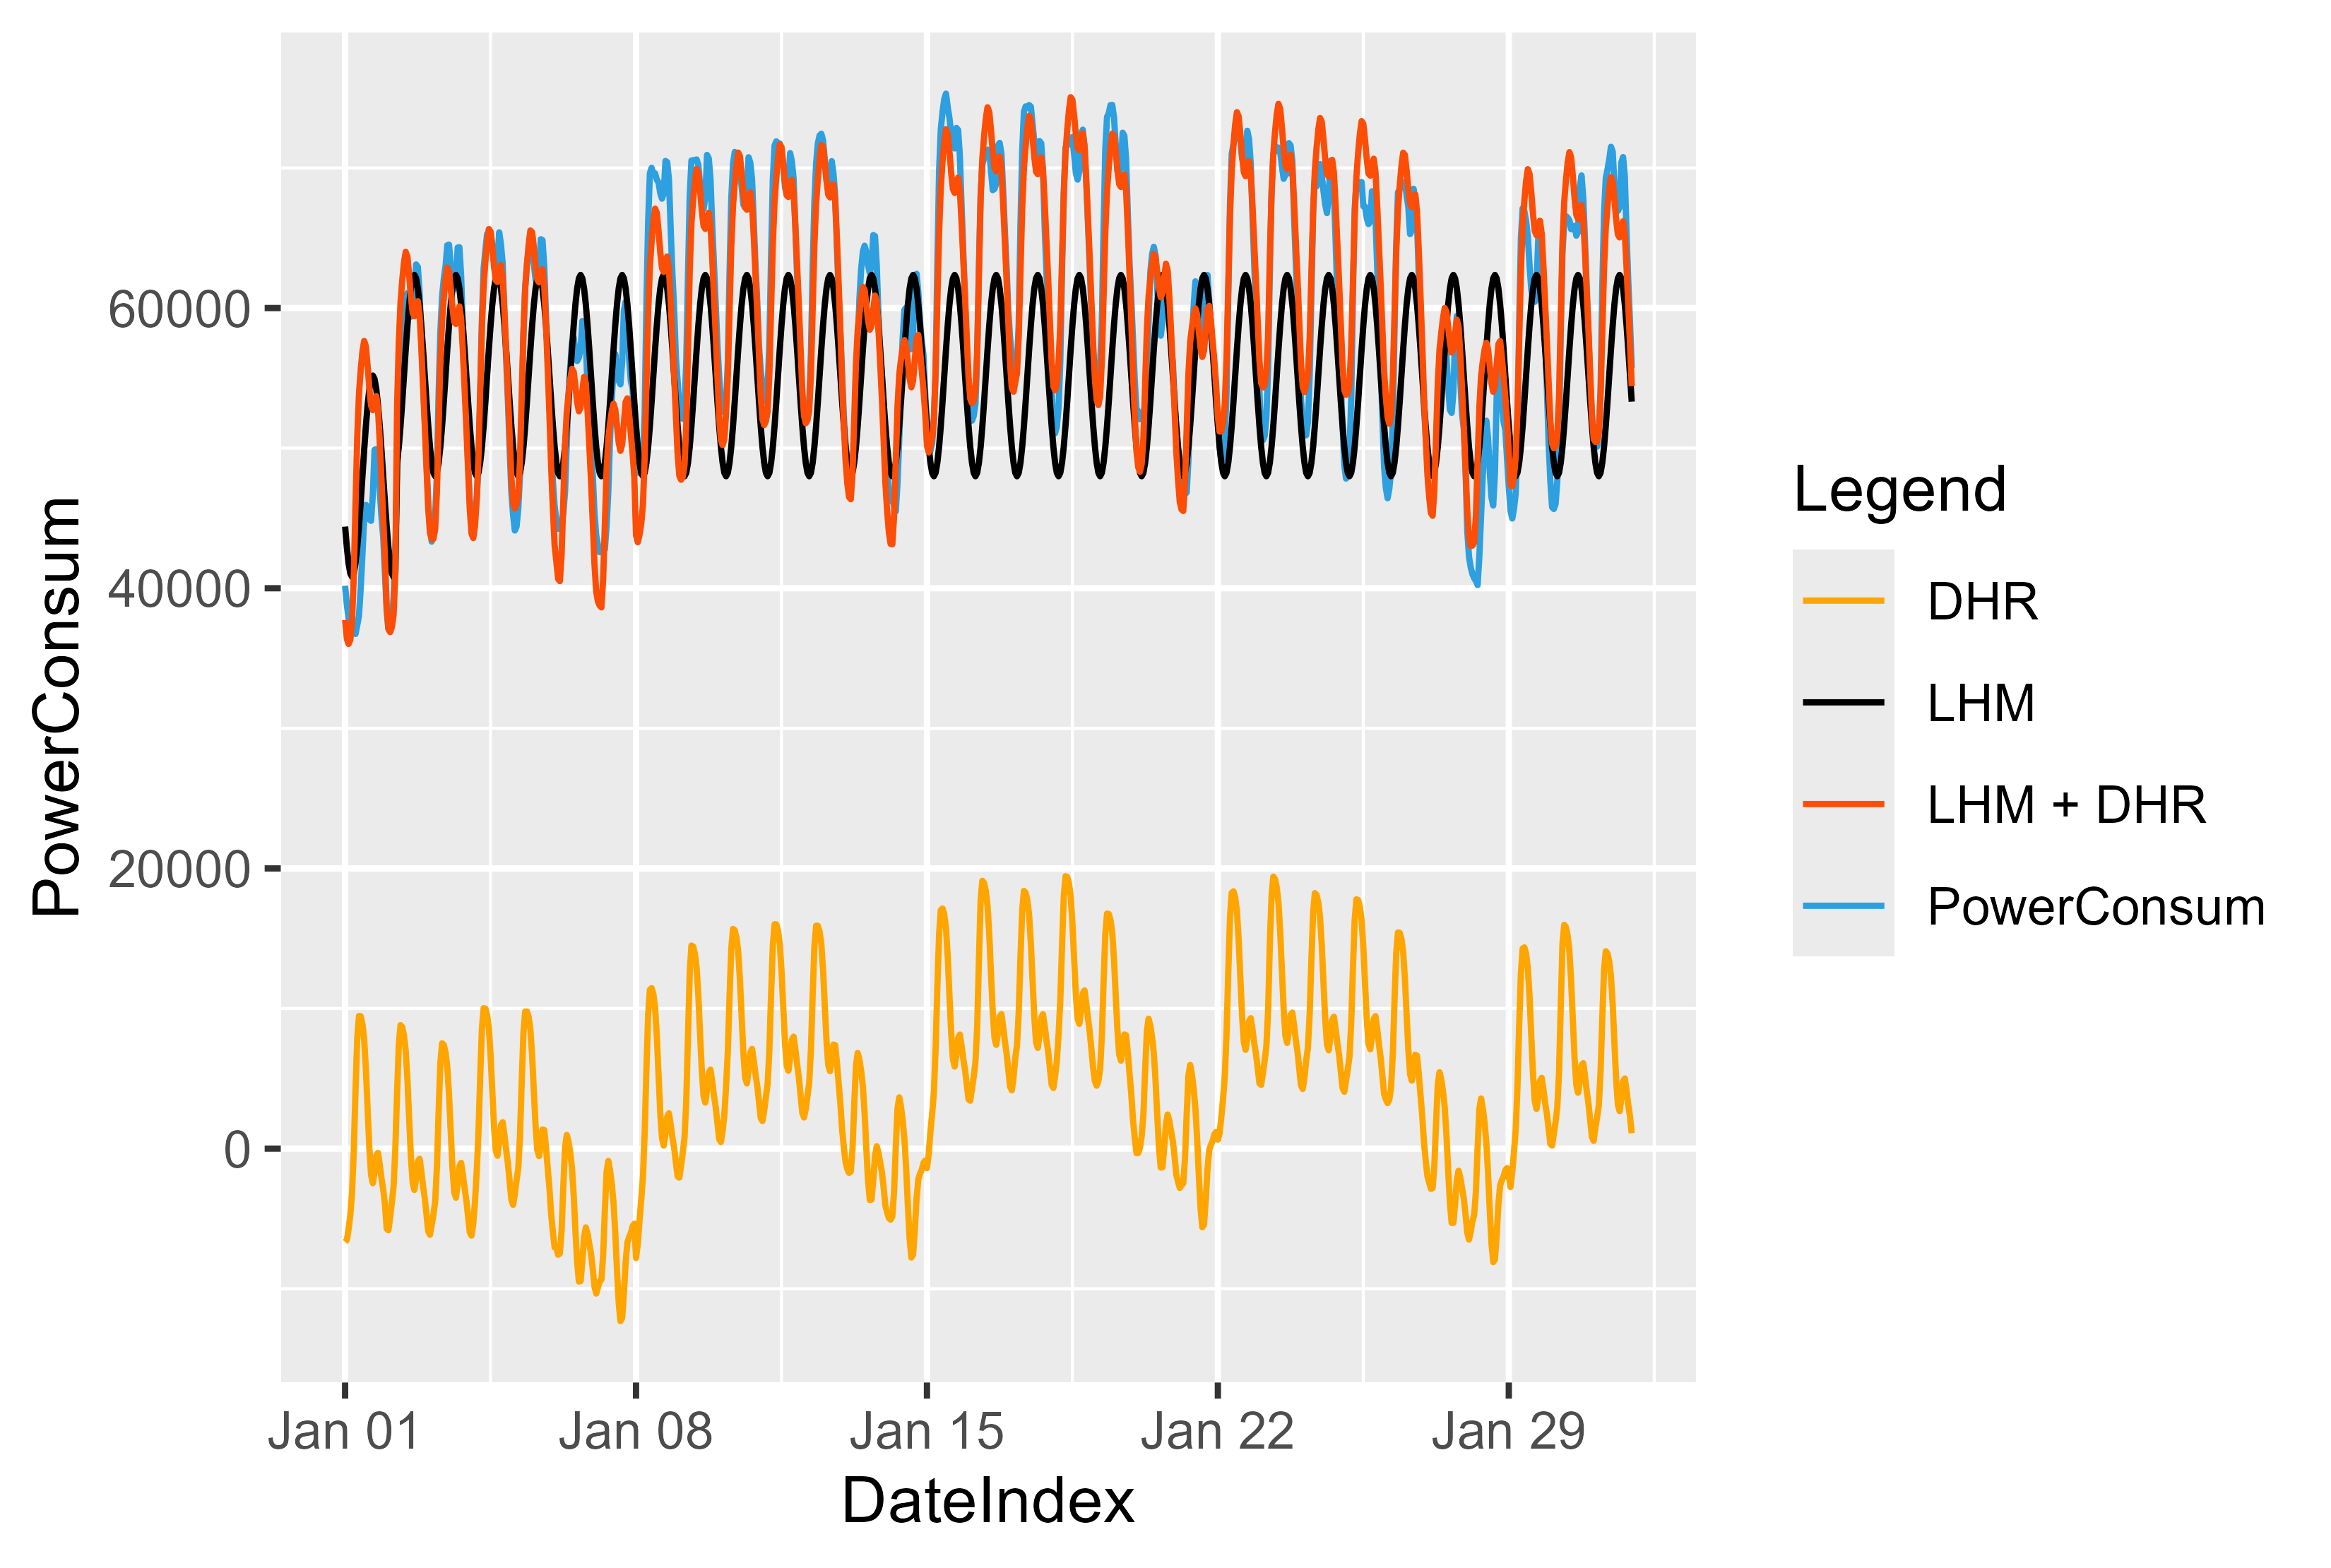 図 13 LHM + DHR モデルの表現
 ensembled_fc <- load_ensembled_models(
  days_to_forecast = 40,
  months_to_forecast = 6,
  year_to_forecast = 2024,
  starting_month = 1,
  real_data = cleaned_power_consum,
  smard_fc = cleaned_smard_pred,
  model_path = "ensemble_model"
)
all_forecasts_ensembled <- ensembled_fc$all_forecasts
raw_fc_ensembled <- ensembled_fc$raw_forecasts

fc <- load_all_model_results(
  days_to_forecast = 40,
  months_to_forecast = 6,
  year_to_forecast = 2024,
  starting_month = 1,
  smard_fc = cleaned_smard_pred,
  real_data = cleaned_power_consum
)

all_forecasts <- fc$combined_forecasts
raw_fc <- fc$raw_forecasts


metric_results <- calculate_metrics(fc_data = all_forecasts, fc_data_ensembled=all_forecasts_ensembled)

# Plot best Model for single Models
name_of_best_model_for_single_model <- plot_forecast(
  all_forecasts = all_forecasts,
  metric_results = metric_results,
  cleaned_power_consum = cleaned_power_consum,
  raw_fc = raw_fc,
  month_to_plot = 1,
  days_to_plot = 40
)

# Plot best Model for ensembled Models
name_of_best_model_ensembled <- plot_forecast_ensembled(
  all_forecasts = all_forecasts_ensembled,
  metric_results = metric_results,
  cleaned_power_consum = cleaned_power_consum,
  month_to_plot = 1,
  days_to_plot = 40
)

# Residuals Compared with SMARD
plot_compare_with_smard(
  all_forecasts = all_forecasts_ensembled,
  name_of_best_model = name_of_best_model_ensembled
  )


# LHM DHM representation
plot_representation_of_lhm_dhm_components(path_dhm = "ensemble_model/version_5/arima_2021_2023.rds",
                                          path_lhm = "ensemble_model/version_5/holiday_effect_2021_2023.rds",
                                          from_month = 1,
                                          to_month = 1,
                                          raw_fc_ensembled = raw_fc_ensembled)
version_5 (LHM + DHR モデル) の MAPE 3.8% という確かなスコア。
ARIMA モデル (arima_14) だけを使用して詳しく見てみましょう。図 14 は、このモデルの結果を表しています。休日(オレンジ)、週末(赤)、通常日(青)が表示されます。 ARIMA モデルにダミー変数があったにもかかわらず、休日を正しく捕捉できなかったために、休日には重大な外れ値が存在します。
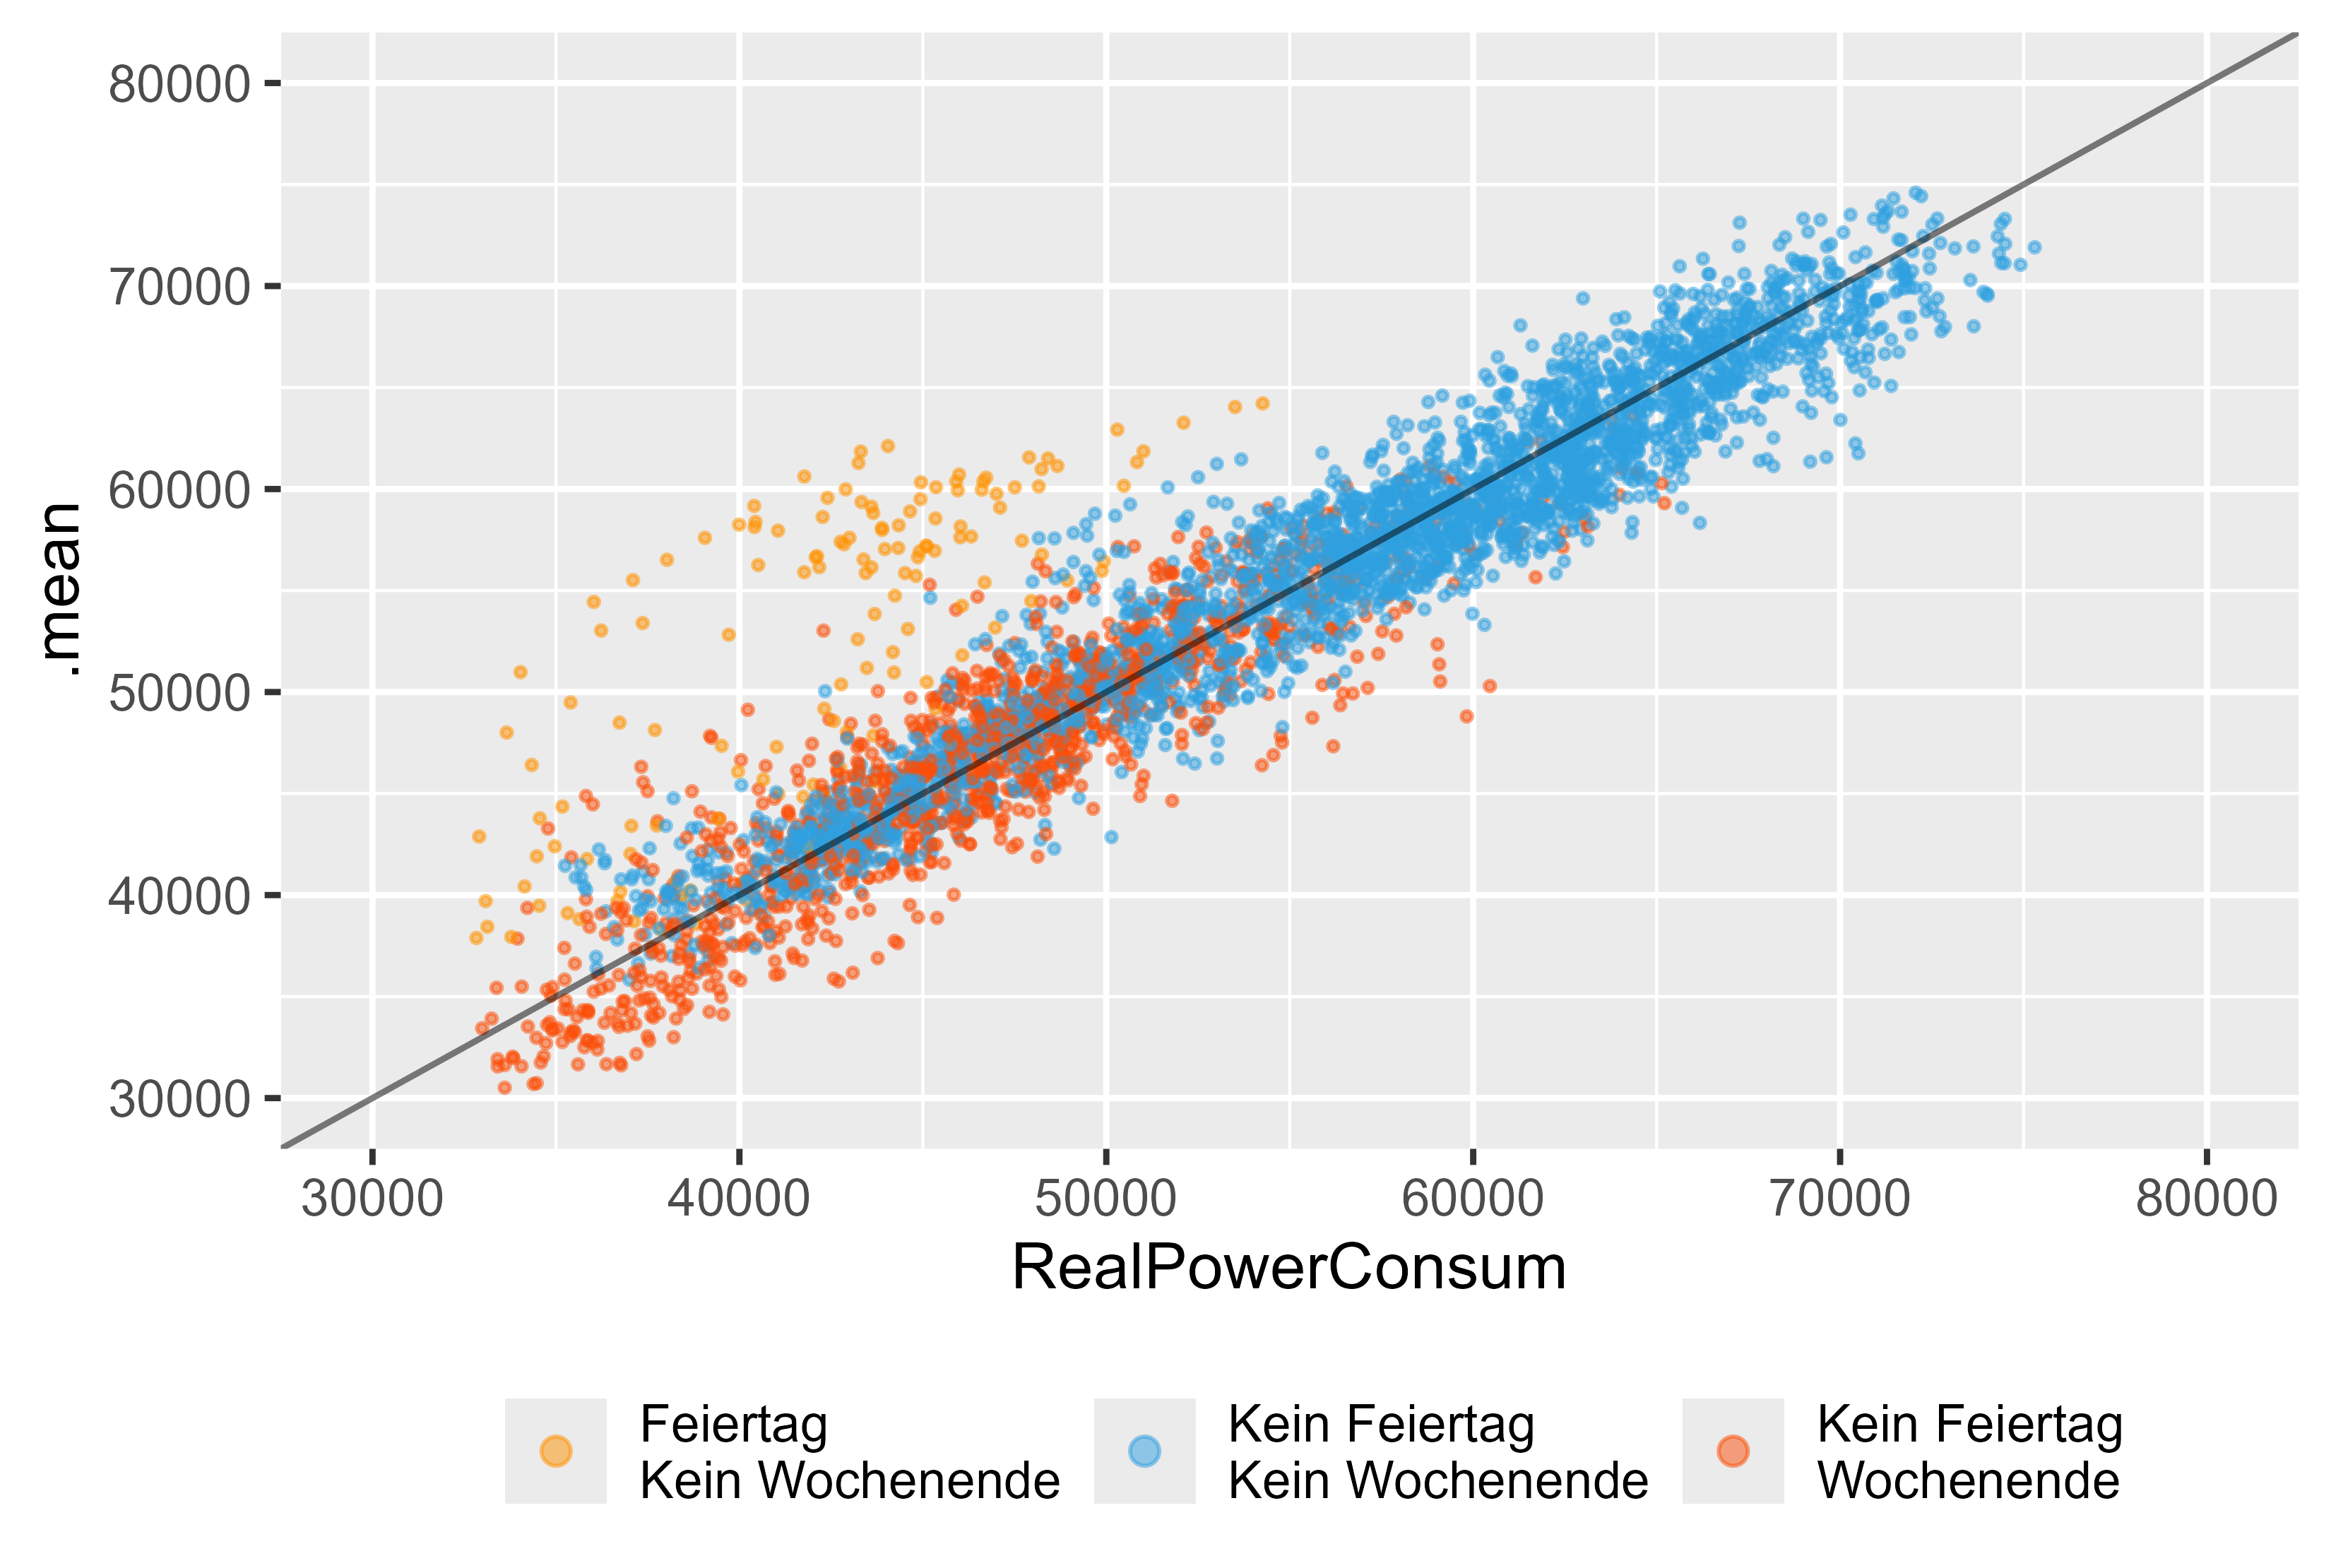 図 14 単一モデルとしての ARIMA (DHR、arima_14) の予測値と実際の値
一方、LHM + DHR モデルは、休日のパフォーマンスが優れています。図 15 はそれを表しています。
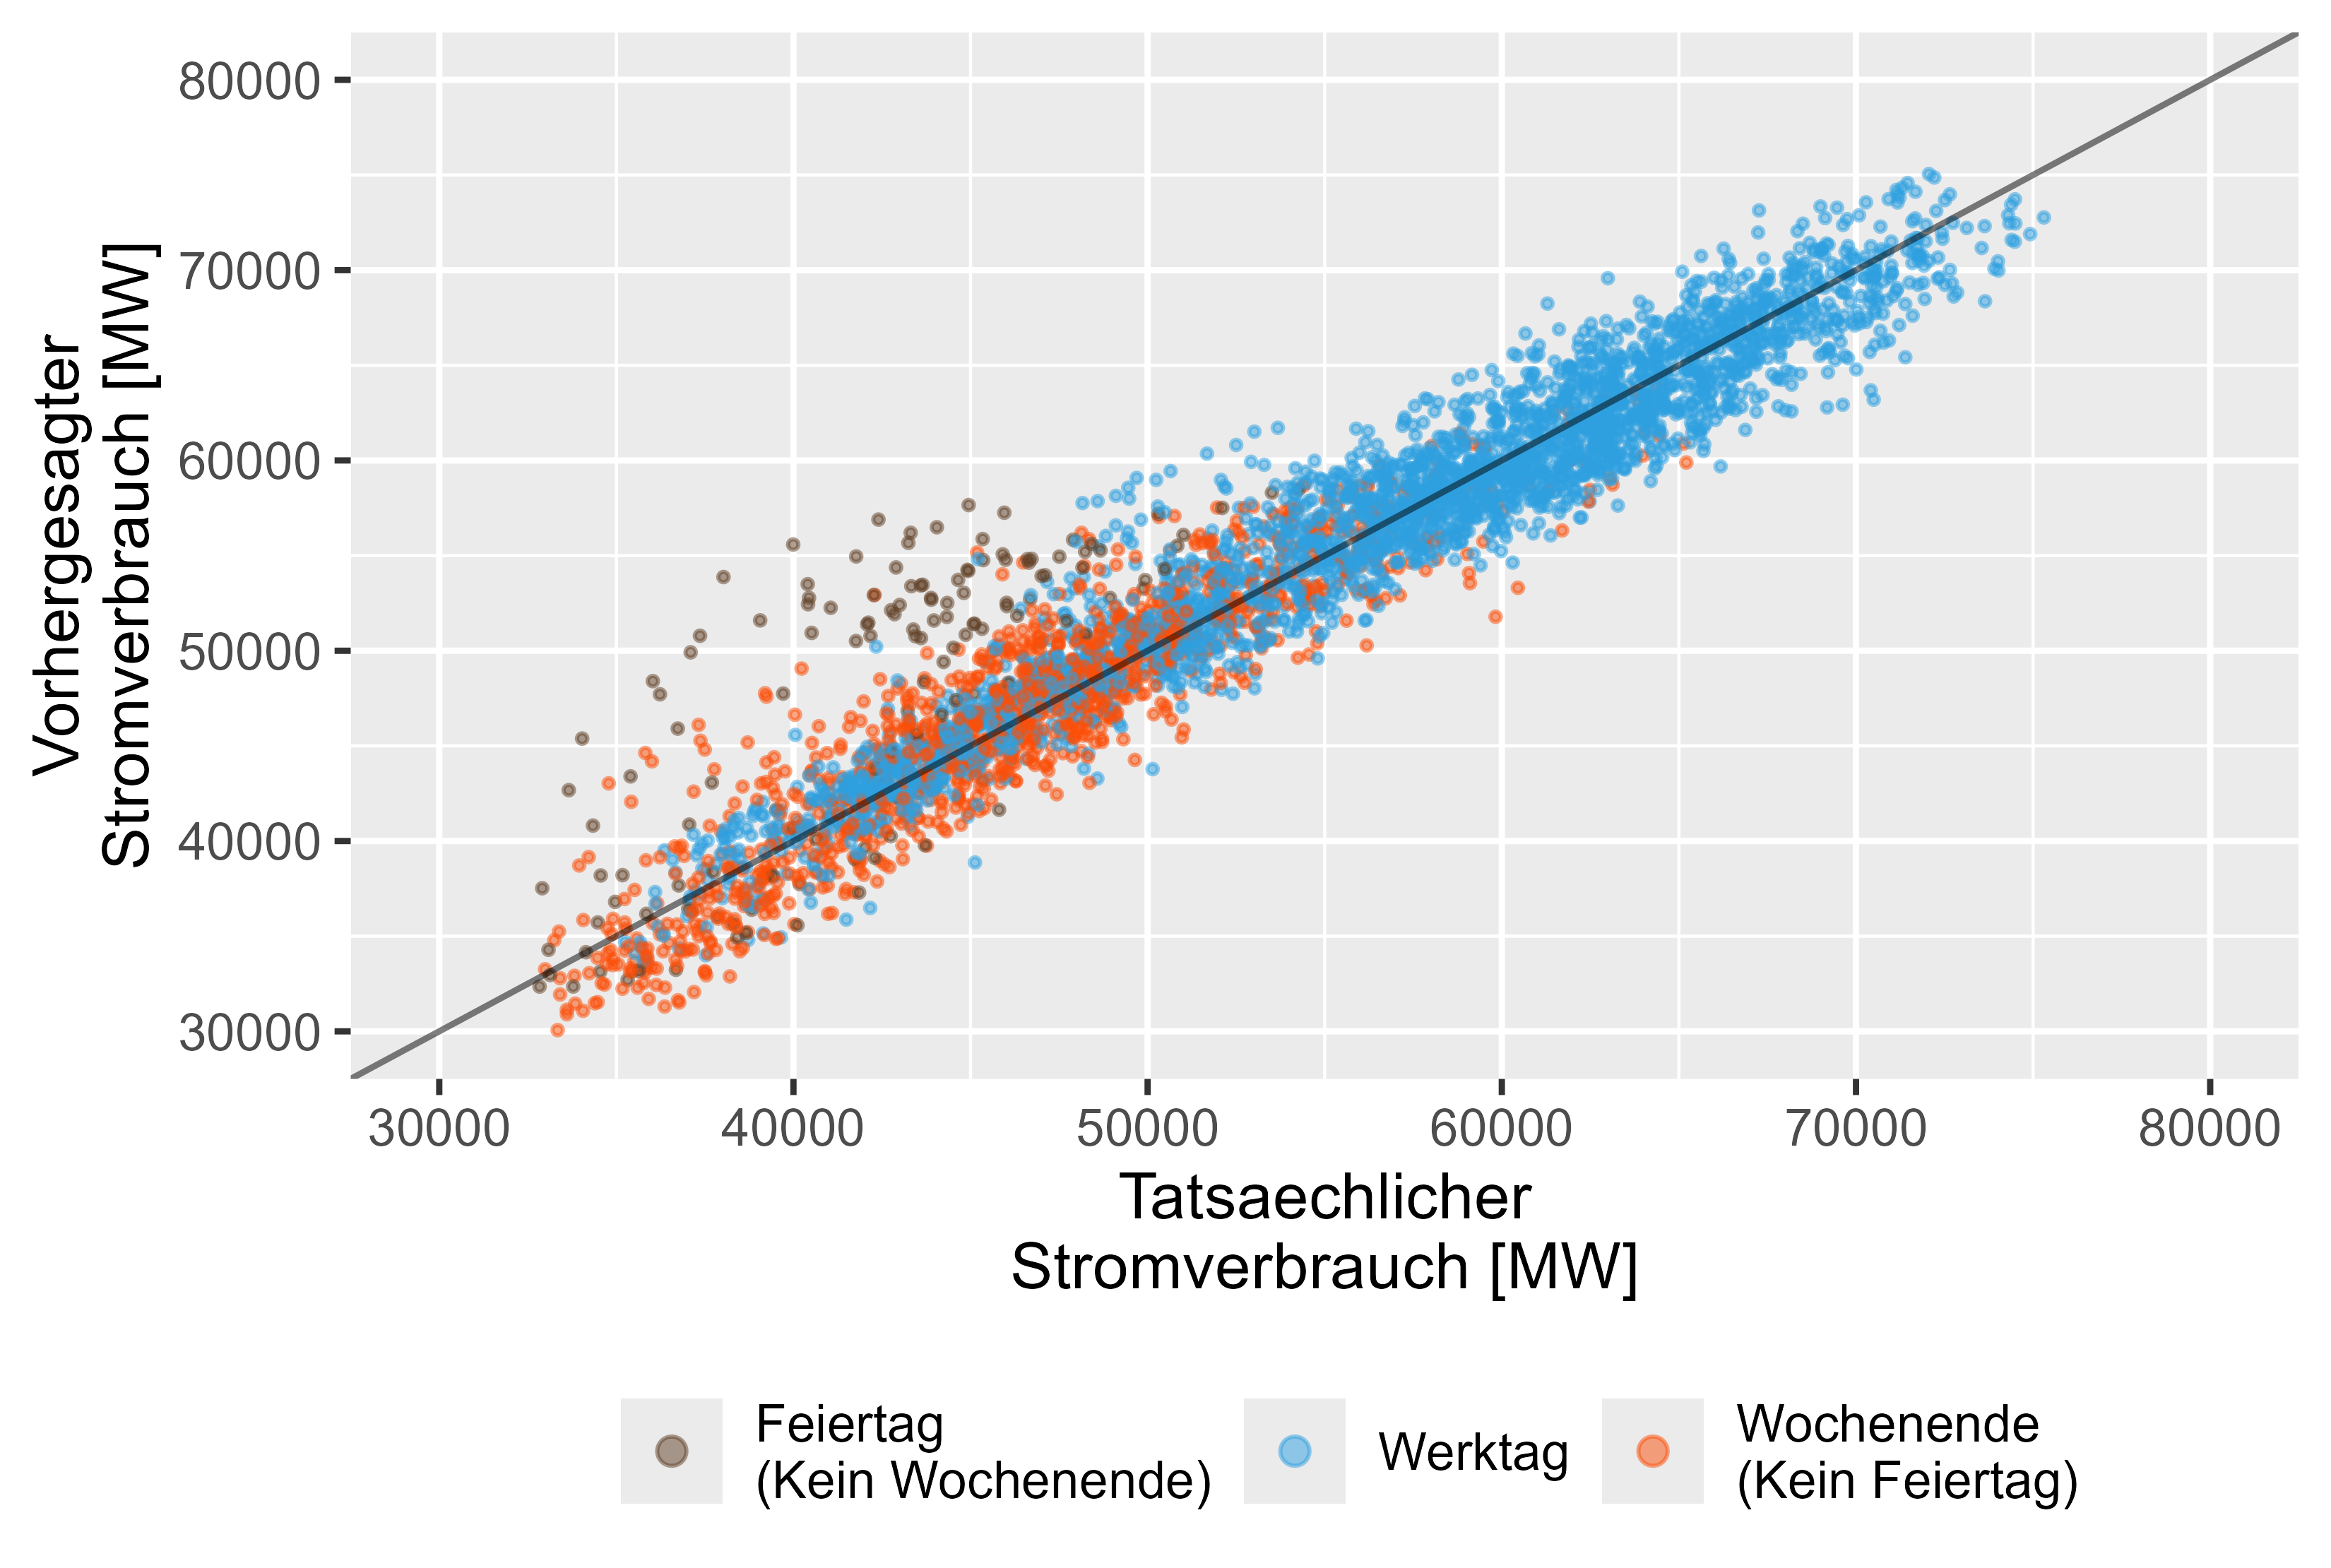 図 15 予測値と実際の値 LHM + DHR、アンサンブル モデル
図 16 は 2024 年 1 月の予測を示しています。これは妥当であるように見えます。
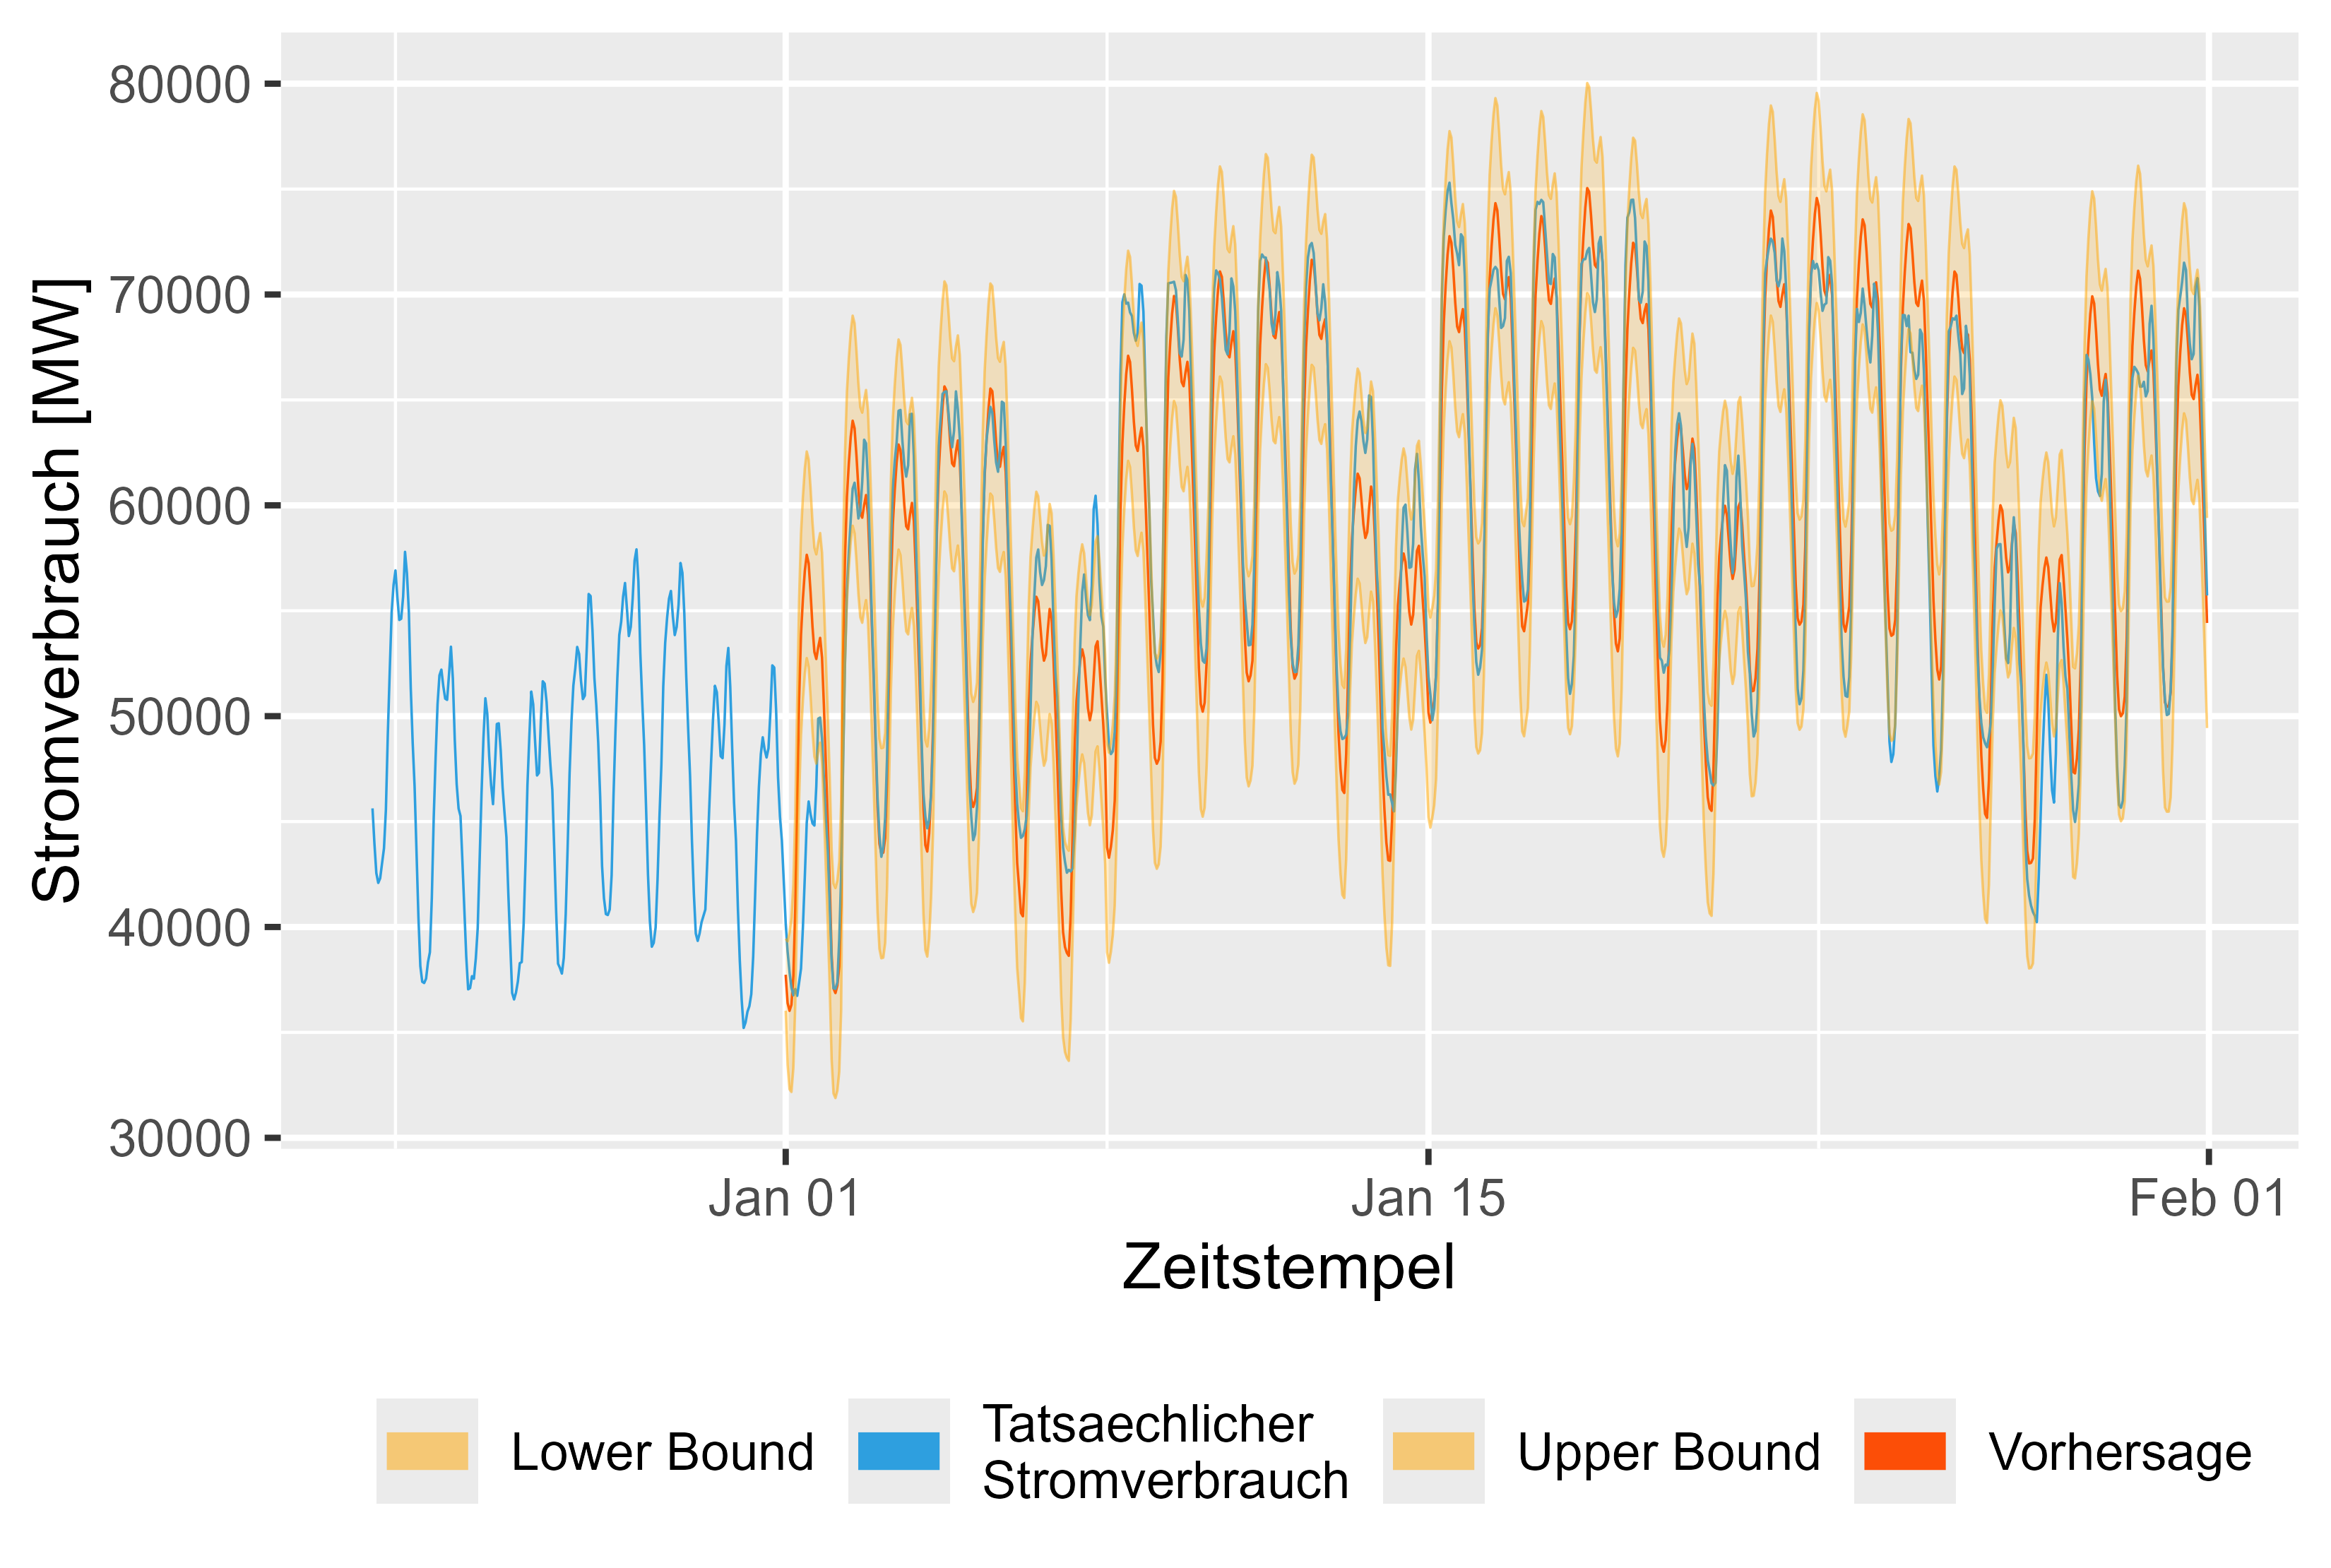 図 16 2024 年 1 月の予測値と実際の値 LHM + DHR
また、SMARD モデルと比較したモデルの残差も良好に見えます。スパイクはほとんどありませんが、重大である可能性があり、モデリングによってより適切に準備できる可能性があります。しかし、全体的には堅実な結果でした。
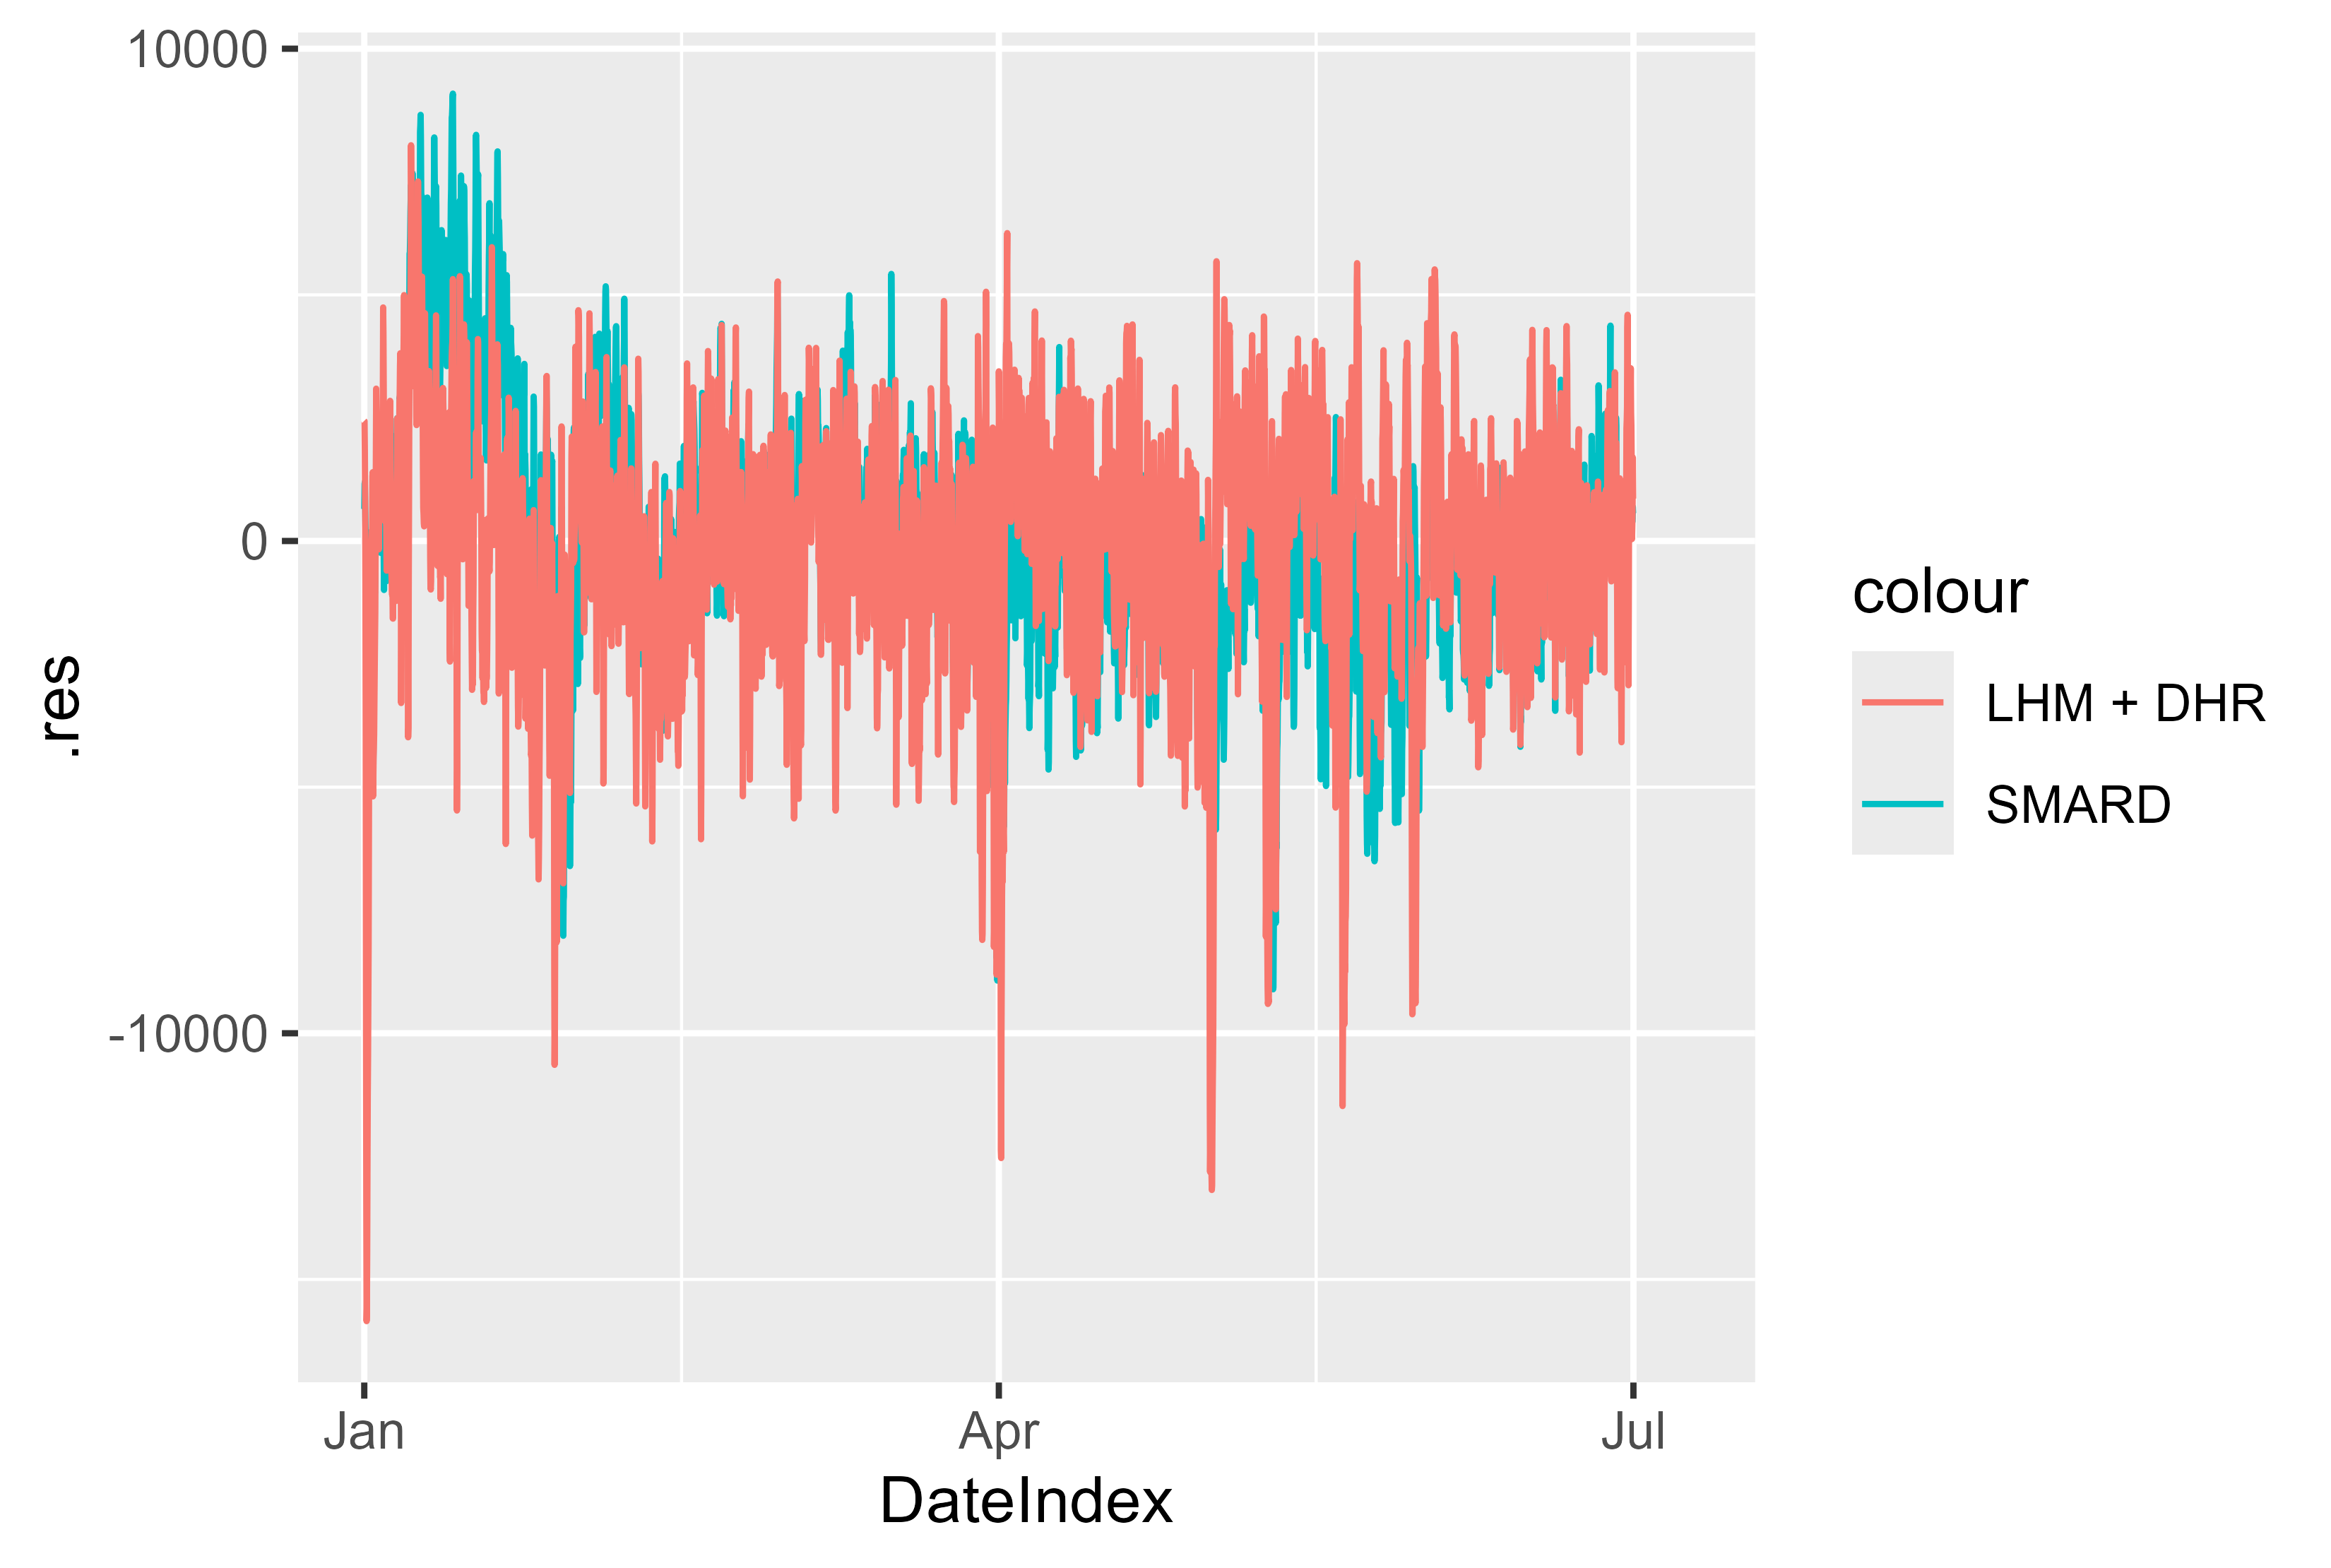 図 17 2024 年 1 月から 7 月までの残差 LHM + DHR
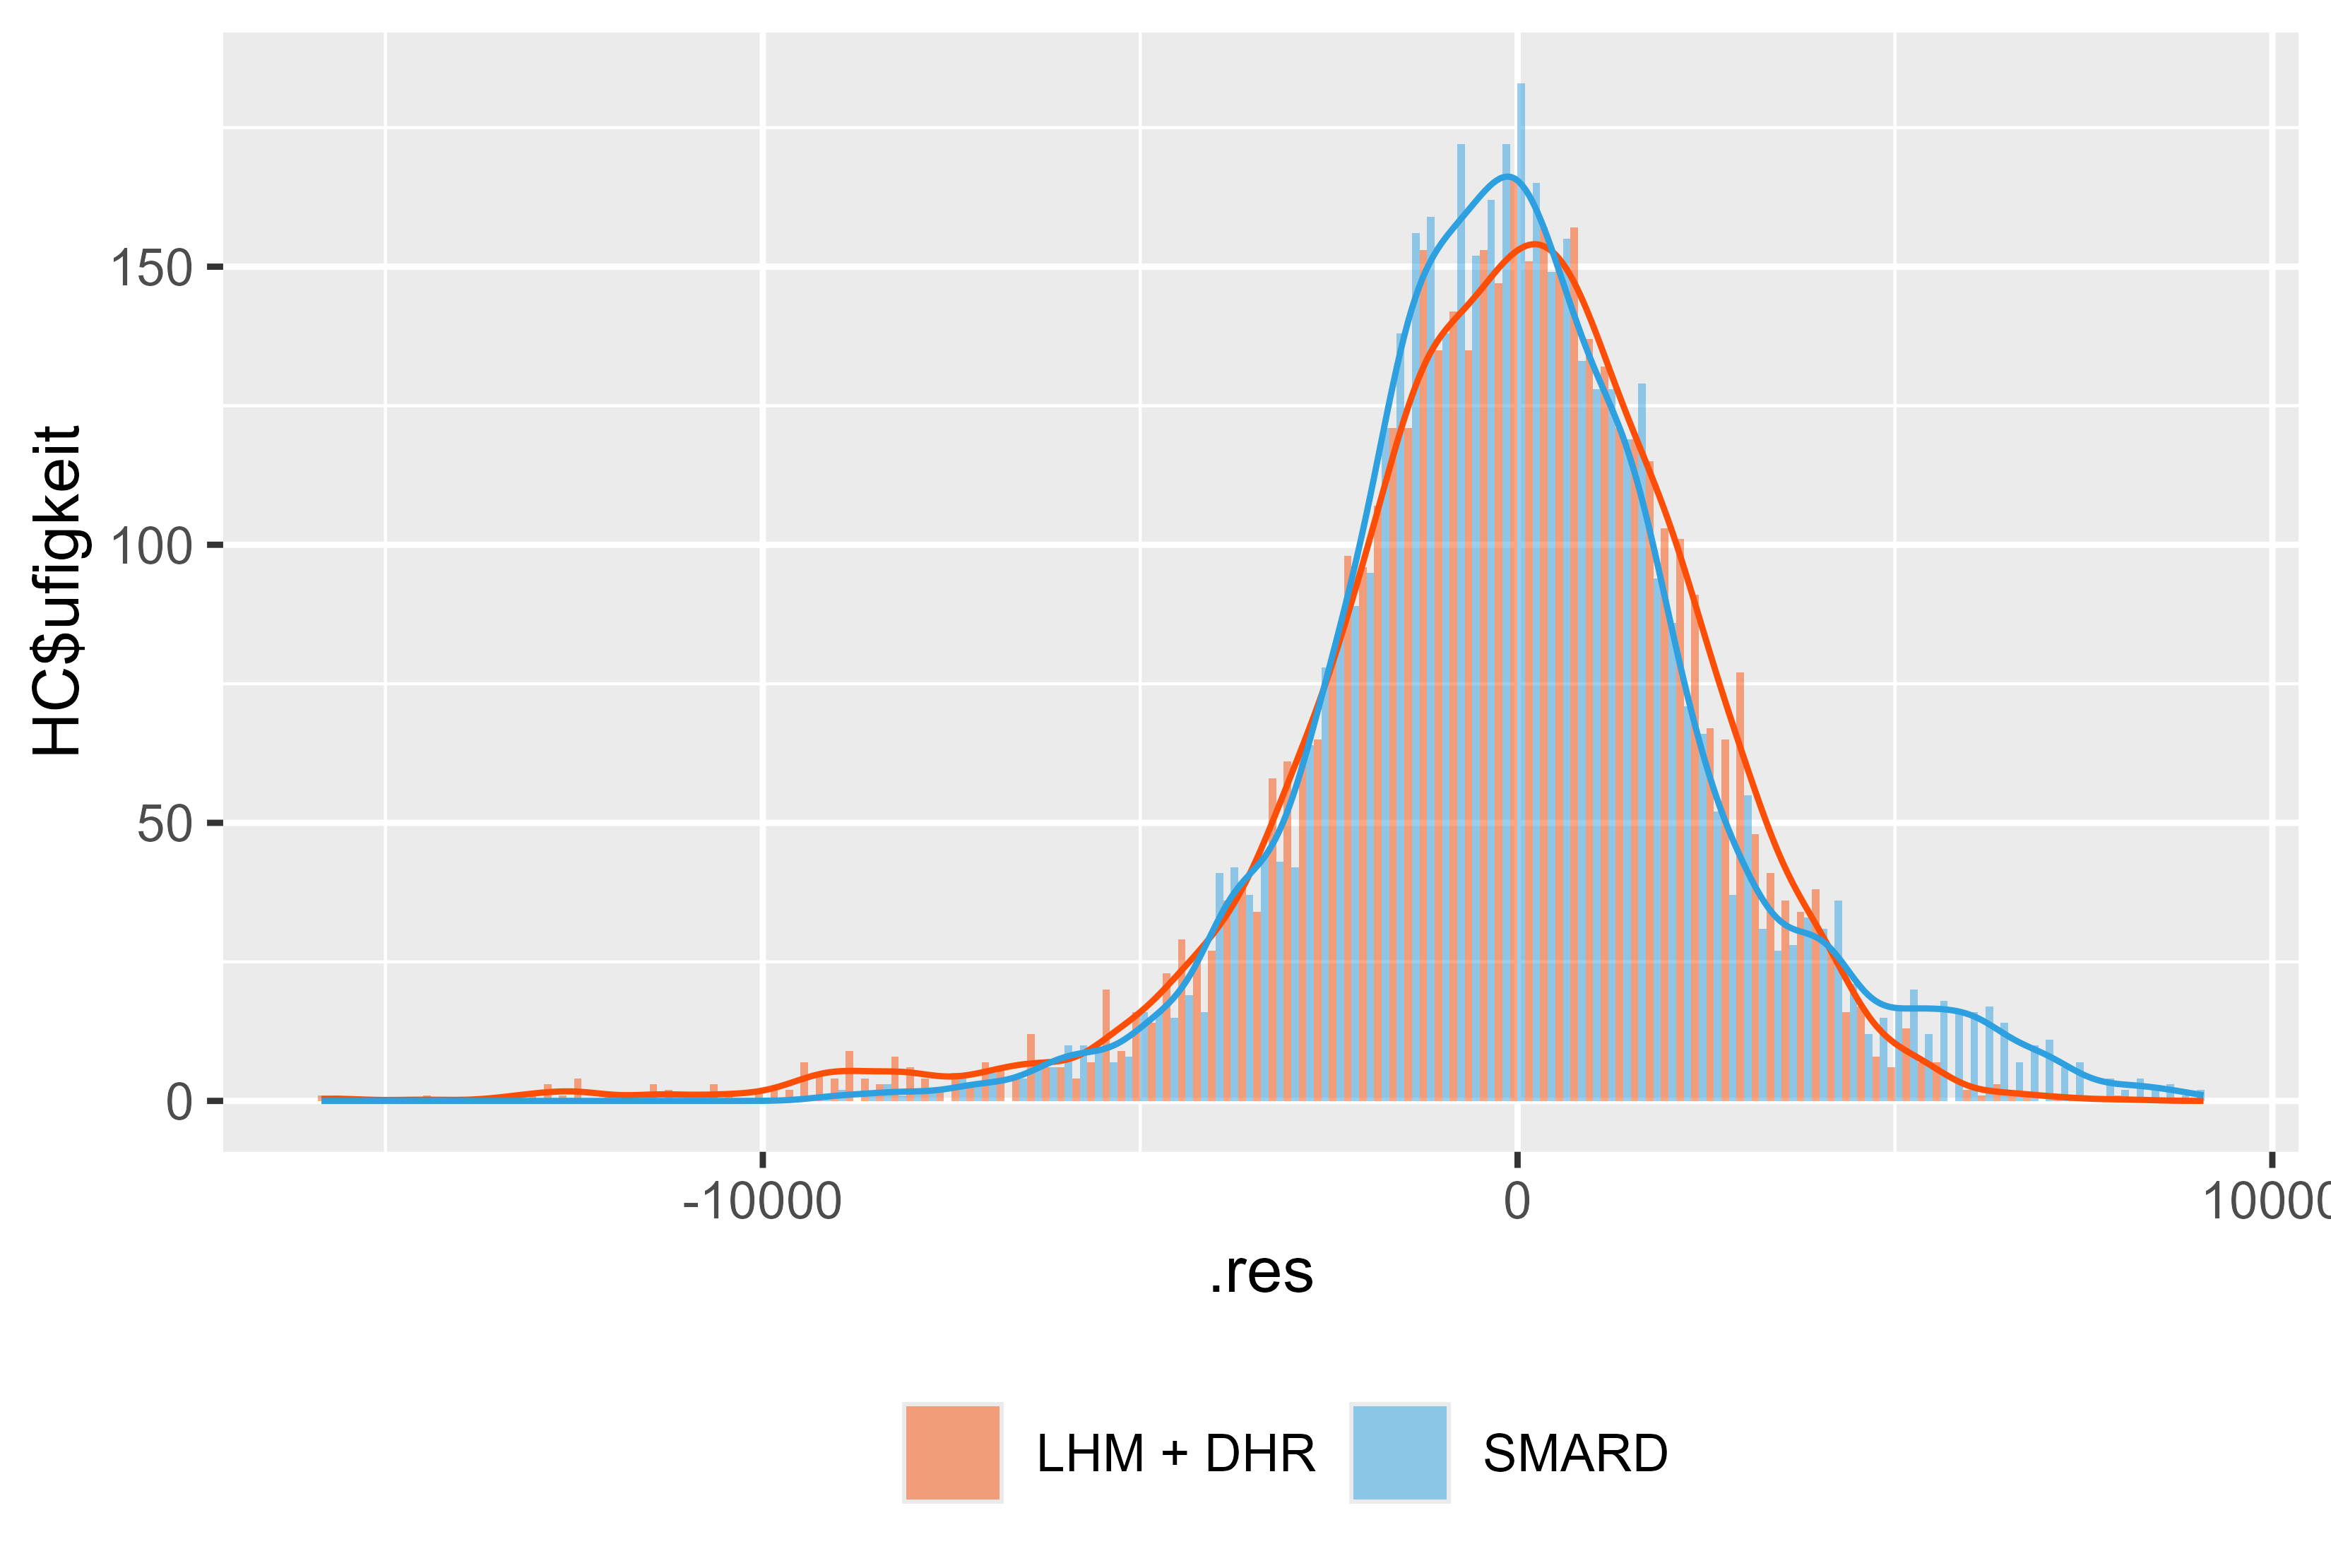 図 18 2024 年 1 月から 7 月までの残差 LHM + DHR
| 索引 | モデル名 | RMSE | メイプ | 前 | アンサンブル |
|---|---|---|---|---|---|
| 2 | 実観察 | 0.000 | 0.000000 | 0.000 | 真実 |
| 3 | スマッド | 2480.693 | 3.602140 | 1869.466 | 間違い |
| 4 | スマッド | 2480.693 | 3.602140 | 1869.466 | 真実 |
| 5 | バージョン_5 | 2626.807 | 3.816012 | 1937.670 | 真実 |
| 6 | バージョン_0 | 2613.258 | 3.846888 | 1946.314 | 真実 |
| 7 | バージョン_7 | 2770.359 | 4.107272 | 2076.045 | 真実 |
| 8 | バージョン_8 | 2775.441 | 4.146788 | 2091.153 | 真実 |
| 9 | バージョン_9 | 2887.179 | 4.177841 | 2100.381 | 真実 |
| 10 | バージョン_6 | 2906.242 | 4.216517 | 2142.092 | 真実 |
| 11 | arima_14_2021_2023.rds | 3208.735 | 4.389492 | 2207.395 | 間違い |
| 12 | arima_18_2021_2023.rds | 3208.735 | 4.389492 | 2207.395 | 間違い |
| 13 | バージョン_4 | 2875.929 | 4.535388 | 2255.645 | 真実 |
| 14 | バージョン_2 | 2905.990 | 4.580770 | 2279.624 | 真実 |
| 15 | arima_9_2021_2023.rds | 3267.160 | 4.611857 | 2302.918 | 間違い |
| 16 | arima_2_2021_2023.rds | 3251.390 | 4.614028 | 2301.447 | 間違い |
| 17 | arima_4_2021_2023.rds | 3251.390 | 4.614028 | 2301.447 | 間違い |
| 18 | arima_5_2021_2023.rds | 3251.390 | 4.614028 | 2301.447 | 間違い |
| 19 | arima_13_2021_2023.rds | 3283.745 | 4.619636 | 2307.415 | 間違い |
| 20 | arima_10_2021_2023.rds | 3265.913 | 4.625508 | 2314.395 | 間違い |
| 21 | arima_0_2021_2023.rds | 3269.009 | 4.645944 | 2317.138 | 間違い |
| 22 | arima_17_2021_2023.rds | 3269.009 | 4.645944 | 2317.138 | 間違い |
| 23 | arima_16_2021_2023.rds | 3298.902 | 4.673116 | 2334.857 | 間違い |
| 24 | arima_1_2021_2023.rds | 3312.429 | 4.696342 | 2340.193 | 間違い |
| 24 | prophet_0_2021_2023.rds | 3044.849 | 4.711527 | 2435.572 | 間違い |
| 25 | arima_8_2021_2023.rds | 3332.217 | 4.716612 | 2358.085 | 間違い |
| 26 | arima_11_2021_2023.rds | 3358.020 | 4.758970 | 2388.791 | 間違い |
| 27 | arima_12_2021_2023.rds | 3430.191 | 5.022772 | 2495.067 | 間違い |
| 28 | arima_7_2021_2023.rds | 3475.671 | 5.049287 | 2510.903 | 間違い |
| 29 | バージョン_3 | 3546.729 | 5.064654 | 2570.530 | 真実 |
| 30 | arima_15_2021_2023.rds | 3734.584 | 5.165147 | 2606.661 | 間違い |
| 31 | arima_6_2021_2023.rds | 3748.583 | 5.375326 | 2723.837 | 間違い |
| 32 | バージョン_1 | 4495.568 | 6.483477 | 3229.647 | 真実 |
| 33 | arima_3_2021_2023.rds | 4558.982 | 6.953247 | 3453.387 | 間違い |
| 34 | tslm_0_2021_2023.rds | 6760.994 | 11.189119 | 5694.949 | 間違い |
| 35 | 平均_2021_2023.rds | 9489.303 | 16.406032 | 8101.476 | 間違い |
| 36 | naive_2021_2023.rds | 14699.338 | 20.797370 | 12130.587 | 間違い |
| 37 | ドリフト_2021_2023.rds | 14763.692 | 20.917883 | 12200.002 | 間違い |
注記:
example/ensemble_model_2022_forecast または example/ensemble_model_2023_forecast を確認してください。
次のような要素をさらに含めることもできます。