중요한
이 프로젝트에 관심을 가져 주셔서 감사합니다. 그러나이 저장소는 더 이상 유지 관리되지 않습니다 .
중요한 요구에 대해서는 저장소를 포킹하고 직접 업데이트하는 것을 고려하십시오.
경고
나는이 패키지에 액세스하는 데이터의 유효성과 무결성에 대해 중대한 우려가 있습니다. 나는이 도구를 사용할 때 극도로주의와 회의론을 행사하고 그들의 작업에 대한 대체 출처를 찾도록 촉구합니다.
이것은입니다 공식적인 [참고 : 나는 더 이상 세계 불평등 실험실과 제휴하지 않으며 미래에 명령이 기능적으로 유지 될 것이라는 보장을 제공 할 수 없다] Stata는 세계 불평등 데이터베이스 (wid.world)의 STATA 명령. 사용자는 wid.world에서 Stata로 직접 데이터를 다운로드 할 수 있습니다.
사용자는 SSC에서 직접 명령을 설치해야합니다.
ssc install wid명령 문서는 다음을 사용하여 설치 후 사용할 수 있습니다.
help wid프랑스의 장기 진화 부 불평등을 계획하십시오.
wid, indicators(shweal) areas(FR) perc(p90p100 p99p100) ages(992) pop(j) clear

// Reshape and plot
reshape wide value, i(year) j(percentile) string
label variable valuep90p100 " Top 10% share "
label variable valuep99p100 " Top 1% share "

graph twoway line value * year, title( " Wealth inequality in France " ) ///
	ylabel(0.2 " 20% " 0.4 " 40% " 0.6 " 60% " 0.8 " 80% " ) ///
	subtitle( " equal-split adults " ) ///
	note( " Source: WID.world " )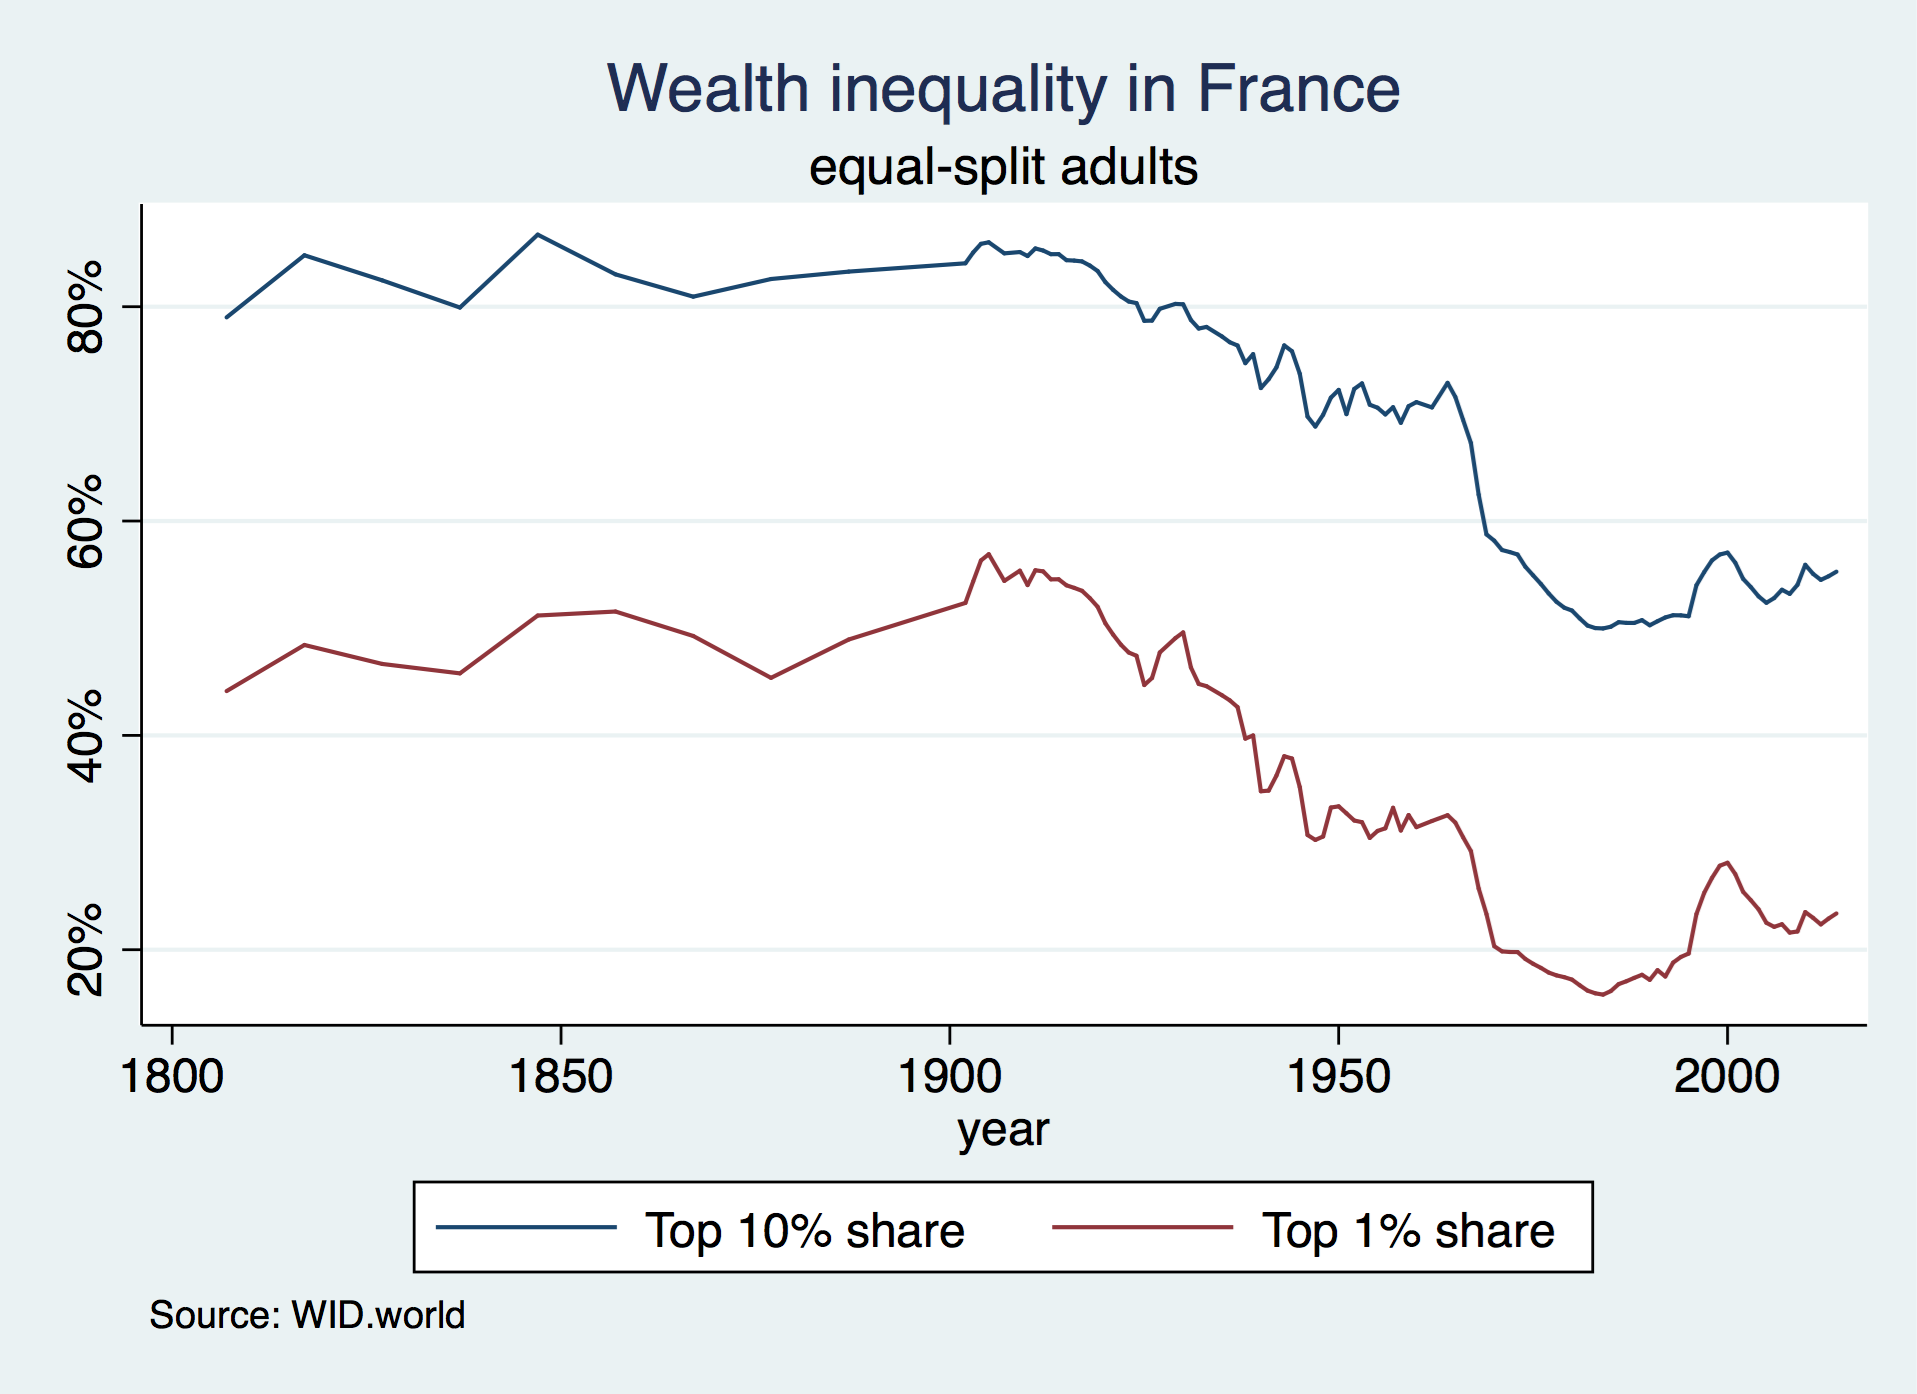
1978 년부터 중국, 프랑스 및 미국 인구의 최하위 50%의 세후 국민 소득의 진화 (로그 규모) :
 // Download and store the 2017 USD PPP exchange rate
wid, indicators(xlcusp) areas(FR US CN) year(2017) clear
rename value ppp
tempfile ppp
save " `ppp' "

wid, indicators(aptinc) areas(FR US CN) perc(p0p50) year(1978 / 2017) ages(992) pop(j) clear
merge n:1 country using " `ppp' " , nogenerate

// Convert to 2017 USD PPP (thousands)
replace value = value/ppp/1000

// Reshape and plot
keep country year value
reshape wide value, i(year) j(country) string
label variable valueFR " France "
label variable valueUS " United States "
label variable valueCN " China "

graph twoway line value * year, yscale(log) ylabel(1 2 5 10 20) ///
	ytitle( " 2017 PPP USD (000's) " ) ///
	title( " Average pre-tax national income of the bottom 50% " ) subtitle( " equal-split adults " ) ///
	note( " Source: WID.world " ) legend(rows(1))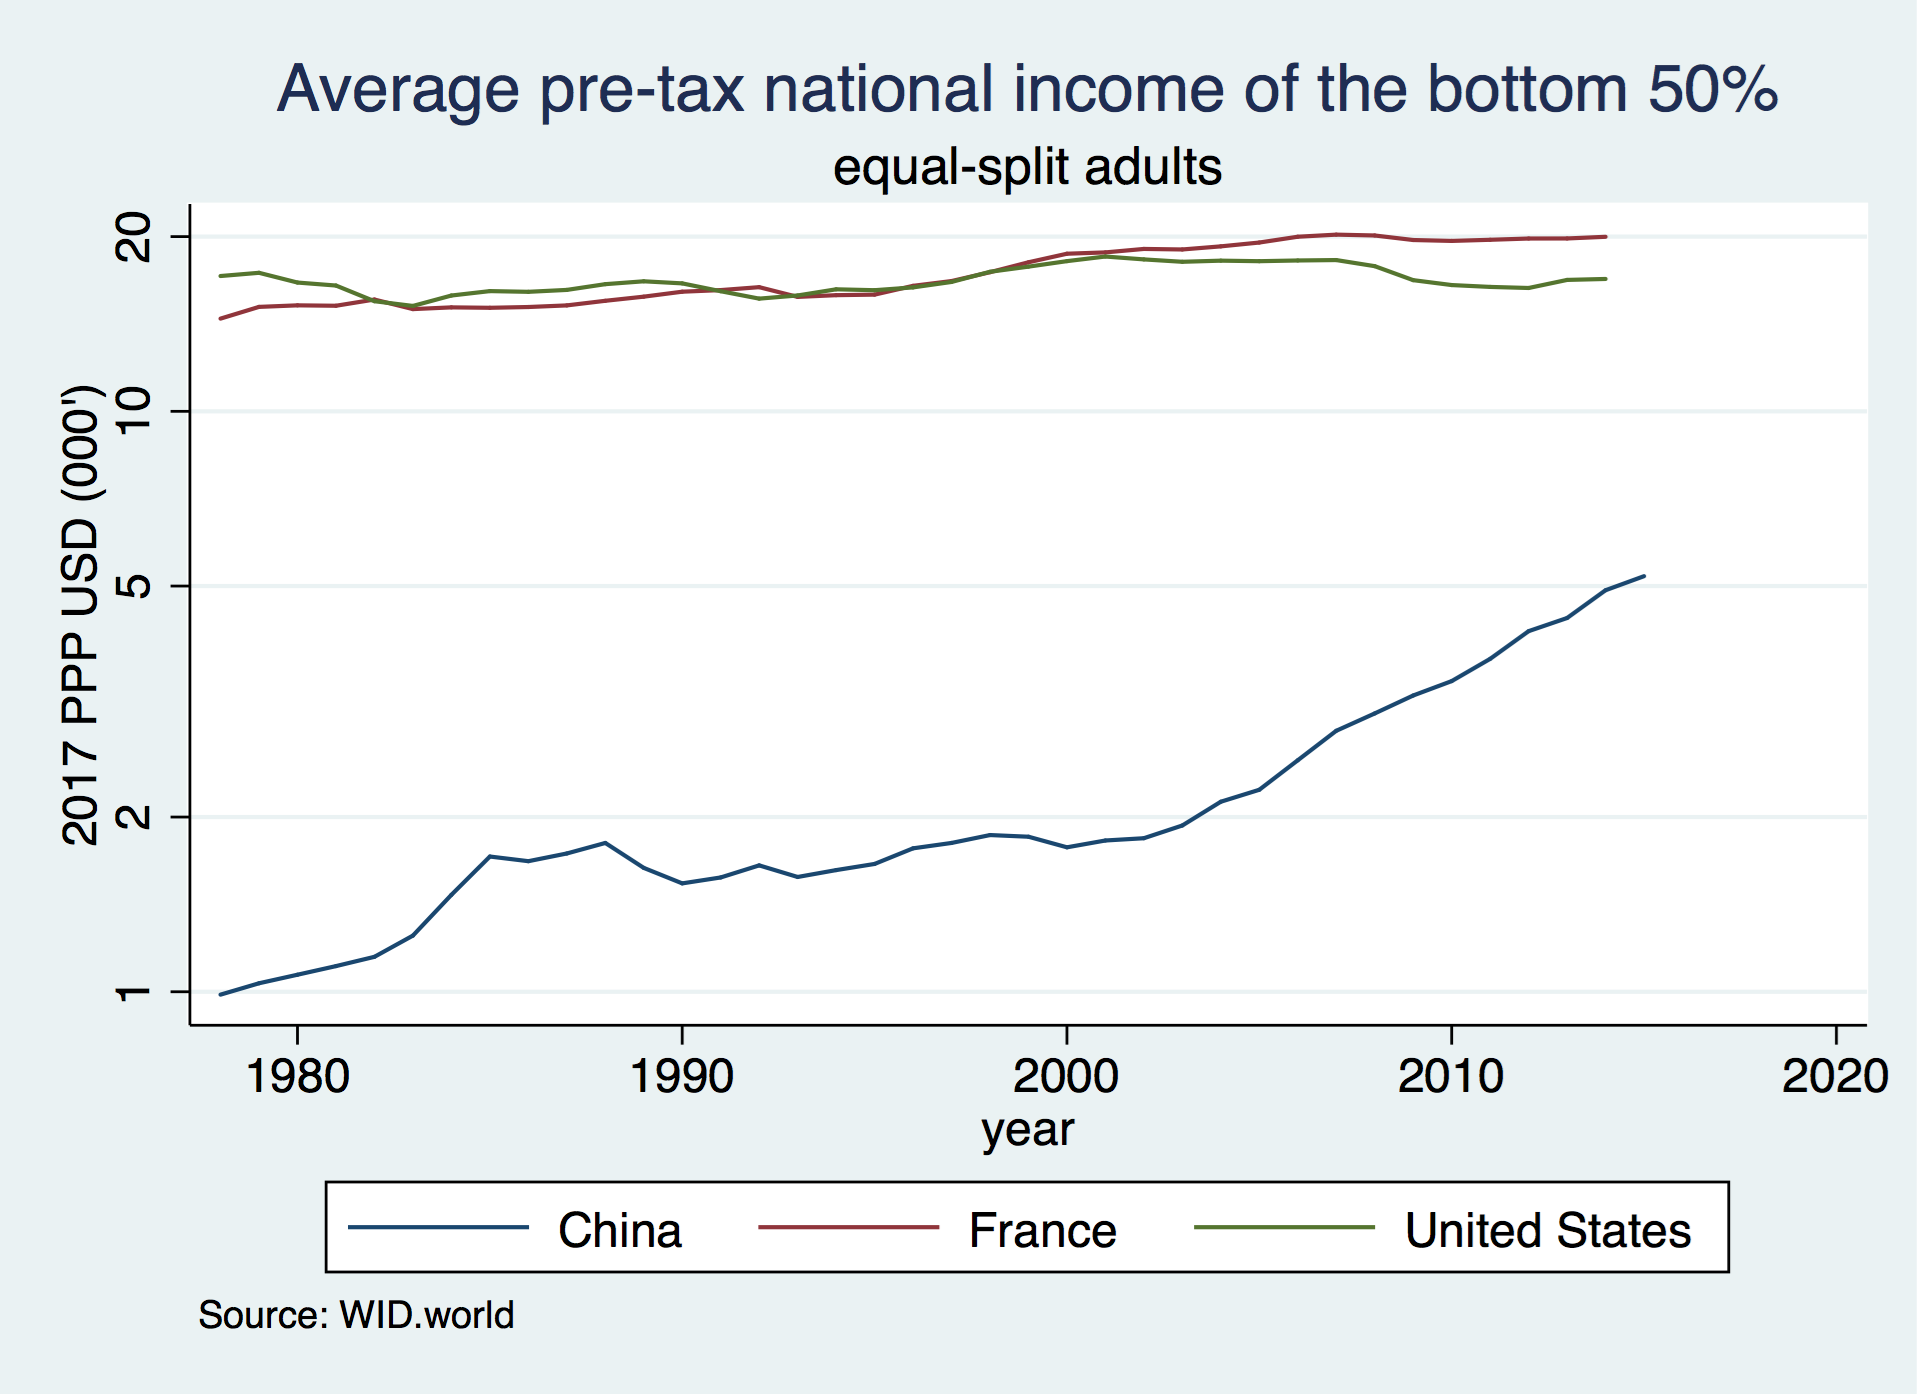
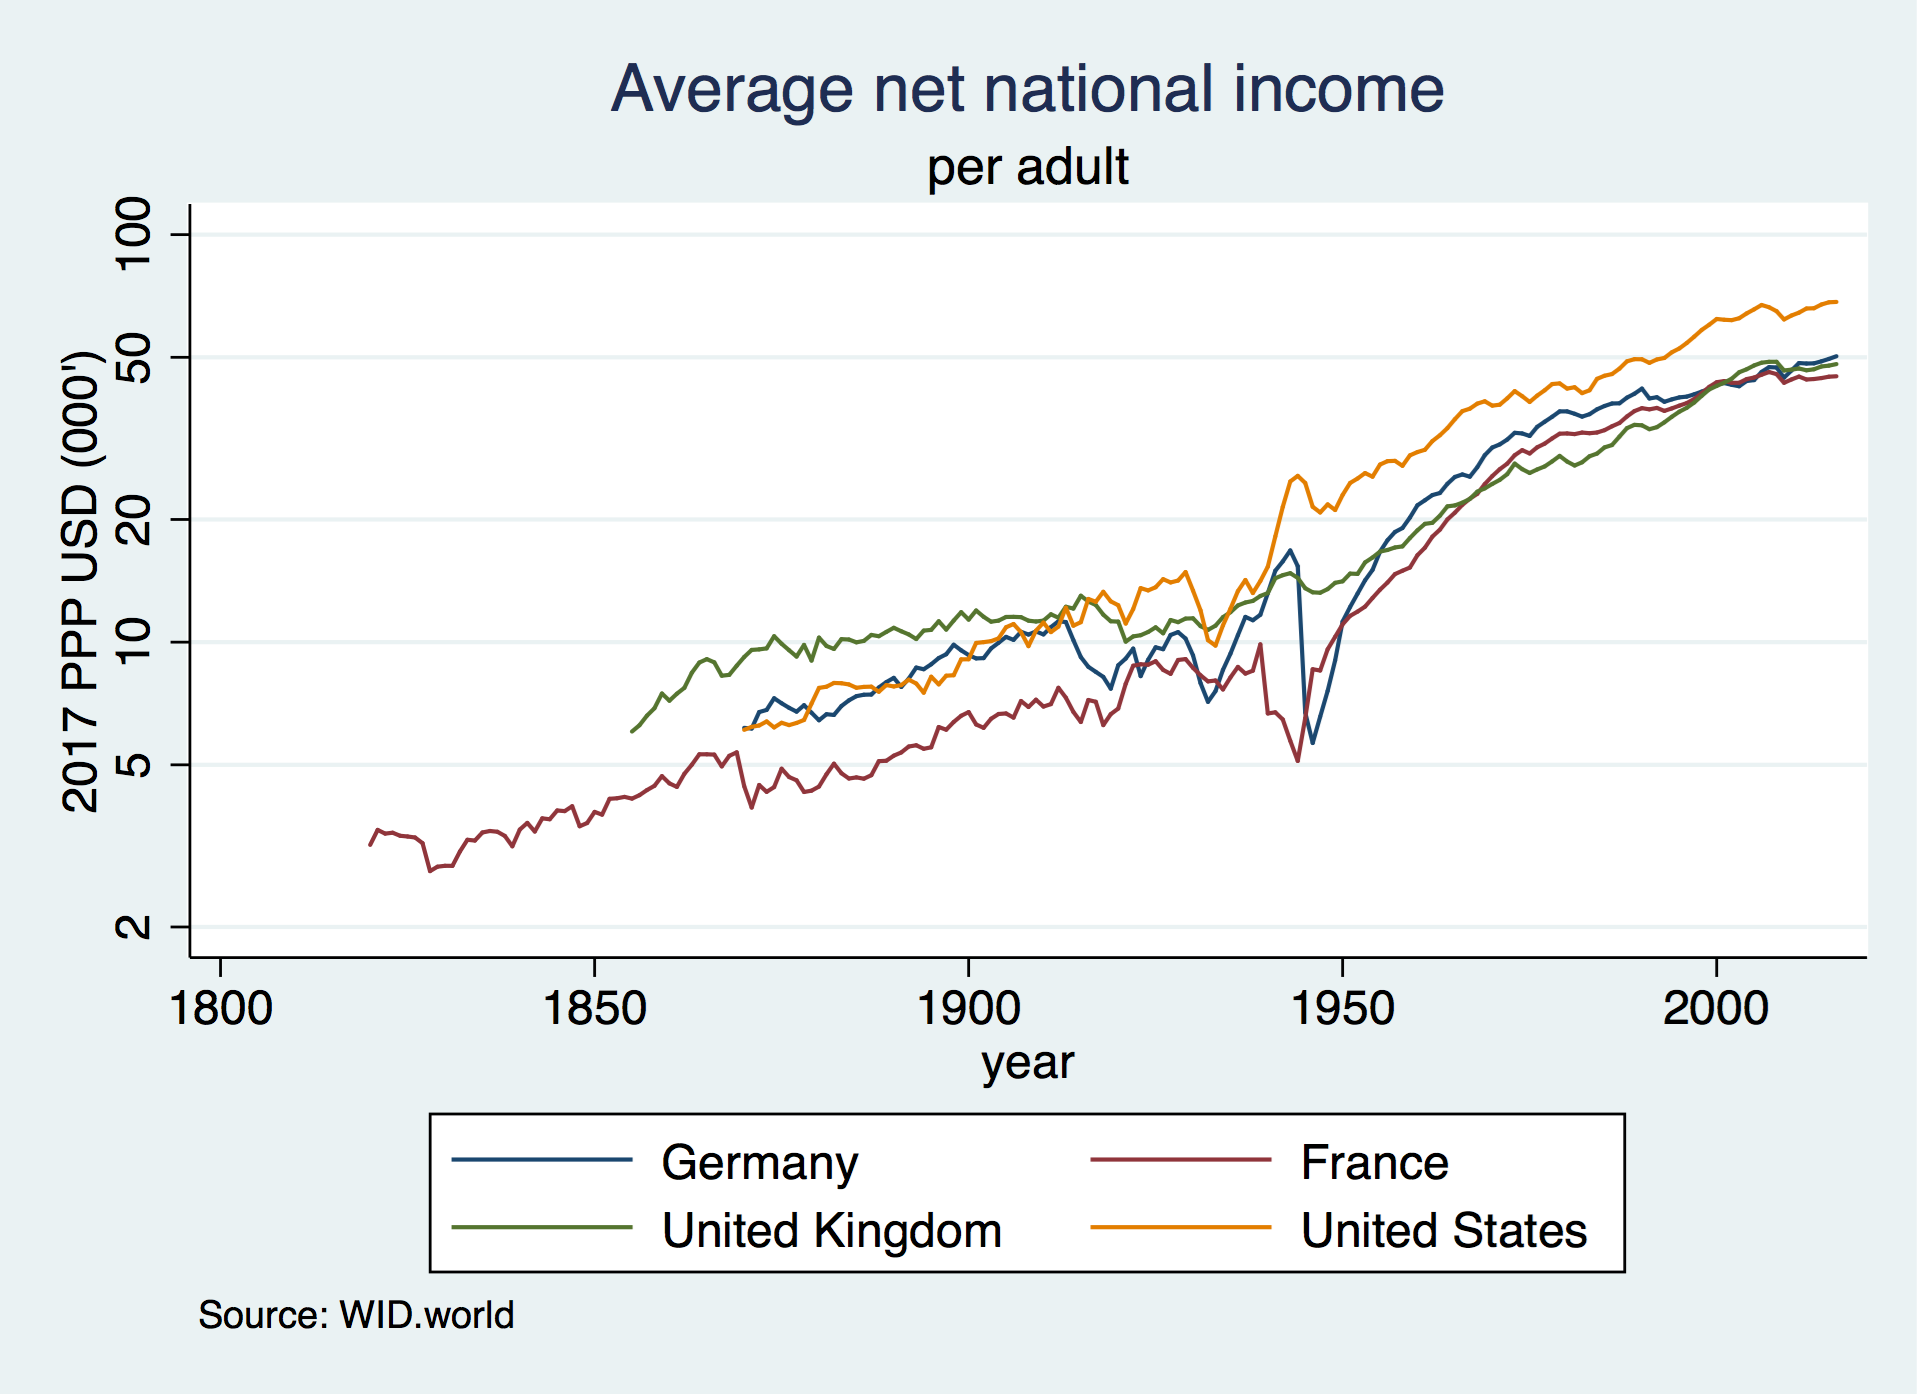
프랑스, 독일, 영국 및 미국에서 성인 당 평균 순 소득의 장기적인 진화 (통나무 규모)를 계획하십시오.
 // Download and store the 2017 USD PPP exchange rate
wid, indicators(xlcusp) areas(FR US DE GB) year(2017) clear
rename value ppp
tempfile ppp
save " `ppp' "

// Download net national income in constant 2017 local currency
wid, indicators(anninc) areas(FR US DE GB) age(992) clear
merge n:1 country using " `ppp' " , nogenerate

// Convert to 2017 USD PPP (thousands)
replace value = value/ppp/1000

// Reshape and plot
keep country year value
reshape wide value, i(year) j(country) string
label variable valueFR " France "
label variable valueUS " United States "
label variable valueDE " Germany "
label variable valueGB " United Kingdom "

graph twoway line value * year, yscale(log) ///
	ytitle( " 2017 PPP USD (000's) " ) ylabel(2 5 10 20 50 100) ///
	title( " Average net national income " ) subtitle( " per adult " ) ///
	note( " Source: WID.world " )