สำคัญ
ขอขอบคุณสำหรับความสนใจในโครงการนี้ อย่างไรก็ตามโปรดทราบว่าที่เก็บนี้จะ ไม่ได้รับการดูแลอีกต่อไป
สำหรับความต้องการที่สำคัญใด ๆ โปรดพิจารณาการเก็บที่เก็บและทำการอัปเดตของคุณเอง
คำเตือน
ฉันมีข้อกังวลอย่างมากเกี่ยวกับความถูกต้องและความสมบูรณ์ของข้อมูลแพ็คเกจนี้เข้าถึงได้ ฉันขอให้ผู้ใช้ใช้ความระมัดระวังและสงสัยอย่างมากเมื่อใช้เครื่องมือนี้และค้นหาแหล่งข้อมูลอื่นสำหรับการทำงานของพวกเขา
นี่คือ เป็นทางการ [หมายเหตุ: ฉันไม่ได้มีส่วนเกี่ยวข้องกับ World Interequality Lab อีกต่อไปและไม่สามารถรับประกันได้ว่าคำสั่งจะยังคงทำงานได้ในอนาคต] คำสั่ง Stata ของฐานข้อมูลความไม่เท่าเทียมกันของโลก (wid.world) ช่วยให้ผู้ใช้ดาวน์โหลดข้อมูลโดยตรงจาก wid.world ไปยัง Stata
ผู้ใช้ควรติดตั้งคำสั่งโดยตรงจาก SSC:
ssc install widเอกสารของคำสั่งพร้อมใช้งานหลังจากการติดตั้งโดยใช้:
help widพล็อตความไม่เท่าเทียมกันของวิวัฒนาการในระยะยาวในฝรั่งเศส:
wid, indicators(shweal) areas(FR) perc(p90p100 p99p100) ages(992) pop(j) clear

// Reshape and plot
reshape wide value, i(year) j(percentile) string
label variable valuep90p100 " Top 10% share "
label variable valuep99p100 " Top 1% share "

graph twoway line value * year, title( " Wealth inequality in France " ) ///
	ylabel(0.2 " 20% " 0.4 " 40% " 0.6 " 60% " 0.8 " 80% " ) ///
	subtitle( " equal-split adults " ) ///
	note( " Source: WID.world " )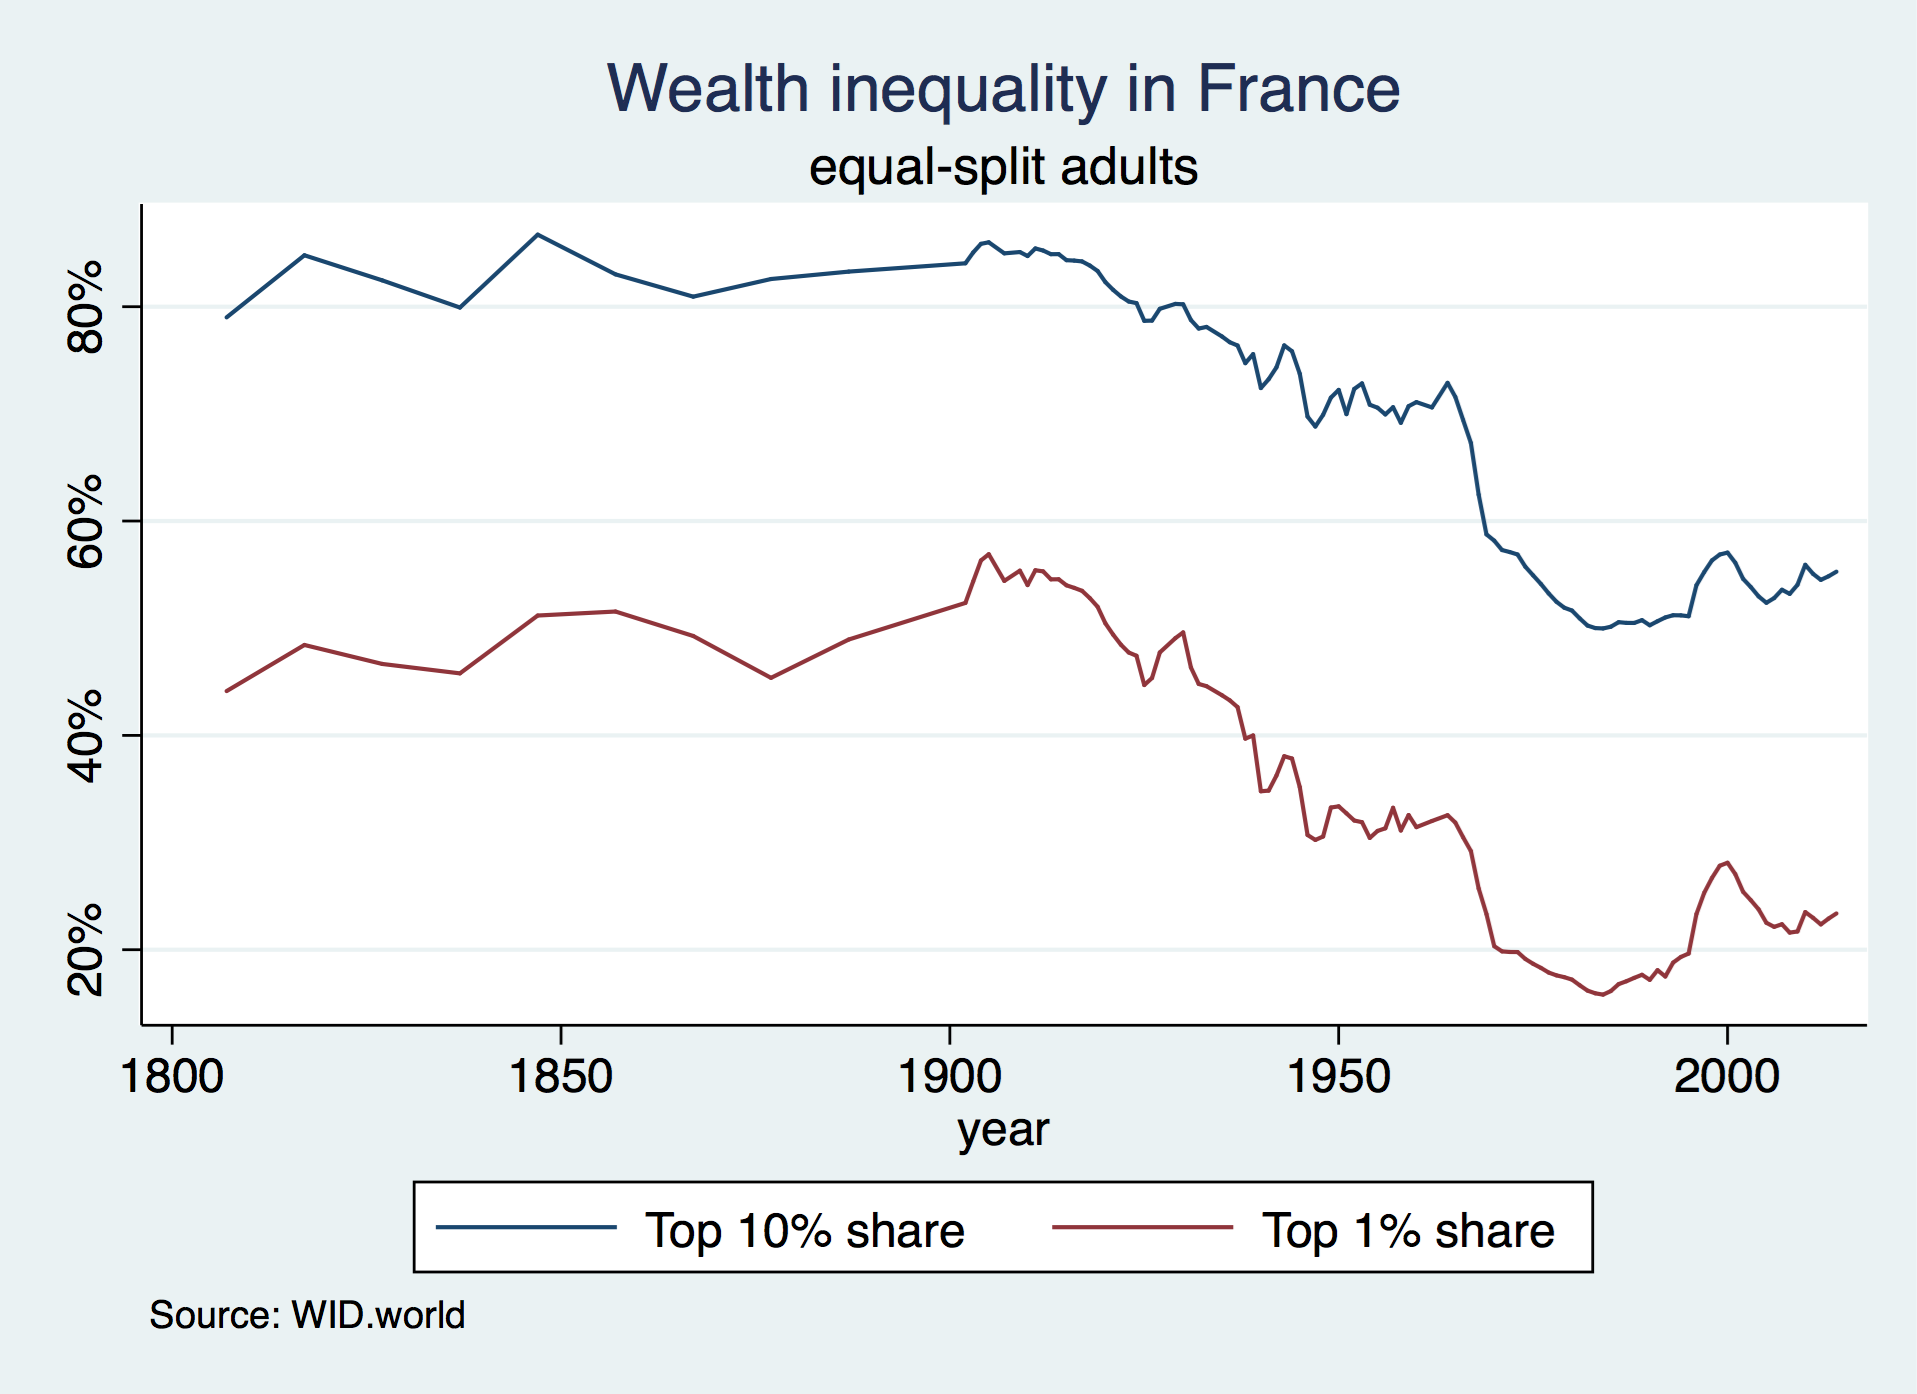
พล็อตวิวัฒนาการของรายได้ชาติก่อนหักภาษีของ 50% ของประชากรในประเทศจีนฝรั่งเศสและสหรัฐอเมริกาตั้งแต่ปี 1978 (ในระดับบันทึก):
 // Download and store the 2017 USD PPP exchange rate
wid, indicators(xlcusp) areas(FR US CN) year(2017) clear
rename value ppp
tempfile ppp
save " `ppp' "

wid, indicators(aptinc) areas(FR US CN) perc(p0p50) year(1978 / 2017) ages(992) pop(j) clear
merge n:1 country using " `ppp' " , nogenerate

// Convert to 2017 USD PPP (thousands)
replace value = value/ppp/1000

// Reshape and plot
keep country year value
reshape wide value, i(year) j(country) string
label variable valueFR " France "
label variable valueUS " United States "
label variable valueCN " China "

graph twoway line value * year, yscale(log) ylabel(1 2 5 10 20) ///
	ytitle( " 2017 PPP USD (000's) " ) ///
	title( " Average pre-tax national income of the bottom 50% " ) subtitle( " equal-split adults " ) ///
	note( " Source: WID.world " ) legend(rows(1))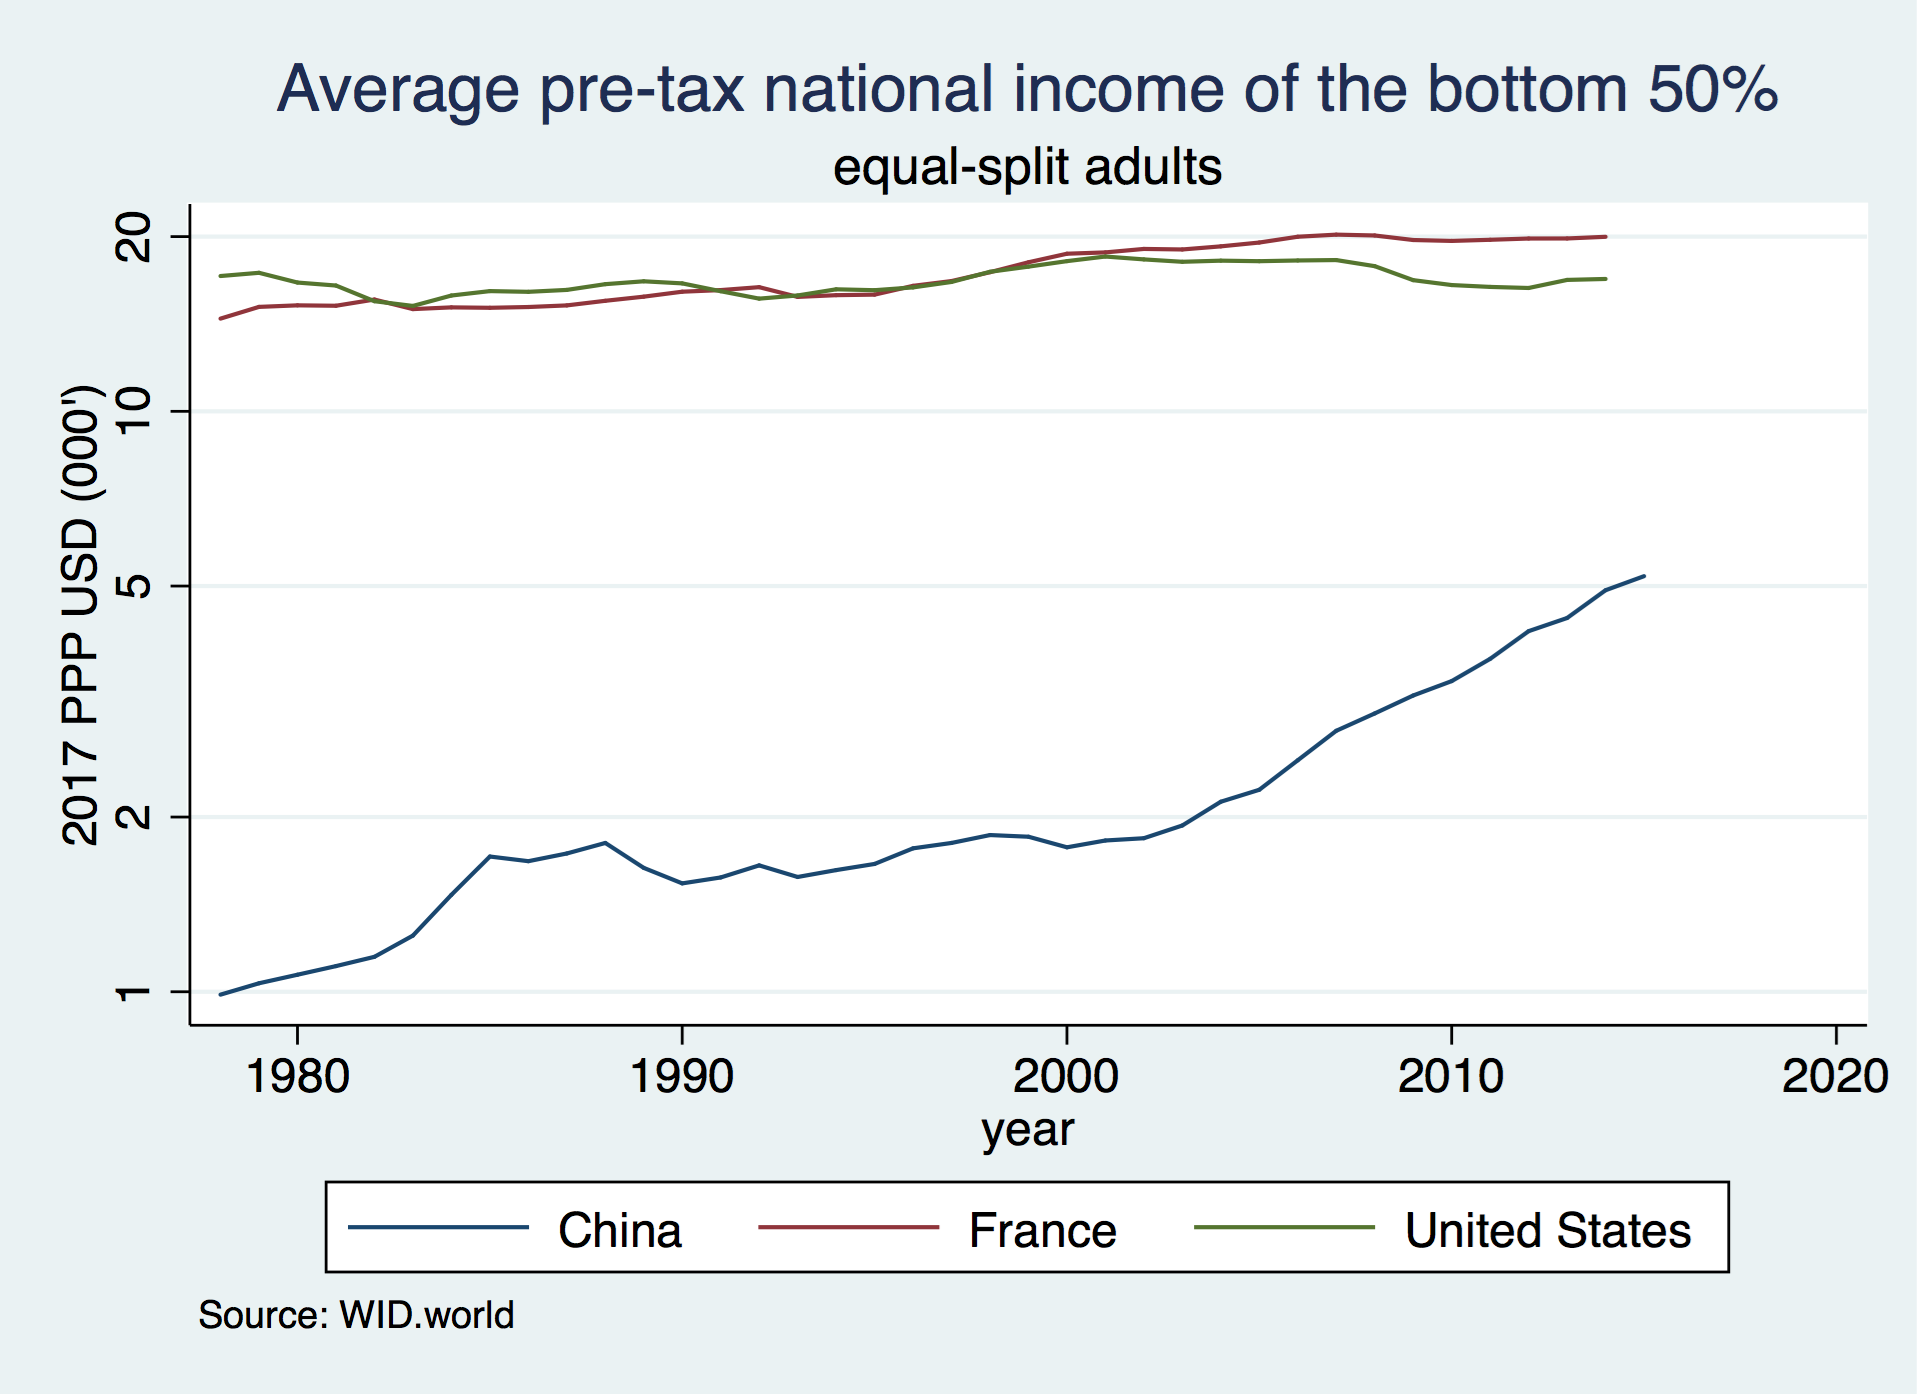
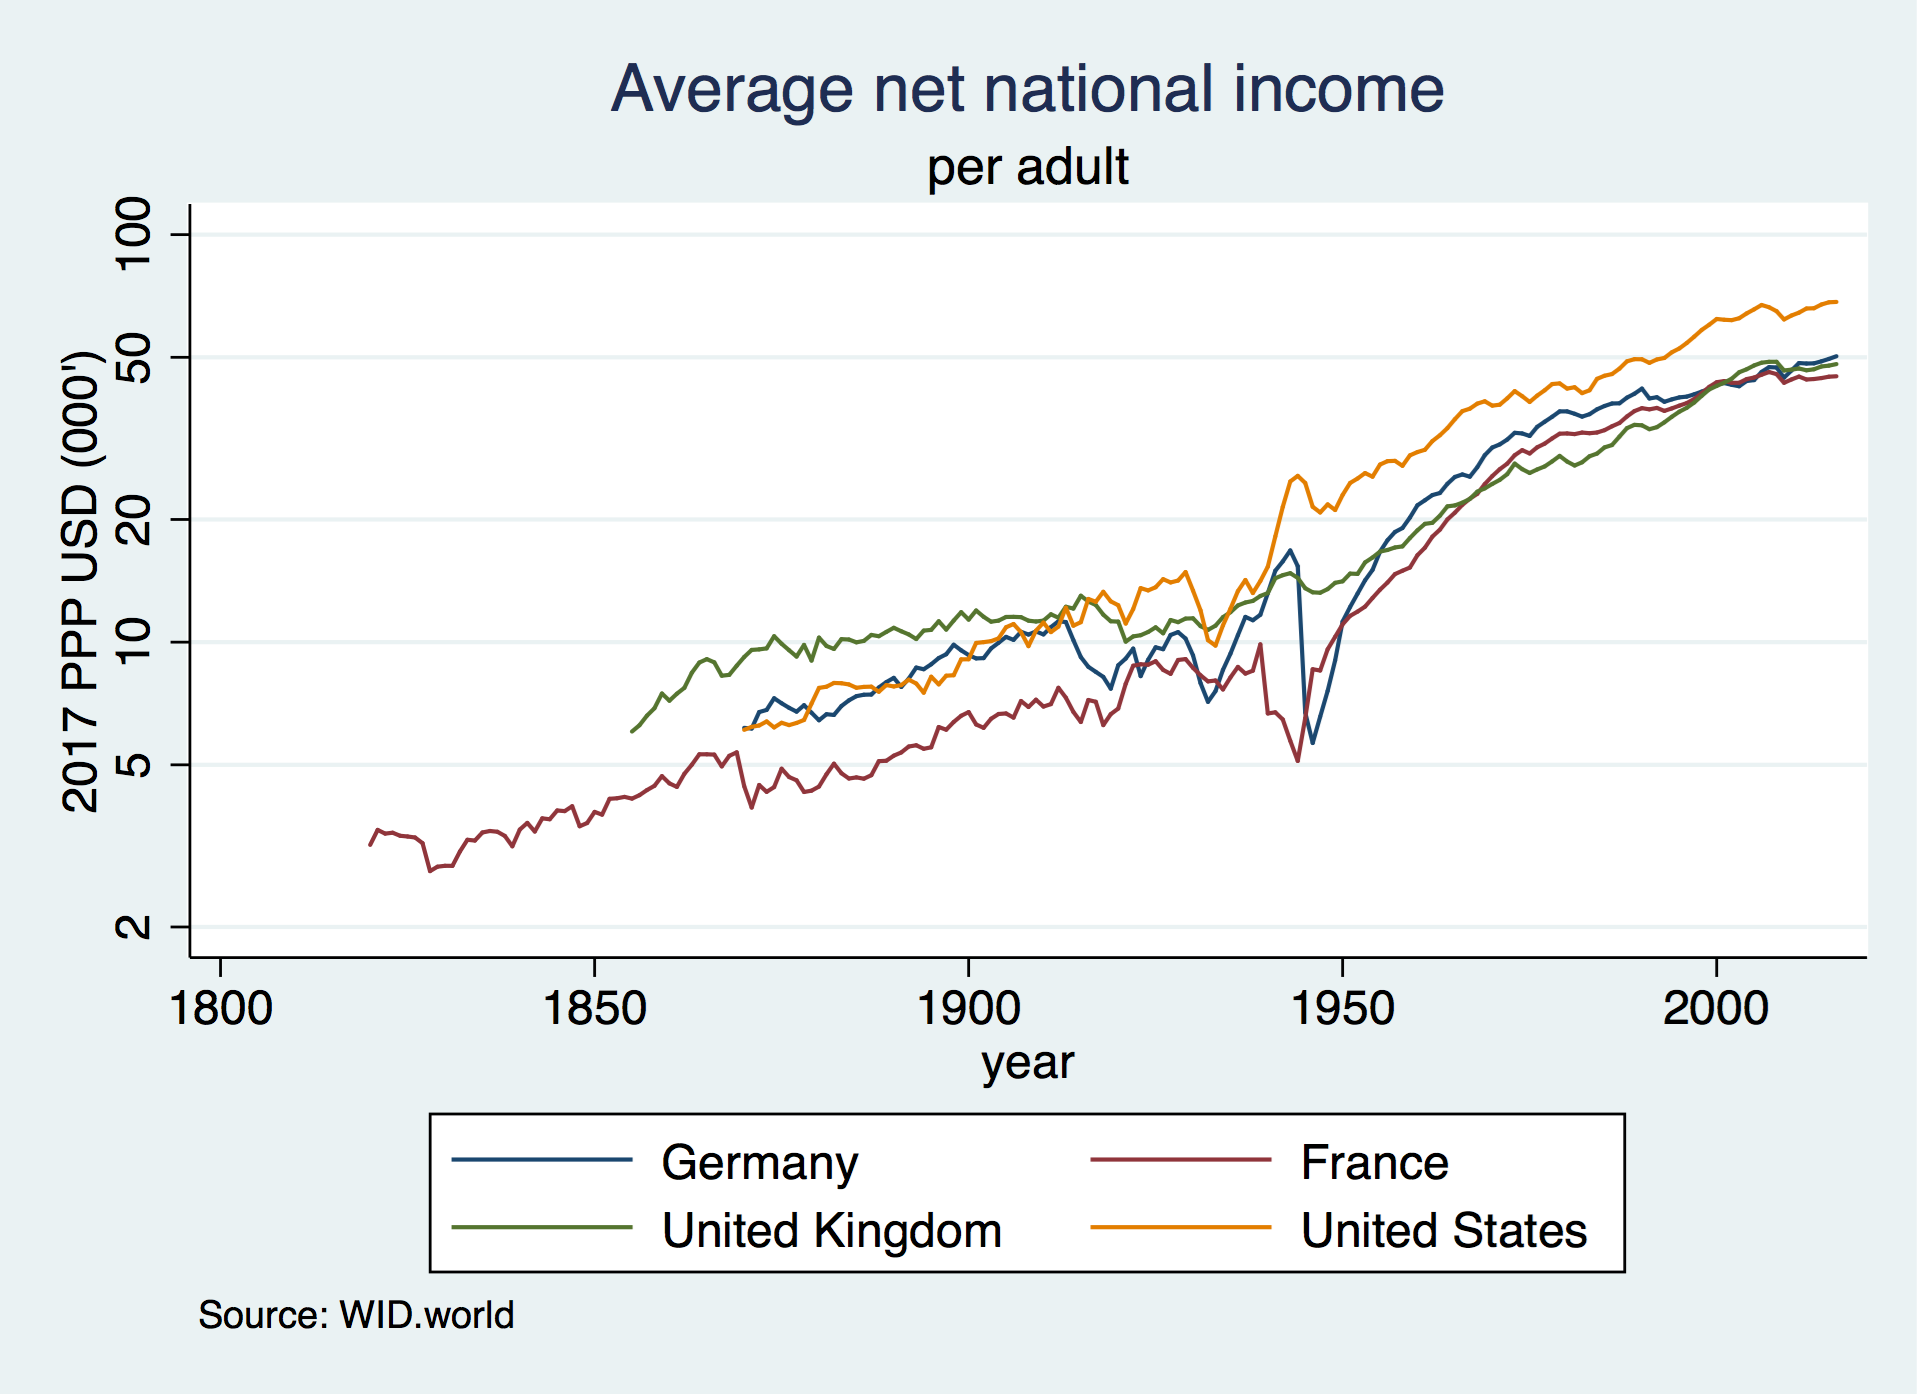
พล็อตวิวัฒนาการระยะยาวของรายได้สุทธิเฉลี่ยต่อผู้ใหญ่ในฝรั่งเศสเยอรมนีสหราชอาณาจักรและสหรัฐอเมริกา (ในระดับบันทึก):
 // Download and store the 2017 USD PPP exchange rate
wid, indicators(xlcusp) areas(FR US DE GB) year(2017) clear
rename value ppp
tempfile ppp
save " `ppp' "

// Download net national income in constant 2017 local currency
wid, indicators(anninc) areas(FR US DE GB) age(992) clear
merge n:1 country using " `ppp' " , nogenerate

// Convert to 2017 USD PPP (thousands)
replace value = value/ppp/1000

// Reshape and plot
keep country year value
reshape wide value, i(year) j(country) string
label variable valueFR " France "
label variable valueUS " United States "
label variable valueDE " Germany "
label variable valueGB " United Kingdom "

graph twoway line value * year, yscale(log) ///
	ytitle( " 2017 PPP USD (000's) " ) ylabel(2 5 10 20 50 100) ///
	title( " Average net national income " ) subtitle( " per adult " ) ///
	note( " Source: WID.world " )