pandas ta
v0.3.14b
PANDAS技术分析( Pandas TA )是一个易于使用的库,它利用PANDAS包具有130多个指标和实用程序功能以及60多个TA Lib Candlestick模式。包括许多常用指标,例如:蜡烛图案( CDL_PARTTEN ),简单移动平均( SMA )移动平均平均收敛差异( MACD ),船体指数移动平均平均值( HMA ), Bollinger带( BBANDS ),平衡量( OBB) ), Aroon&Aroon振荡器( Aroon ),挤压(挤压)等。
注意:必须安装ta lib才能使用所有烛台图案。 pip install TA-Lib 。如果未安装ta lib ,则只有内置的烛台图案可用。
talib=False禁用每个指示器禁用。ta.stdev(df["close"], length=30, talib=False) 。/pandas_ta/custom.py下的import_dir文档。ta.tsignals方法进行回归。lookahead=False to disable。Pandas ta检查用户是否安装了一些常见的交易软件包,包括但不限于: ta lib , vector bt , yfinance ...其中大部分是实验性的,并且可能会破裂,直到它稳定更多为止。
help(ta.ticker)和help(ta.yf)和下面的示例。pip版本是最后一个稳定版本。版本: 0.3.14b
$ pip install pandas_ta最佳选择!版本: 0.3.14b
$ pip install -U git+https://github.com/twopirllc/pandas-ta这是可能具有错误和其他不希望的副作用的开发版本。自身使用!
$ pip install -U git+https://github.com/twopirllc/pandas-ta.git@development import pandas as pd
import pandas_ta as ta
df = pd . DataFrame () # Empty DataFrame
# Load data
df = pd . read_csv ( "path/to/symbol.csv" , sep = "," )
# OR if you have yfinance installed
df = df . ta . ticker ( "aapl" )
# VWAP requires the DataFrame index to be a DatetimeIndex.
# Replace "datetime" with the appropriate column from your DataFrame
df . set_index ( pd . DatetimeIndex ( df [ "datetime" ]), inplace = True )
# Calculate Returns and append to the df DataFrame
df . ta . log_return ( cumulative = True , append = True )
df . ta . percent_return ( cumulative = True , append = True )
# New Columns with results
df . columns
# Take a peek
df . tail ()
# vv Continue Post Processing vv一些指标参数已被重新排序以保持一致性。使用help(ta.indicator_name)以获取更多信息或提出拉动请求以改进文档。
 import pandas as pd
import pandas_ta as ta

# Create a DataFrame so 'ta' can be used.
df = pd . DataFrame ()

# Help about this, 'ta', extension
help ( df . ta )

# List of all indicators
df . ta . indicators ()

# Help about an indicator such as bbands
help ( ta . bbands )感谢您使用Pandas TA !
$ pip install -U git+https://github.com/twopirllc/pandas-ta谢谢您的贡献!
Pandas TA有三个主要的“样式”处理用于您的用例和/或要求的技术指标。它们是:标准,数据帧扩展和熊猫TA策略。每种都有越来越多的抽象水平以易于使用。随着您对大熊猫TA的熟悉,使用Pandas TA策略的简单性和速度可能会变得更加明显。此外,您可以通过链接或组成创建自己的指标。最后,每个指示器要么返回大写下的系列或数据框,无论样式如何。
您明确定义输入列并照顾输出。
sma10 = ta.sma(df["Close"], length=10)SMA_10的系列donchiandf = ta.donchian(df["HIGH"], df["low"], lower_length=10, upper_length=15)DC_10_15和列名称的数据框: DCL_10_15, DCM_10_15, DCU_10_15ema10_ohlc4 = ta.ema(ta.ohlc4(df["Open"], df["High"], df["Low"], df["Close"]), length=10)EMA_10的系列。如果需要,您可能需要唯一的命名。呼叫df.ta将自动将OHLCVA较小为OHLCVA :开放,高,低,关闭,音量, adj_close 。默认情况下, df.ta将使用OHLCVA进行指示参数,以删除直接指定输入列的需要。
sma10 = df.ta.sma(length=10)SMA_10的系列ema10_ohlc4 = df.ta.ema(close=df.ta.ohlc4(), length=10, suffix="OHLC4")EMA_10_OHLC4close=df.ta.ohlc4() 。donchiandf = df.ta.donchian(lower_length=10, upper_length=15)DC_10_15和列名称的数据框: DCL_10_15, DCM_10_15, DCU_10_15与最后三个示例相同,但将结果直接附加到DataFrame df上。
df.ta.sma(length=10, append=True)df列名称: SMA_10 。df.ta.ema(close=df.ta.ohlc4(append=True), length=10, suffix="OHLC4", append=True)close=df.ta.ohlc4() 。df.ta.donchian(lower_length=10, upper_length=15, append=True)df : DCL_10_15, DCM_10_15, DCU_10_15 。熊猫策略是由策略方法运行的一组指标。所有策略都使用MulitProcessing,除非使用col_names参数(见下文)。下一节中列出了不同类型的策略。
 # (1) Create the Strategy
MyStrategy = ta . Strategy (
    name = "DCSMA10" ,
    ta = [
        { "kind" : "ohlc4" },
        { "kind" : "sma" , "length" : 10 },
        { "kind" : "donchian" , "lower_length" : 10 , "upper_length" : 15 },
        { "kind" : "ema" , "close" : "OHLC4" , "length" : 10 , "suffix" : "OHLC4" },
    ]
)

# (2) Run the Strategy
df . ta . strategy ( MyStrategy , ** kwargs )策略类是一种使用数据类命名和分组您喜欢的TA指标的简单方法。 Pandas Ta提供了两种预先建立的基本策略,可以帮助您入门: Allstrategy和Commandate 。策略可以像使用组成/链接一样简单,也可以根据需要尽可能复杂。
df上。有关指标组成/链接在内的示例,请参见pandas ta策略示例笔记本。
{"kind": "indicator name"}属性,则在Pandas TA消耗时,策略将失败。切记检查您的拼写。 # Running the Builtin CommonStrategy as mentioned above
df . ta . strategy ( ta . CommonStrategy )
# The Default Strategy is the ta.AllStrategy. The following are equivalent:
df . ta . strategy ()
df . ta . strategy ( "All" )
df . ta . strategy ( ta . AllStrategy ) # List of indicator categories
df . ta . categories
# Running a Categorical Strategy only requires the Category name
df . ta . strategy ( "Momentum" ) # Default values for all Momentum indicators
df . ta . strategy ( "overlap" , length = 42 ) # Override all Overlap 'length' attributes # Create your own Custom Strategy
CustomStrategy = ta . Strategy (
name = "Momo and Volatility" ,
description = "SMA 50,200, BBANDS, RSI, MACD and Volume SMA 20" ,
ta = [
{ "kind" : "sma" , "length" : 50 },
{ "kind" : "sma" , "length" : 200 },
{ "kind" : "bbands" , "length" : 20 },
{ "kind" : "rsi" },
{ "kind" : "macd" , "fast" : 8 , "slow" : 21 },
{ "kind" : "sma" , "close" : "volume" , "length" : 20 , "prefix" : "VOLUME" },
]
)
# To run your "Custom Strategy"
df . ta . strategy ( CustomStrategy )Pandas TA策略方法利用多处理来进行所有策略类型的批量处理,但一个例外!当使用col_names参数重命名结果列时, ta数组中的指示器将按顺序运行。
 # VWAP requires the DataFrame index to be a DatetimeIndex.
# * Replace "datetime" with the appropriate column from your DataFrame
df . set_index ( pd . DatetimeIndex ( df [ "datetime" ]), inplace = True )

# Runs and appends all indicators to the current DataFrame by default
# The resultant DataFrame will be large.
df . ta . strategy ()
# Or the string "all"
df . ta . strategy ( "all" )
# Or the ta.AllStrategy
df . ta . strategy ( ta . AllStrategy )

# Use verbose if you want to make sure it is running.
df . ta . strategy ( verbose = True )

# Use timed if you want to see how long it takes to run.
df . ta . strategy ( timed = True )

# Choose the number of cores to use. Default is all available cores.
# For no multiprocessing, set this value to 0.
df . ta . cores = 4

# Maybe you do not want certain indicators.
# Just exclude (a list of) them.
df . ta . strategy ( exclude = [ "bop" , "mom" , "percent_return" , "wcp" , "pvi" ], verbose = True )

# Perhaps you want to use different values for indicators.
# This will run ALL indicators that have fast or slow as parameters.
# Check your results and exclude as necessary.
df . ta . strategy ( fast = 10 , slow = 50 , verbose = True )

# Sanity check. Make sure all the columns are there
df . columns 请记住,这些不会利用多处理
 NonMPStrategy = ta . Strategy (
    name = "EMAs, BBs, and MACD" ,
    description = "Non Multiprocessing Strategy by rename Columns" ,
    ta = [
        { "kind" : "ema" , "length" : 8 },
        { "kind" : "ema" , "length" : 21 },
        { "kind" : "bbands" , "length" : 20 , "col_names" : ( "BBL" , "BBM" , "BBU" )},
        { "kind" : "macd" , "fast" : 8 , "slow" : 21 , "col_names" : ( "MACD" , "MACD_H" , "MACD_S" )}
    ]
)
# Run it
df . ta . strategy ( NonMPStrategy ) # Set ta to default to an adjusted column, 'adj_close', overriding default 'close'.
df . ta . adjusted = "adj_close"
df . ta . sma ( length = 10 , append = True )
# To reset back to 'close', set adjusted back to None.
df . ta . adjusted = None # List of Pandas TA categories.
df . ta . categories # Set the number of cores to use for strategy multiprocessing
# Defaults to the number of cpus you have.
df . ta . cores = 4
# Set the number of cores to 0 for no multiprocessing.
df . ta . cores = 0
# Returns the number of cores you set or your default number of cpus.
df . ta . cores # The 'datetime_ordered' property returns True if the DataFrame
# index is of Pandas datetime64 and df.index[0] < df.index[-1].
# Otherwise it returns False.
df . ta . datetime_ordered # Sets the Exchange to use when calculating the last_run property. Default: "NYSE"
df . ta . exchange
# Set the Exchange to use.
# Available Exchanges: "ASX", "BMF", "DIFX", "FWB", "HKE", "JSE", "LSE", "NSE", "NYSE", "NZSX", "RTS", "SGX", "SSE", "TSE", "TSX"
df . ta . exchange = "LSE" # Returns the time Pandas TA was last run as a string.
df . ta . last_run # The 'reverse' is a helper property that returns the DataFrame
# in reverse order.
df . ta . reverse # Applying a prefix to the name of an indicator.
prehl2 = df . ta . hl2 ( prefix = "pre" )
print ( prehl2 . name ) # "pre_HL2"
# Applying a suffix to the name of an indicator.
endhl2 = df . ta . hl2 ( suffix = "post" )
print ( endhl2 . name ) # "HL2_post"
# Applying a prefix and suffix to the name of an indicator.
bothhl2 = df . ta . hl2 ( prefix = "pre" , suffix = "post" )
print ( bothhl2 . name ) # "pre_HL2_post" # Returns the time range of the DataFrame as a float.
# By default, it returns the time in "years"
df . ta . time_range
# Available time_ranges include: "years", "months", "weeks", "days", "hours", "minutes". "seconds"
df . ta . time_range = "days"
df . ta . time_range # prints DataFrame time in "days" as float # Sets the DataFrame index to UTC format.
df . ta . to_utc import numpy as np
# Add constant '1' to the DataFrame
df . ta . constants ( True , [ 1 ])
# Remove constant '1' to the DataFrame
df . ta . constants ( False , [ 1 ])
# Adding constants for charting
import numpy as np
chart_lines = np . append ( np . arange ( - 4 , 5 , 1 ), np . arange ( - 100 , 110 , 10 ))
df . ta . constants ( True , chart_lines )
# Removing some constants from the DataFrame
df . ta . constants ( False , np . array ([ - 60 , - 40 , 40 , 60 ])) # Prints the indicators and utility functions
df . ta . indicators ()
# Returns a list of indicators and utility functions
ind_list = df . ta . indicators ( as_list = True )
# Prints the indicators and utility functions that are not in the excluded list
df . ta . indicators ( exclude = [ "cg" , "pgo" , "ui" ])
# Returns a list of the indicators and utility functions that are not in the excluded list
smaller_list = df . ta . indicators ( exclude = [ "cg" , "pgo" , "ui" ], as_list = True ) # Download Chart history using yfinance. (pip install yfinance) https://github.com/ranaroussi/yfinance
# It uses the same keyword arguments as yfinance (excluding start and end)
df = df . ta . ticker ( "aapl" ) # Default ticker is "SPY"
# Period is used instead of start/end
# Valid periods: 1d,5d,1mo,3mo,6mo,1y,2y,5y,10y,ytd,max
# Default: "max"
df = df . ta . ticker ( "aapl" , period = "1y" ) # Gets this past year
# History by Interval by interval (including intraday if period < 60 days)
# Valid intervals: 1m,2m,5m,15m,30m,60m,90m,1h,1d,5d,1wk,1mo,3mo
# Default: "1d"
df = df . ta . ticker ( "aapl" , period = "1y" , interval = "1wk" ) # Gets this past year in weeks
df = df . ta . ticker ( "aapl" , period = "1mo" , interval = "1h" ) # Gets this past month in hours
# BUT WAIT!! THERE'S MORE!!
help ( ta . yf )不大胆的模式,需要安装ta-lib: pip install TA-Lib
 # Get all candle patterns (This is the default behaviour)
df = df . ta . cdl_pattern ( name = "all" )

# Get only one pattern
df = df . ta . cdl_pattern ( name = "doji" )

# Get some patterns
df = df . ta . cdl_pattern ( name = [ "doji" , "inside" ])ta.linreg(series, r=True)lazybear=Truedf.ta.strategy() 。| 移动平均收敛差异(MACD) |
|---|
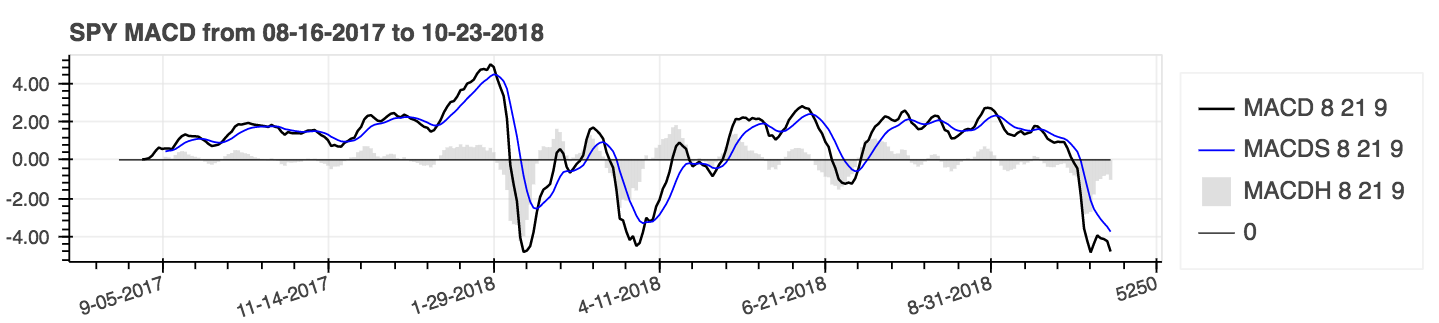 |
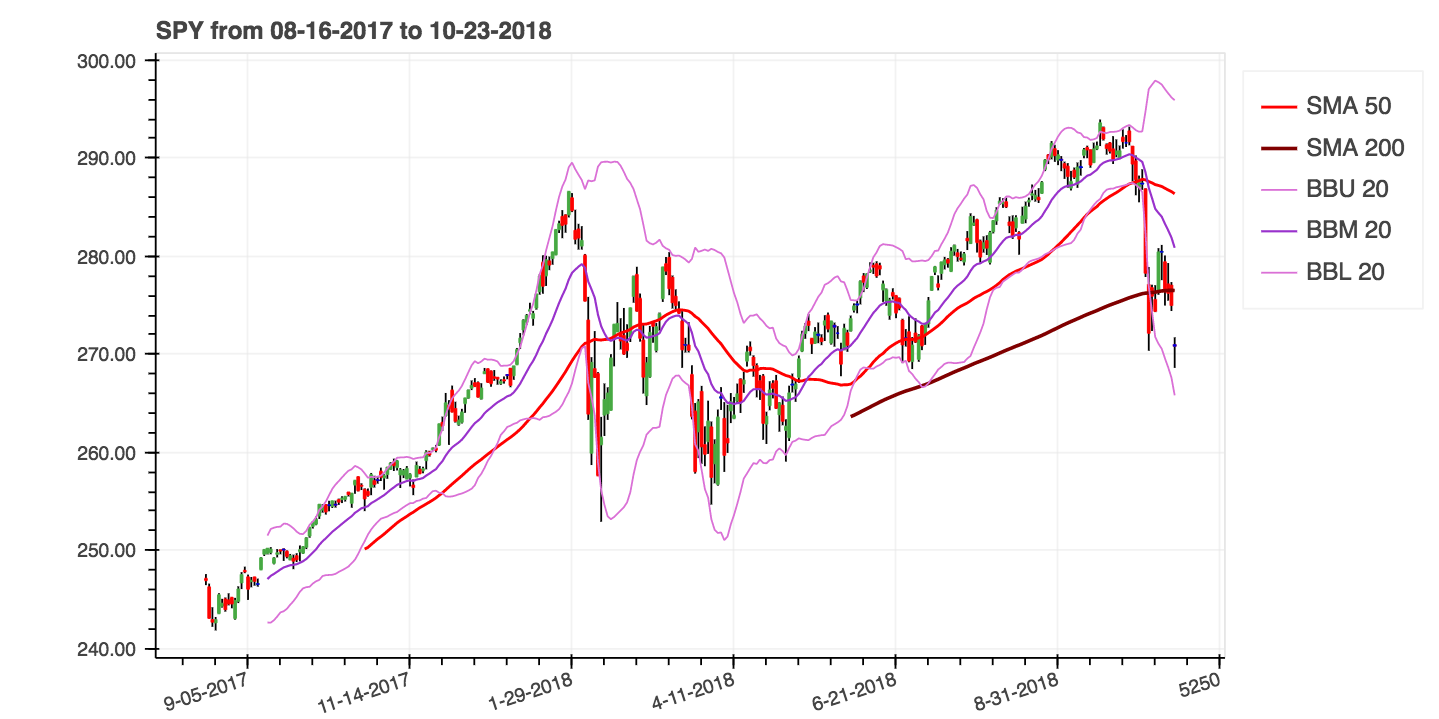
help(ta.ichimoku) 。lookahead=False drops chikou跨度列,以防止潜在的数据泄漏。| 简单的移动平均值(SMA)和布林乐队(Bands) |
|---|
|
使用参数:累积=为累积结果。
| 返回百分比(累积),简单移动平均值(SMA) |
|---|
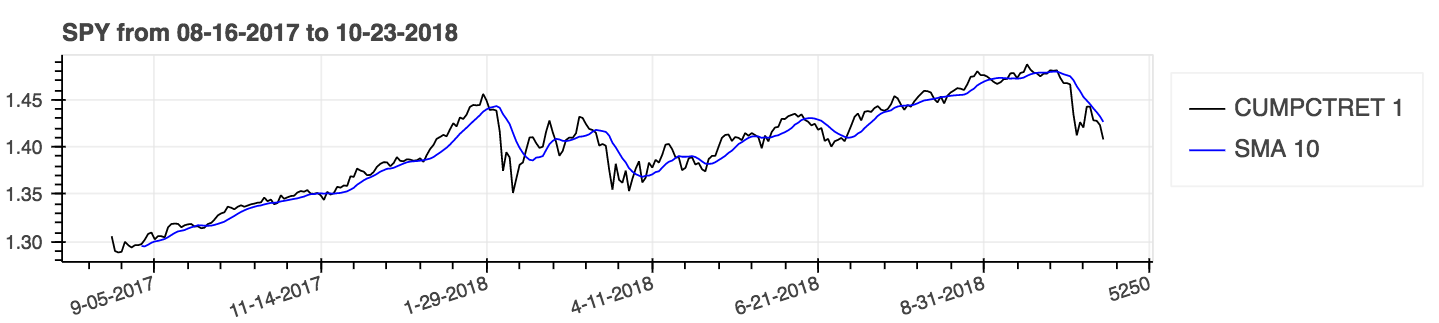 |
| Z得分 |
|---|
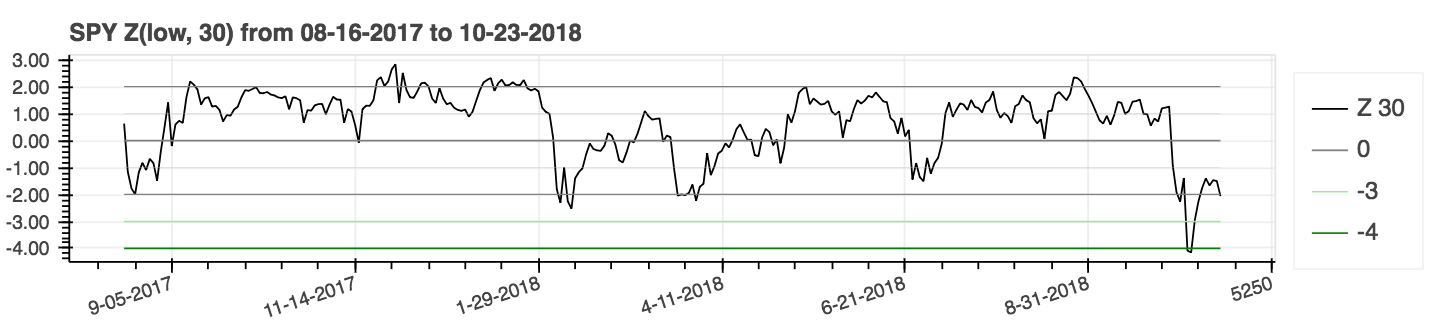 |
lookahead=False至“禁用中心”并删除潜在的数据泄漏。| 平均方向运动指数(ADX) |
|---|
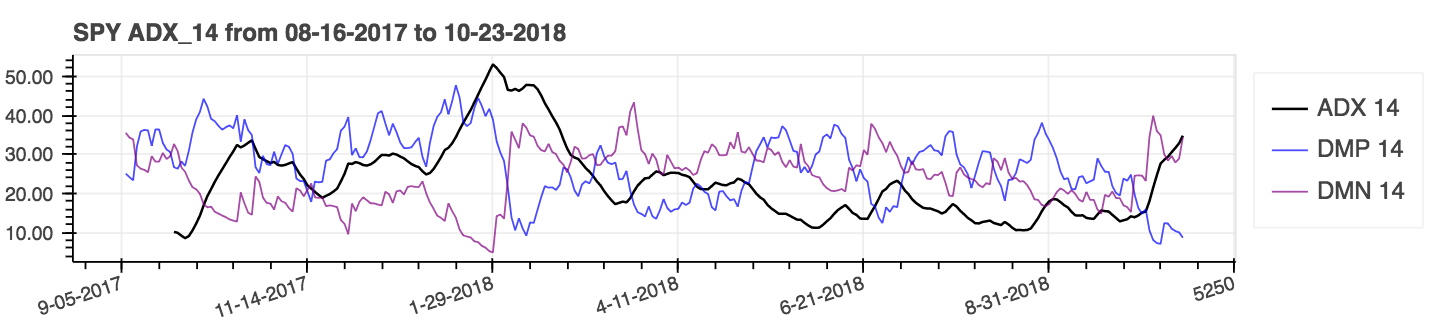 |
| 平均真实范围(ATR) |
|---|
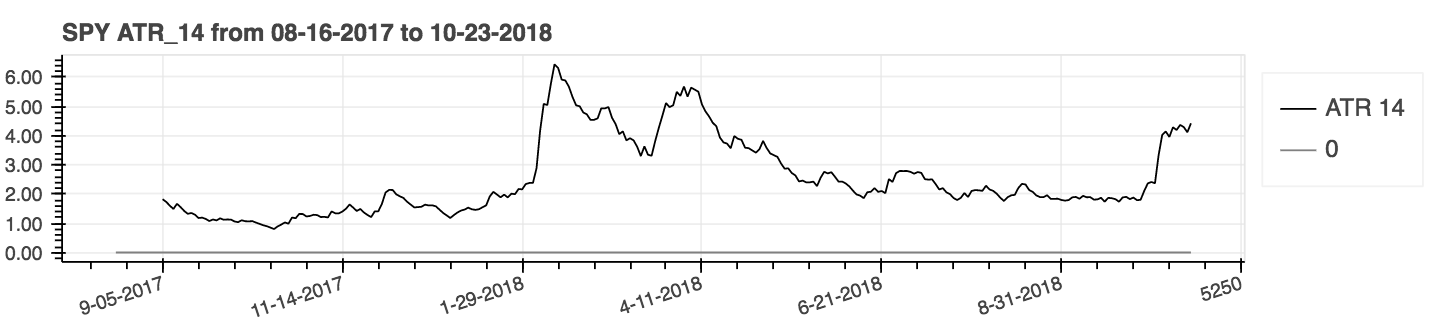 |
| 平衡体积(OBV) |
|---|
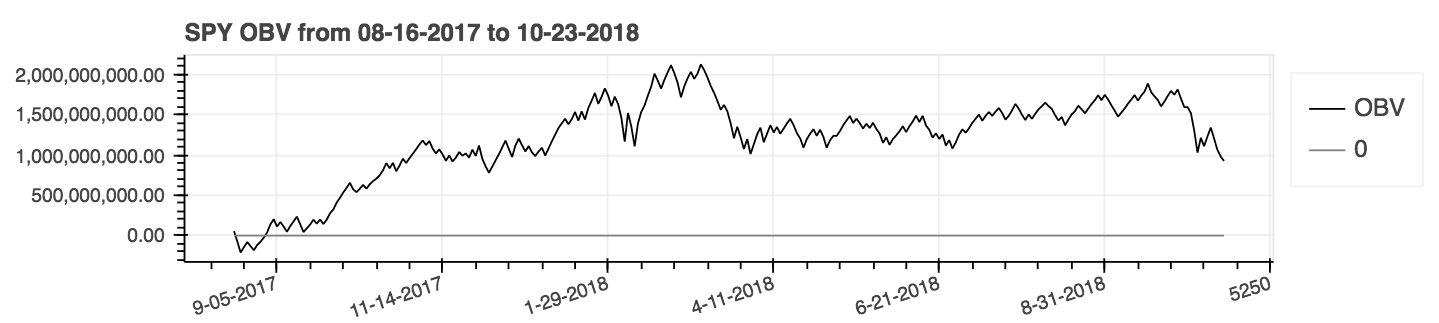 |
性能指标是该软件包的新补充,因此可能是不可靠的。自行使用。这些指标返回浮点,不属于数据框架扩展名。它们被称为标准方式。例如:
 import pandas_ta as ta
result = ta . cagr ( df . close )为了更轻松地与vectorbt的from_signals方法集成在一起,已用ta.trend_return方法已被ta.tsignals方法替换,以简化交易信号的生成。有关全面的示例,请参见示例目录中的pandas ta的示例jupyter笔记本电脑vectorbt回测。
 import pandas as pd
import pandas_ta as ta
import vectorbt as vbt

df = pd . DataFrame (). ta . ticker ( "AAPL" ) # requires 'yfinance' installed

# Create the "Golden Cross"
df [ "GC" ] = df . ta . sma ( 50 , append = True ) > df . ta . sma ( 200 , append = True )

# Create boolean Signals(TS_Entries, TS_Exits) for vectorbt
golden = df . ta . tsignals ( df . GC , asbool = True , append = True )

# Sanity Check (Ensure data exists)
print ( df )

# Create the Signals Portfolio
pf = vbt . Portfolio . from_signals ( df . close , entries = golden . TS_Entries , exits = golden . TS_Exits , freq = "D" , init_cash = 100_000 , fees = 0.0025 , slippage = 0.0025 )

# Print Portfolio Stats and Return Stats
print ( pf . stats ())
print ( pf . returns_stats ())mamode kwarg ,并使用移动平均工具函数ta.ma()进行了更多移动的平均选择。为简单起见,所有选择都是单源移动平均值。这主要是具有mamode Kwarg的指标使用的内部实用程序。这包括指标: ACCBAND , AMAT , AOBV , ATR , BBANDS , BANG , EFI , HILO , KC , NATR , QQE , RVI和THERMO ;默认的mamode参数尚未更改。但是,如果需要,用户也可以使用ta.ma() 。有关更多信息: help(ta.ma)to_utc ,将数据框架索引转换为UTC。请参阅: help(ta.to_utc)现在作为pandas ta dataframe属性,可以轻松将数据框架索引转换为UTC。 close > sma(close, 50)之类的趋势系列时,它会返回该趋势的趋势,贸易参赛作品和贸易出口,以使其与VectorBT兼容,以使其与asbool=True兼容,以获取Boolean Trade参赛作品和退出。请参阅help(ta.tsignals) help(ta.alma)交易帐户或资金。请参阅help(ta.drawdown)help(ta.cdl_pattern)help(ta.cdl_z)help(ta.cti)help(ta.xsignals)help(ta.dm)help(ta.ebsw)help(ta.jma)help(ta.kvo)进行比较。help(ta.stc)help(ta.squeeze_pro)df.ta.strategy()中脱颖而出。请参阅help(ta.td_seq)help(ta.tos_stdevall)help(ta.vhf) mamode重命名为mode 。请参阅help(ta.accbands) 。mamode ,并且具有与TradingView相同的mamode选项。新参数lensig行为与TradingView的内置ADX指标一样。请参阅help(ta.adx) 。drift参数和更多描述性列名。mamode现在是“ RMA ”,并且具有与TradingView相同的mamode选项。请参阅help(ta.atr) 。ddoff控制自由度。还包括BB百分比(BBP)作为最后一列。默认值为0。请参阅help(ta.bbands) 。ln新论点。默认值为false。请参阅help(ta.chop) 。True tvmode 。当tvmode=False时, CKSP实现了具有默认值的“新技术交易者”。请参阅help(ta.cksp) 。talib将使用TA Lib的版本,如果安装了TA Lib。默认是正确的。请参阅help(ta.cmo) 。strict检查该系列是否随着更快的计算在周期length上不断减小。默认值: False 。默认情况下也添加了percent参数。请参阅help(ta.decreasing) 。strict检查该系列是否在更快的计算中不断length 。默认值: False 。默认情况下也添加了percent参数。请参阅help(ta.increasing) 。help(ta.kvo) 。as_strided方法还是较新的sliding_window_view方法。这应该解决Google COLAB的问题,并延迟依赖性更新以及Tensorflow的依赖关系,如第285和#329期所讨论的。asmode启用了MACD版本。默认值为false。请参阅help(ta.macd) 。sar 。新参数af0初始化加速度因子。请参阅help(ta.psar) 。mamode作为选项。默认值是与Ta Lib匹配的SMA 。请参阅help(ta.ppo) 。13和信号MA模式mamode添加signal ,默认EMA作为参数。请参阅help(ta.tsi) 。help(ta.vp) 。help(ta.vwma) 。anchor的新参数。默认值:“每日”。有关其他选项,请参见时间表偏移别名。要求DataFrame索引为DateTimeIndex。请参阅help(ta.vwap) 。help(ta.vwma) 。Z_length更改为ZS_length 。请参阅help(ta.zscore) 。原始ta-lib | TradingView |塞拉图表| mql5 | FM Labs | Pro真实代码|用户42
感觉很慷慨,就像包装一样,还是想看到它变得更加成熟?


