重要的
感謝您對該項目的關注。但是,請注意,該存儲庫不再維護。
對於任何關鍵需求,請考慮分配存儲庫並進行自己的更新。
警告
我對此軟件包訪問的數據的有效性和完整性感到非常擔憂。我敦促用戶在使用此工具時要謹慎和懷疑,並為其工作尋求替代來源。
這是官方的[注意:我不再隸屬於世界不平等實驗室,無法提供任何保證該命令將來將保持功能的功能]世界上的Stata命令不平等數據庫(wid.world)。它使用戶可以將數據直接從wid.world下載到Stata中。
用戶應直接從SSC安裝命令:
ssc install wid安裝後可用該命令的文檔使用:
help wid繪製法國長期進化的財富不平等:
wid, indicators(shweal) areas(FR) perc(p90p100 p99p100) ages(992) pop(j) clear

// Reshape and plot
reshape wide value, i(year) j(percentile) string
label variable valuep90p100 " Top 10% share "
label variable valuep99p100 " Top 1% share "

graph twoway line value * year, title( " Wealth inequality in France " ) ///
	ylabel(0.2 " 20% " 0.4 " 40% " 0.6 " 60% " 0.8 " 80% " ) ///
	subtitle( " equal-split adults " ) ///
	note( " Source: WID.world " )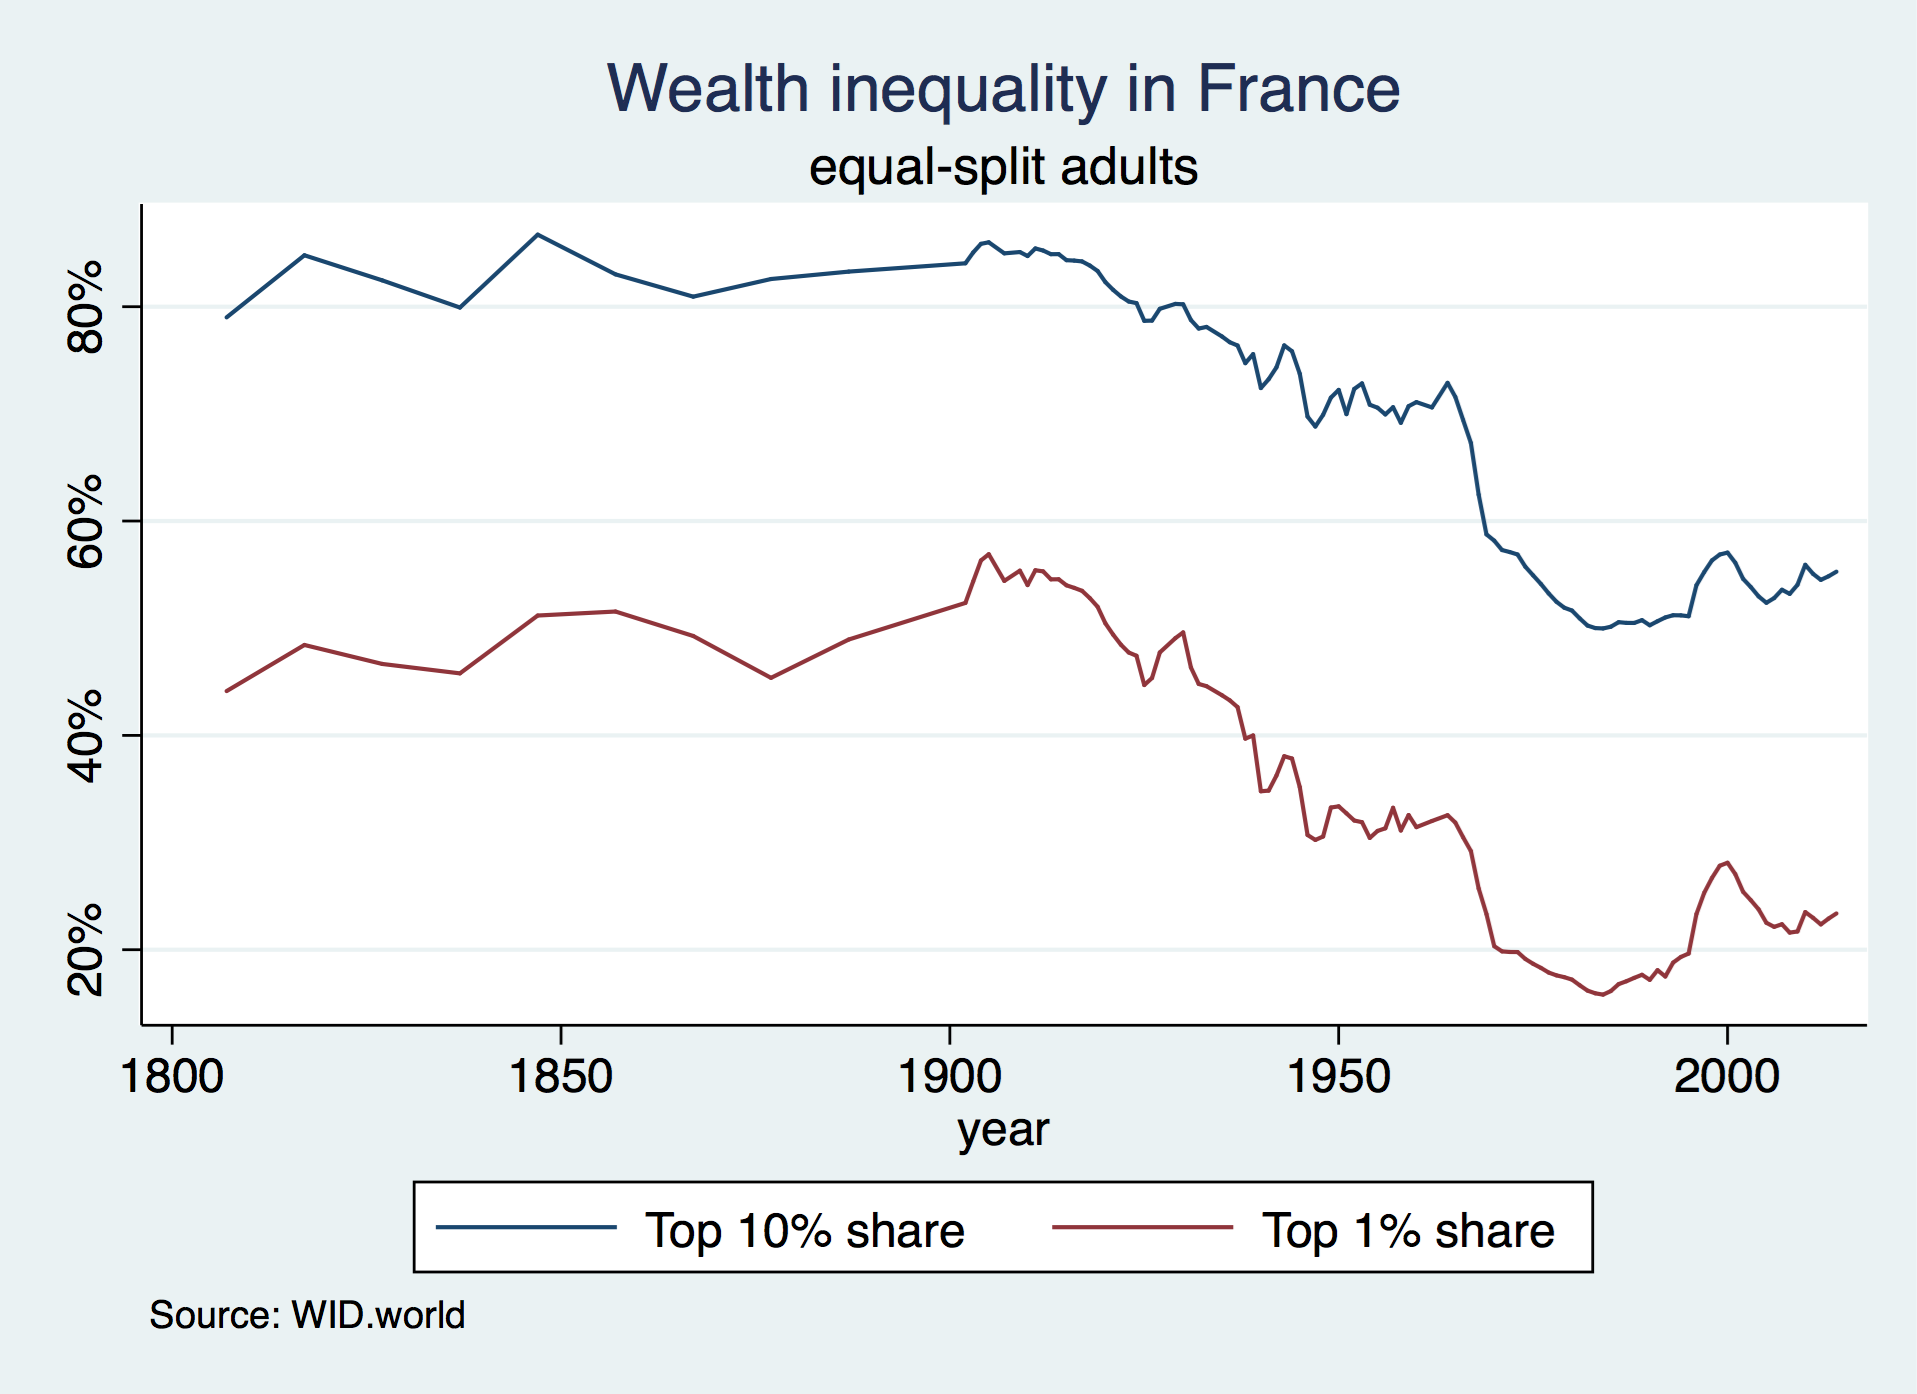
繪製自1978年以來中國,法國和美國的最低人口最低人口的稅前國民收入的演變(按日誌規模):
 // Download and store the 2017 USD PPP exchange rate
wid, indicators(xlcusp) areas(FR US CN) year(2017) clear
rename value ppp
tempfile ppp
save " `ppp' "

wid, indicators(aptinc) areas(FR US CN) perc(p0p50) year(1978 / 2017) ages(992) pop(j) clear
merge n:1 country using " `ppp' " , nogenerate

// Convert to 2017 USD PPP (thousands)
replace value = value/ppp/1000

// Reshape and plot
keep country year value
reshape wide value, i(year) j(country) string
label variable valueFR " France "
label variable valueUS " United States "
label variable valueCN " China "

graph twoway line value * year, yscale(log) ylabel(1 2 5 10 20) ///
	ytitle( " 2017 PPP USD (000's) " ) ///
	title( " Average pre-tax national income of the bottom 50% " ) subtitle( " equal-split adults " ) ///
	note( " Source: WID.world " ) legend(rows(1))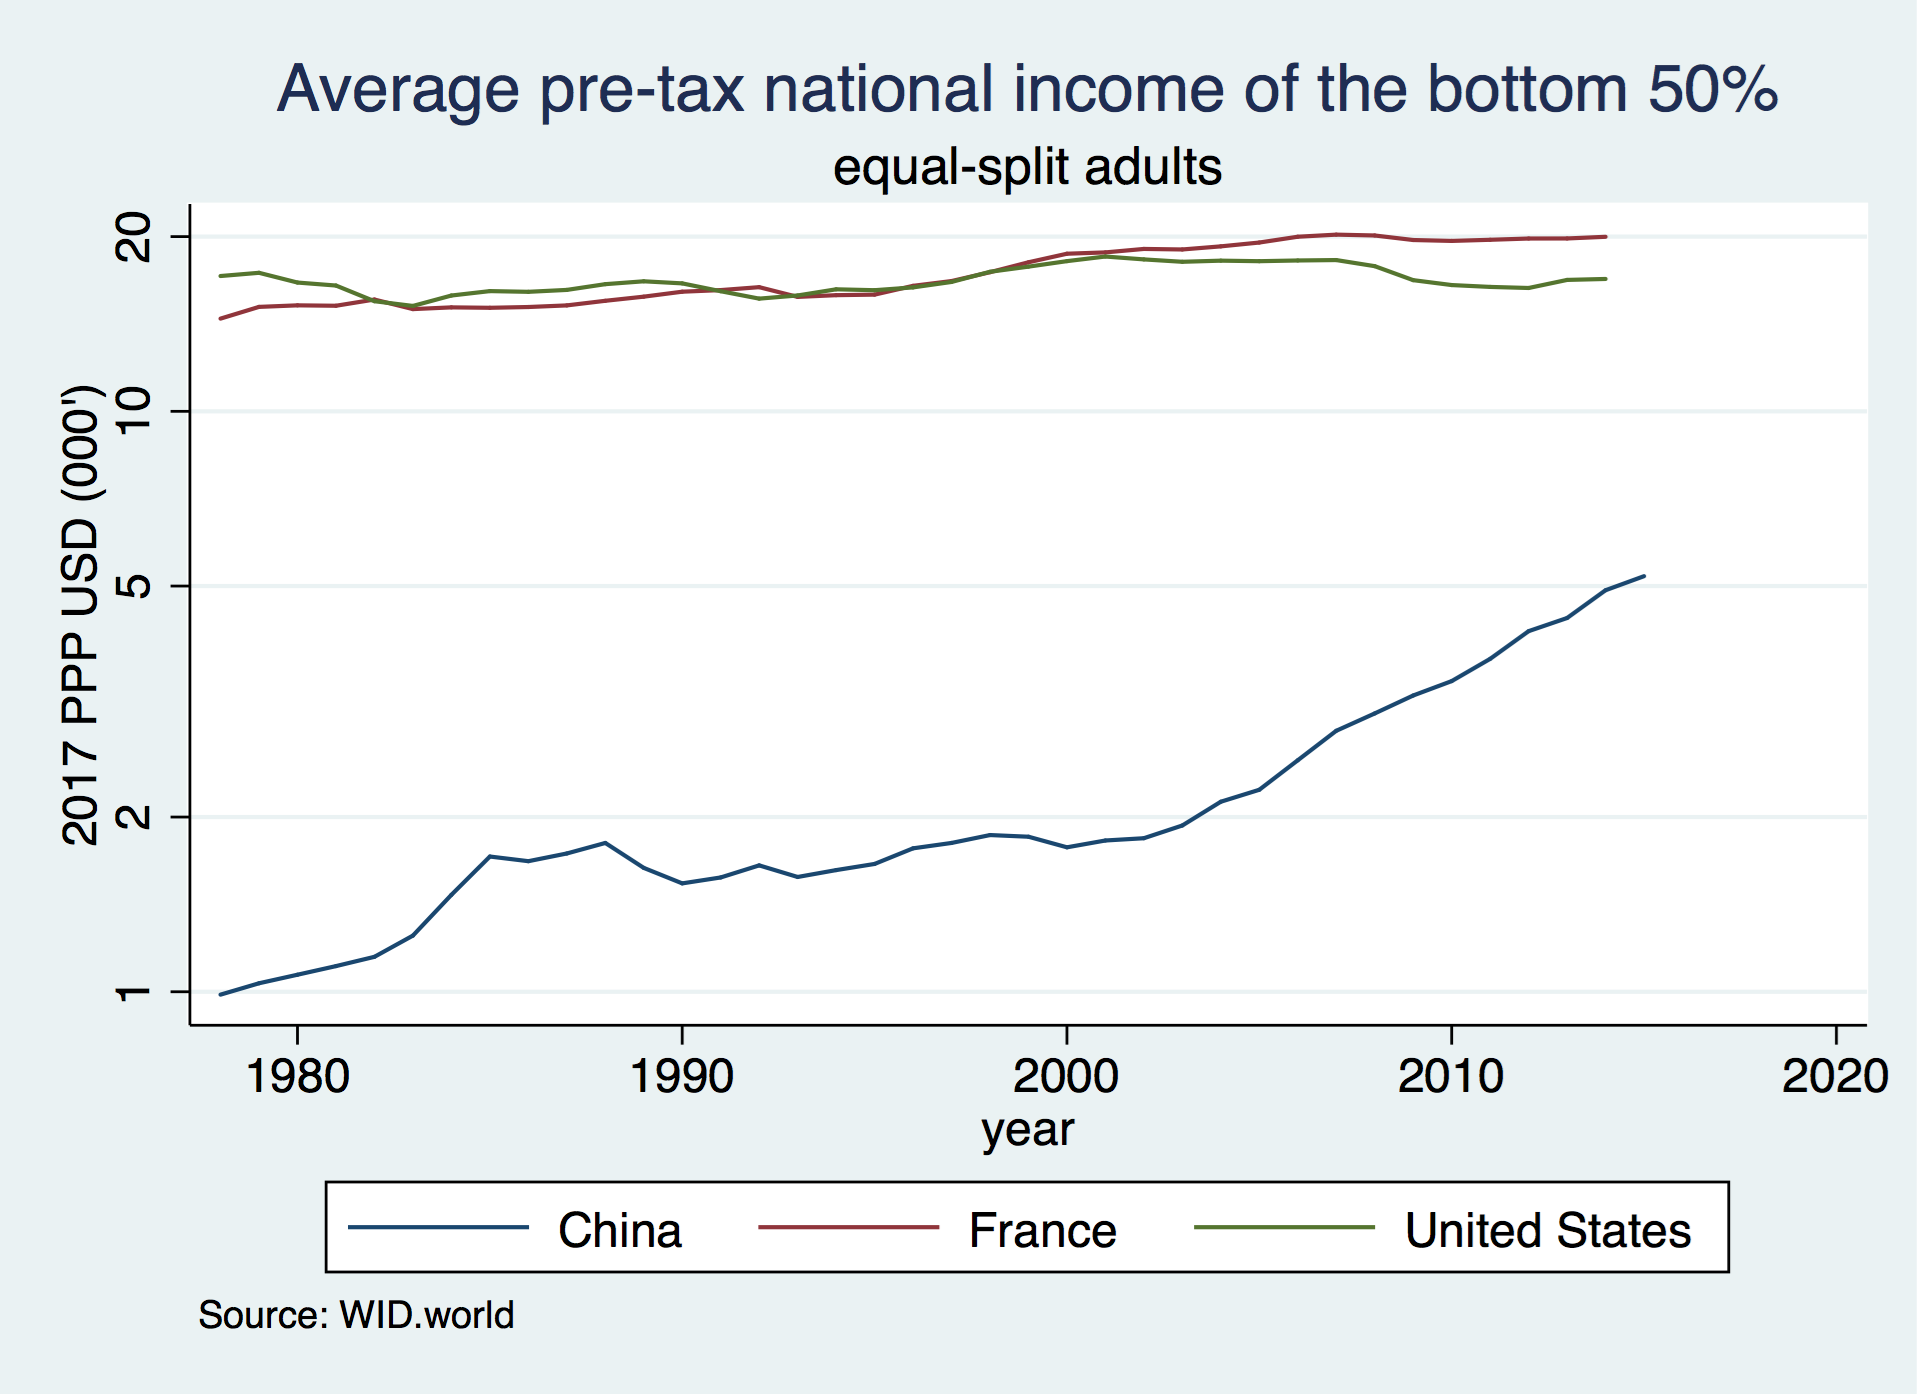
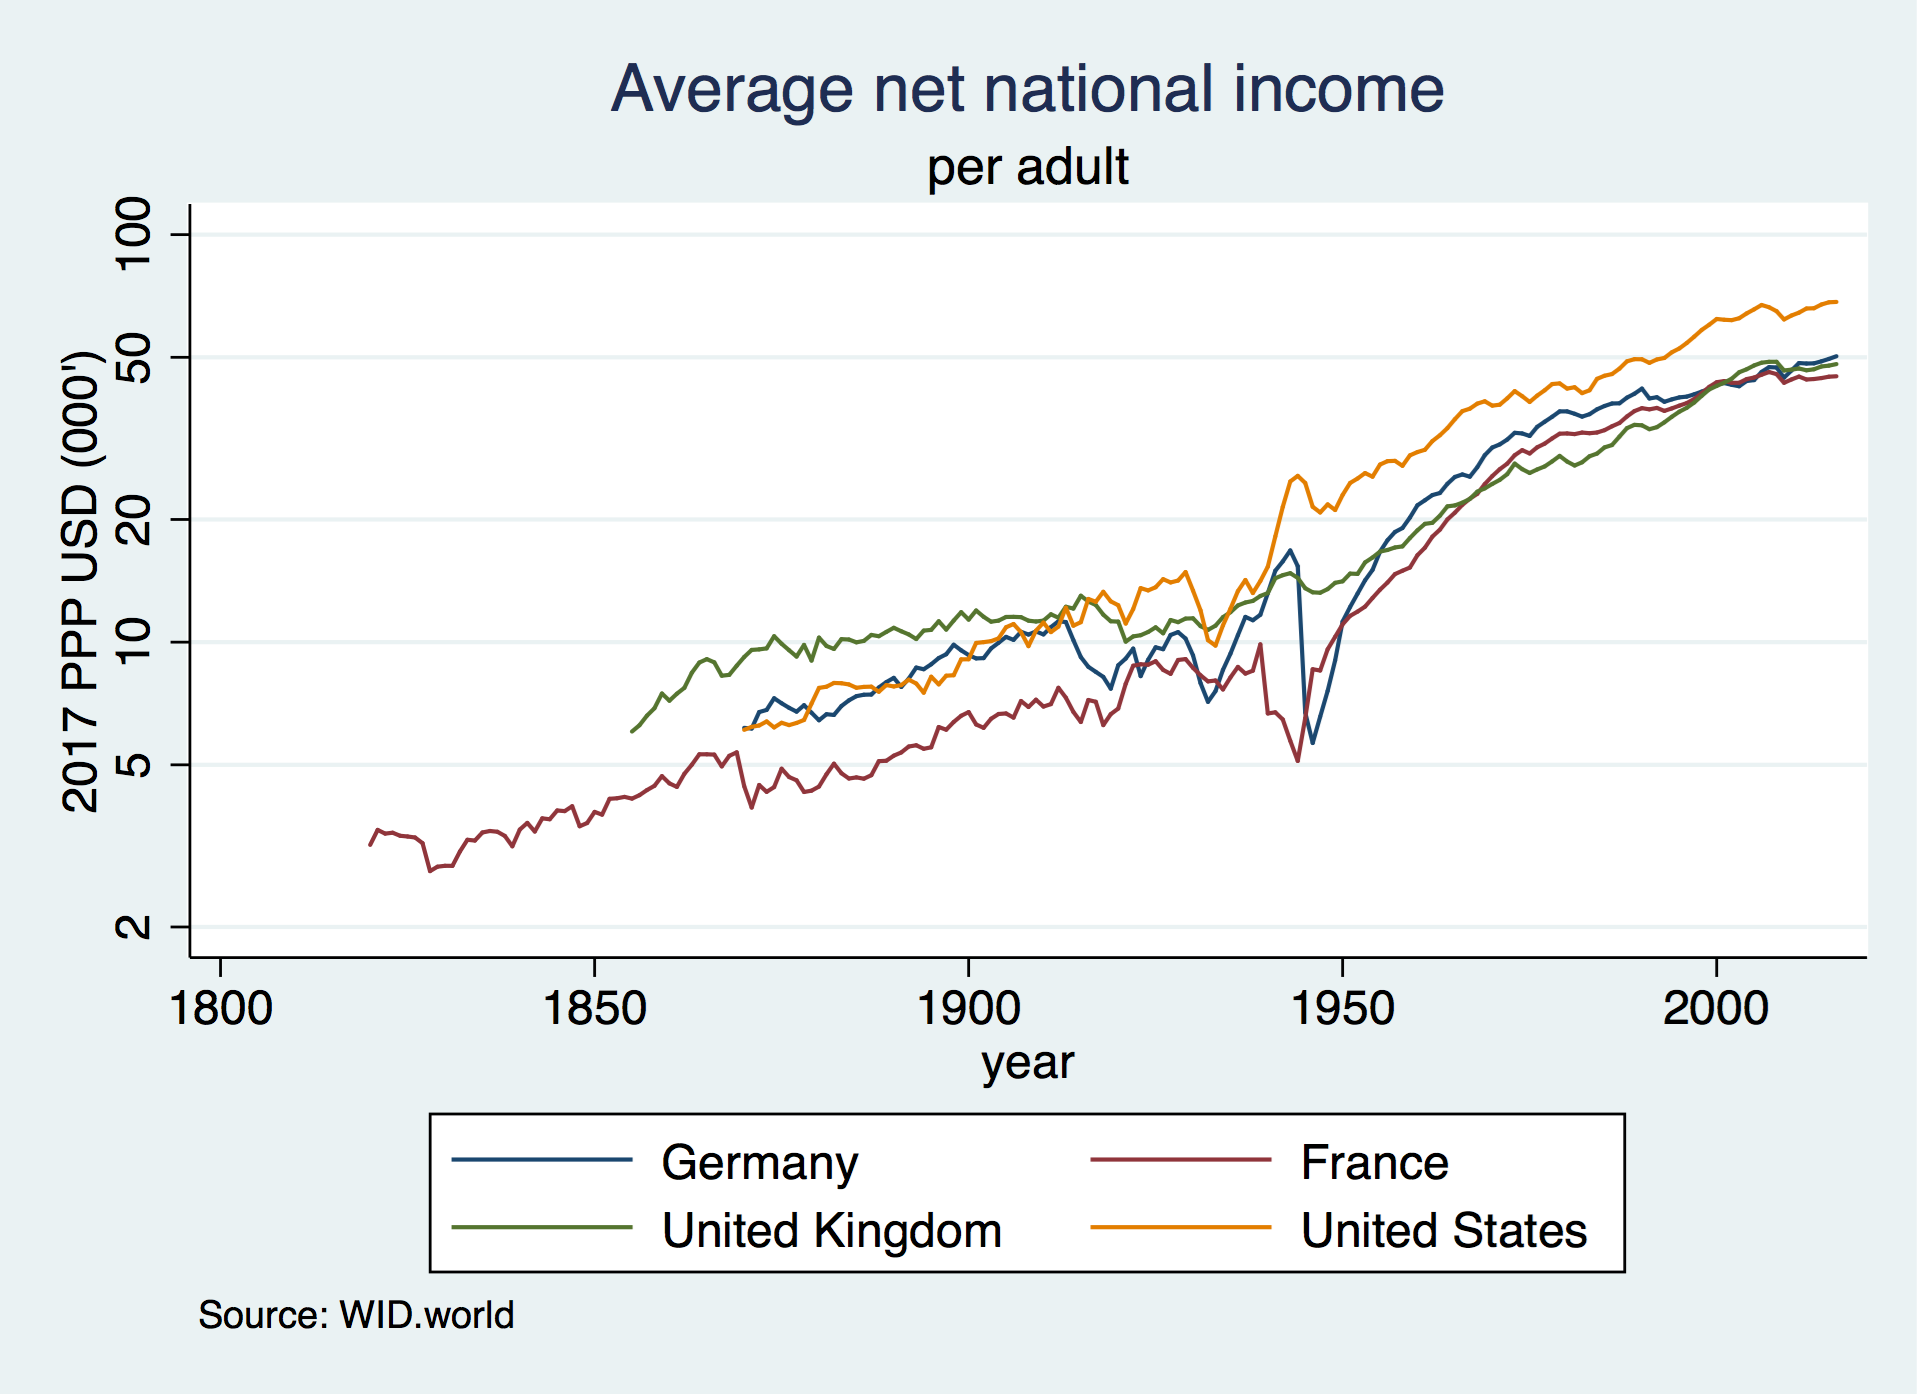
繪製法國,德國,英國和美國的每個成年人平均國民收入的平均淨國民收入的長期演變(按日誌規模):
 // Download and store the 2017 USD PPP exchange rate
wid, indicators(xlcusp) areas(FR US DE GB) year(2017) clear
rename value ppp
tempfile ppp
save " `ppp' "

// Download net national income in constant 2017 local currency
wid, indicators(anninc) areas(FR US DE GB) age(992) clear
merge n:1 country using " `ppp' " , nogenerate

// Convert to 2017 USD PPP (thousands)
replace value = value/ppp/1000

// Reshape and plot
keep country year value
reshape wide value, i(year) j(country) string
label variable valueFR " France "
label variable valueUS " United States "
label variable valueDE " Germany "
label variable valueGB " United Kingdom "

graph twoway line value * year, yscale(log) ///
	ytitle( " 2017 PPP USD (000's) " ) ylabel(2 5 10 20 50 100) ///
	title( " Average net national income " ) subtitle( " per adult " ) ///
	note( " Source: WID.world " )