pandas ta
v0.3.14b
Pandas Technical Analysis ( Pandas TA )는 130 개가 넘는 지표 및 유틸리티 기능과 60 개 이상의 TA LIB 촛대 패턴으로 Pandas 패키지를 활용하는 사용하기 쉬운 라이브러리입니다. 캔들 패턴 ( CDL_Pattern ), 단순한 이동 평균 ( SMA ) 이동 평균 수렴 발산 ( MACD ), 선체 지수 이동 평균 ( HMA ), 볼린저 밴드 ( BBands ), 균형 볼륨 ( Obver) 과 같이 일반적으로 사용되는 많은 지표가 포함됩니다. ), AROON & AROON OSCILLATOR ( AROON ), 스퀴즈 ( 스퀴즈 ) 등 .
참고 : 모든 촛대 패턴을 사용하려면 ta lib를 설치해야합니다. pip install TA-Lib . ta lib가 설치되지 않으면 내장형 촛대 패턴 만 사용할 수 있습니다.
talib=False 사용하여 표시기 당 비활성화 할 수 있습니다.ta.stdev(df["close"], length=30, talib=False) 에 대한 ta lib 계산을 비활성화합니다./pandas_ta/custom.py 의 import_dir 문서를 참조하십시오.ta.tsignals 메소드를 사용한 VectorBT 포트폴리오 백 테스트가 포함 된 Jupyter Notebook.lookahead=False 설정합니다.Pandas TA는 사용자가 TA LIB , VECTOR BT , YFINANCE 등을 포함하되 이에 국한되지 않는 일반적인 거래 패키지가 있는지 확인합니다. 대부분은 실험적 이며 더 안정화 될 때까지 깨질 가능성이 높습니다.
help(ta.ticker) 및 help(ta.yf) 과 아래의 예를 참조하십시오. pip 버전은 마지막 안정적인 릴리스입니다. 버전 : 0.3.14b
$ pip install pandas_ta최선의 선택! 버전 : 0.3.14b
$ pip install -U git+https://github.com/twopirllc/pandas-ta이것은 버그 및 기타 바람직하지 않은 부작용을 가질 수있는 개발 버전 입니다. 자신의 위험에 사용하십시오!
$ pip install -U git+https://github.com/twopirllc/pandas-ta.git@development import pandas as pd
import pandas_ta as ta
df = pd . DataFrame () # Empty DataFrame
# Load data
df = pd . read_csv ( "path/to/symbol.csv" , sep = "," )
# OR if you have yfinance installed
df = df . ta . ticker ( "aapl" )
# VWAP requires the DataFrame index to be a DatetimeIndex.
# Replace "datetime" with the appropriate column from your DataFrame
df . set_index ( pd . DatetimeIndex ( df [ "datetime" ]), inplace = True )
# Calculate Returns and append to the df DataFrame
df . ta . log_return ( cumulative = True , append = True )
df . ta . percent_return ( cumulative = True , append = True )
# New Columns with results
df . columns
# Take a peek
df . tail ()
# vv Continue Post Processing vv 일부 지표 인수는 일관성을 위해 재정렬되었습니다. 자세한 내용은 help(ta.indicator_name) 사용하거나 문서화를 개선하기 위해 풀 요청을하십시오.
 import pandas as pd
import pandas_ta as ta

# Create a DataFrame so 'ta' can be used.
df = pd . DataFrame ()

# Help about this, 'ta', extension
help ( df . ta )

# List of all indicators
df . ta . indicators ()

# Help about an indicator such as bbands
help ( ta . bbands ) Pandas Ta를 사용해 주셔서 감사합니다!
$ pip install -U git+https://github.com/twopirllc/pandas-ta귀하의 기여에 감사드립니다!
Pandas TA 에는 사용 사례 및/또는 요구 사항에 대한 기술 지표를 처리하는 세 가지 주요 "스타일"이 있습니다. 표준 , 데이터 프레임 확장 및 Pandas TA 전략 입니다. 각각 사용 편의성을 위해 추상화 수준이 증가합니다. Pandas TA 에 더 익숙해지면 Pandas TA 전략을 사용하는 단순성과 속도가 더욱 분명해질 수 있습니다. 또한 체인 또는 구성을 통해 자신의 지표를 만들 수 있습니다. 마지막으로, 각 표시기는 스타일에 관계없이 일련의 일련 또는 데이터 프레임을 대문자 밑줄 형식으로 반환합니다.
입력 열을 명시 적으로 정의하고 출력을 처리합니다.
sma10 = ta.sma(df["Close"], length=10)SMA_10donchiandf = ta.donchian(df["HIGH"], df["low"], lower_length=10, upper_length=15)DC_10_15 라는 데이터 프레임 및 열 이름 : DCL_10_15, DCM_10_15, DCU_10_15 반환합니다.ema10_ohlc4 = ta.ema(ta.ohlc4(df["Open"], df["High"], df["Low"], df["Close"]), length=10)EMA_10 이라는 시리즈를 반환하기 때문에. 필요한 경우 독창적으로 이름을 지정해야 할 수도 있습니다. df.ta 호출하면 OHLCVA 에서 OHLCVA를 자동으로 소문자 로 표시 합니다. 기본적으로 df.ta 입력 열을 직접 지정할 필요성을 제거하는 표시기 인수에 OHLCVA 를 사용합니다.
sma10 = df.ta.sma(length=10)SMA_10ema10_ohlc4 = df.ta.ema(close=df.ta.ohlc4(), length=10, suffix="OHLC4")EMA_10_OHLC4close=df.ta.ohlc4() .donchiandf = df.ta.donchian(lower_length=10, upper_length=15)DC_10_15 라는 데이터 프레임 및 열 이름 : DCL_10_15, DCM_10_15, DCU_10_15 반환합니다. 마지막 세 가지 예와 동일하지만 결과를 데이터 프레임 df 에 직접 추가합니다.
df.ta.sma(length=10, append=True)df 열 이름 : SMA_10 에 추가됩니다.df.ta.ema(close=df.ta.ohlc4(append=True), length=10, suffix="OHLC4", append=True)close=df.ta.ohlc4() .df.ta.donchian(lower_length=10, upper_length=15, append=True)df 에 추가됩니다 : DCL_10_15, DCM_10_15, DCU_10_15 . Pandas TA 전략은 전략 방법에 의해 실행되는 명명 된 지표 그룹입니다. 모든 전략은 col_names 매개 변수를 사용할 때를 제외하고 뮬리트 프로세싱을 사용합니다 (아래 참조). 다음 섹션에는 다른 유형의 전략이 있습니다.
 # (1) Create the Strategy
MyStrategy = ta . Strategy (
    name = "DCSMA10" ,
    ta = [
        { "kind" : "ohlc4" },
        { "kind" : "sma" , "length" : 10 },
        { "kind" : "donchian" , "lower_length" : 10 , "upper_length" : 15 },
        { "kind" : "ema" , "close" : "OHLC4" , "length" : 10 , "suffix" : "OHLC4" },
    ]
)

# (2) Run the Strategy
df . ta . strategy ( MyStrategy , ** kwargs )전략 클래스는 데이터 클래스를 사용하여 좋아하는 TA 표시기의 이름을 지정하고 그룹화하는 간단한 방법입니다. Pandas TA 에는 Allstrategy 및 Commonstrategy를 시작하는 데 도움이되는 두 가지 사전 제작 된 기본 전략이 제공됩니다. 전략은 조성/체인을 사용하여 Commonstrategy 만큼 간단하거나 필요에 따라 복잡 할 수 있습니다.
df 에 자동으로 추가됩니다.지표 구성/체인을 포함한 예제는 Pandas TA 전략 예제 노트를 참조하십시오.
{"kind": "indicator name"} 속성이없는 경우 Pandas TA가 소비하면 전략이 실패합니다. 철자를 확인 하십시오 . # Running the Builtin CommonStrategy as mentioned above
df . ta . strategy ( ta . CommonStrategy )
# The Default Strategy is the ta.AllStrategy. The following are equivalent:
df . ta . strategy ()
df . ta . strategy ( "All" )
df . ta . strategy ( ta . AllStrategy ) # List of indicator categories
df . ta . categories
# Running a Categorical Strategy only requires the Category name
df . ta . strategy ( "Momentum" ) # Default values for all Momentum indicators
df . ta . strategy ( "overlap" , length = 42 ) # Override all Overlap 'length' attributes # Create your own Custom Strategy
CustomStrategy = ta . Strategy (
name = "Momo and Volatility" ,
description = "SMA 50,200, BBANDS, RSI, MACD and Volume SMA 20" ,
ta = [
{ "kind" : "sma" , "length" : 50 },
{ "kind" : "sma" , "length" : 200 },
{ "kind" : "bbands" , "length" : 20 },
{ "kind" : "rsi" },
{ "kind" : "macd" , "fast" : 8 , "slow" : 21 },
{ "kind" : "sma" , "close" : "volume" , "length" : 20 , "prefix" : "VOLUME" },
]
)
# To run your "Custom Strategy"
df . ta . strategy ( CustomStrategy ) Pandas TA 전략 방법은 한 가지 예외로 모든 전략 유형의 대량 표시기 처리를 위해 멀티 프로세싱을 사용합니다 ! col_names 매개 변수를 사용하여 결과 열의 이름을 바꾸는 경우 ta 어레이의 표시기가 순서대로 실행됩니다.
 # VWAP requires the DataFrame index to be a DatetimeIndex.
# * Replace "datetime" with the appropriate column from your DataFrame
df . set_index ( pd . DatetimeIndex ( df [ "datetime" ]), inplace = True )

# Runs and appends all indicators to the current DataFrame by default
# The resultant DataFrame will be large.
df . ta . strategy ()
# Or the string "all"
df . ta . strategy ( "all" )
# Or the ta.AllStrategy
df . ta . strategy ( ta . AllStrategy )

# Use verbose if you want to make sure it is running.
df . ta . strategy ( verbose = True )

# Use timed if you want to see how long it takes to run.
df . ta . strategy ( timed = True )

# Choose the number of cores to use. Default is all available cores.
# For no multiprocessing, set this value to 0.
df . ta . cores = 4

# Maybe you do not want certain indicators.
# Just exclude (a list of) them.
df . ta . strategy ( exclude = [ "bop" , "mom" , "percent_return" , "wcp" , "pvi" ], verbose = True )

# Perhaps you want to use different values for indicators.
# This will run ALL indicators that have fast or slow as parameters.
# Check your results and exclude as necessary.
df . ta . strategy ( fast = 10 , slow = 50 , verbose = True )

# Sanity check. Make sure all the columns are there
df . columns 이것들은 멀티 프로세싱을 사용하지 않을 것임을 기억하십시오
 NonMPStrategy = ta . Strategy (
    name = "EMAs, BBs, and MACD" ,
    description = "Non Multiprocessing Strategy by rename Columns" ,
    ta = [
        { "kind" : "ema" , "length" : 8 },
        { "kind" : "ema" , "length" : 21 },
        { "kind" : "bbands" , "length" : 20 , "col_names" : ( "BBL" , "BBM" , "BBU" )},
        { "kind" : "macd" , "fast" : 8 , "slow" : 21 , "col_names" : ( "MACD" , "MACD_H" , "MACD_S" )}
    ]
)
# Run it
df . ta . strategy ( NonMPStrategy ) # Set ta to default to an adjusted column, 'adj_close', overriding default 'close'.
df . ta . adjusted = "adj_close"
df . ta . sma ( length = 10 , append = True )
# To reset back to 'close', set adjusted back to None.
df . ta . adjusted = None # List of Pandas TA categories.
df . ta . categories # Set the number of cores to use for strategy multiprocessing
# Defaults to the number of cpus you have.
df . ta . cores = 4
# Set the number of cores to 0 for no multiprocessing.
df . ta . cores = 0
# Returns the number of cores you set or your default number of cpus.
df . ta . cores # The 'datetime_ordered' property returns True if the DataFrame
# index is of Pandas datetime64 and df.index[0] < df.index[-1].
# Otherwise it returns False.
df . ta . datetime_ordered # Sets the Exchange to use when calculating the last_run property. Default: "NYSE"
df . ta . exchange
# Set the Exchange to use.
# Available Exchanges: "ASX", "BMF", "DIFX", "FWB", "HKE", "JSE", "LSE", "NSE", "NYSE", "NZSX", "RTS", "SGX", "SSE", "TSE", "TSX"
df . ta . exchange = "LSE" # Returns the time Pandas TA was last run as a string.
df . ta . last_run # The 'reverse' is a helper property that returns the DataFrame
# in reverse order.
df . ta . reverse # Applying a prefix to the name of an indicator.
prehl2 = df . ta . hl2 ( prefix = "pre" )
print ( prehl2 . name ) # "pre_HL2"
# Applying a suffix to the name of an indicator.
endhl2 = df . ta . hl2 ( suffix = "post" )
print ( endhl2 . name ) # "HL2_post"
# Applying a prefix and suffix to the name of an indicator.
bothhl2 = df . ta . hl2 ( prefix = "pre" , suffix = "post" )
print ( bothhl2 . name ) # "pre_HL2_post" # Returns the time range of the DataFrame as a float.
# By default, it returns the time in "years"
df . ta . time_range
# Available time_ranges include: "years", "months", "weeks", "days", "hours", "minutes". "seconds"
df . ta . time_range = "days"
df . ta . time_range # prints DataFrame time in "days" as float # Sets the DataFrame index to UTC format.
df . ta . to_utc import numpy as np
# Add constant '1' to the DataFrame
df . ta . constants ( True , [ 1 ])
# Remove constant '1' to the DataFrame
df . ta . constants ( False , [ 1 ])
# Adding constants for charting
import numpy as np
chart_lines = np . append ( np . arange ( - 4 , 5 , 1 ), np . arange ( - 100 , 110 , 10 ))
df . ta . constants ( True , chart_lines )
# Removing some constants from the DataFrame
df . ta . constants ( False , np . array ([ - 60 , - 40 , 40 , 60 ])) # Prints the indicators and utility functions
df . ta . indicators ()
# Returns a list of indicators and utility functions
ind_list = df . ta . indicators ( as_list = True )
# Prints the indicators and utility functions that are not in the excluded list
df . ta . indicators ( exclude = [ "cg" , "pgo" , "ui" ])
# Returns a list of the indicators and utility functions that are not in the excluded list
smaller_list = df . ta . indicators ( exclude = [ "cg" , "pgo" , "ui" ], as_list = True ) # Download Chart history using yfinance. (pip install yfinance) https://github.com/ranaroussi/yfinance
# It uses the same keyword arguments as yfinance (excluding start and end)
df = df . ta . ticker ( "aapl" ) # Default ticker is "SPY"
# Period is used instead of start/end
# Valid periods: 1d,5d,1mo,3mo,6mo,1y,2y,5y,10y,ytd,max
# Default: "max"
df = df . ta . ticker ( "aapl" , period = "1y" ) # Gets this past year
# History by Interval by interval (including intraday if period < 60 days)
# Valid intervals: 1m,2m,5m,15m,30m,60m,90m,1h,1d,5d,1wk,1mo,3mo
# Default: "1d"
df = df . ta . ticker ( "aapl" , period = "1y" , interval = "1wk" ) # Gets this past year in weeks
df = df . ta . ticker ( "aapl" , period = "1mo" , interval = "1h" ) # Gets this past month in hours
# BUT WAIT!! THERE'S MORE!!
help ( ta . yf ) 대담하지 않은 패턴, ta-lib를 설치해야합니다 : pip install TA-Lib
 # Get all candle patterns (This is the default behaviour)
df = df . ta . cdl_pattern ( name = "all" )

# Get only one pattern
df = df . ta . cdl_pattern ( name = "doji" )

# Get some patterns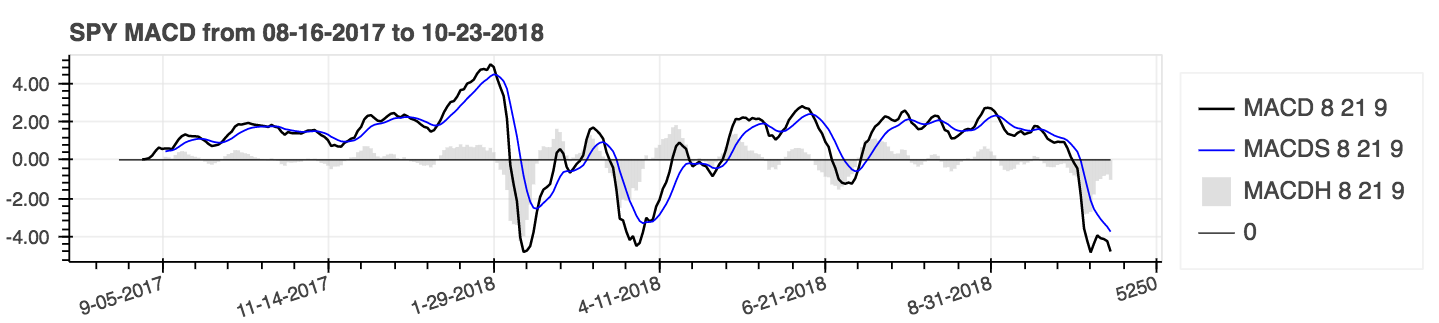
df = df . ta . cdl_pattern ( name = [ "doji" , "inside" ])ta.linreg(series, r=True)lazybear=True 사용하여 LazyBear를 활성화하십시오df.ta.strategy() 에서 제외.| 이동 평균 수렴 발산 (MACD) |
|---|
 |
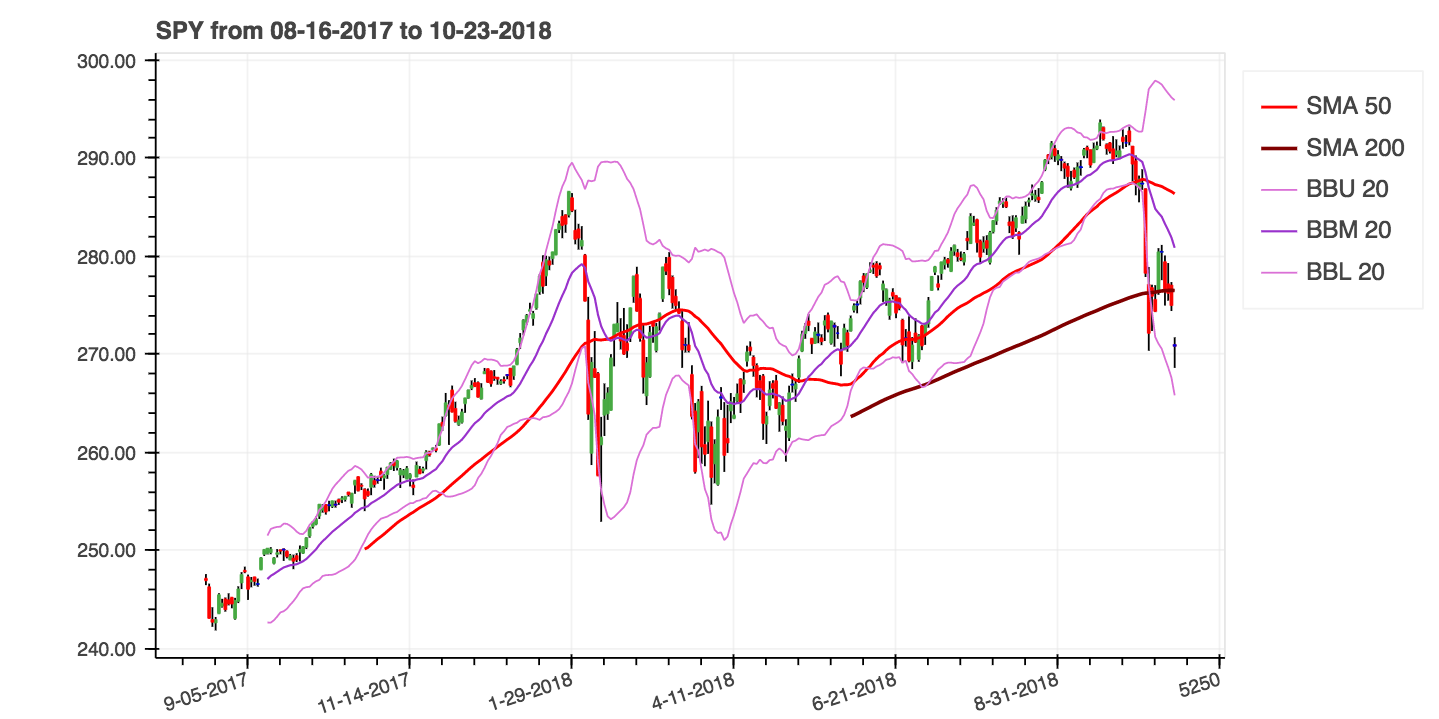
help(ta.ichimoku) .lookahead=False Chikou Span 열을 떨어 뜨려 잠재적 데이터 누출을 방지합니다.| 간단한 이동 평균 (SMA) 및 Bollinger 밴드 (BBands) |
|---|
|
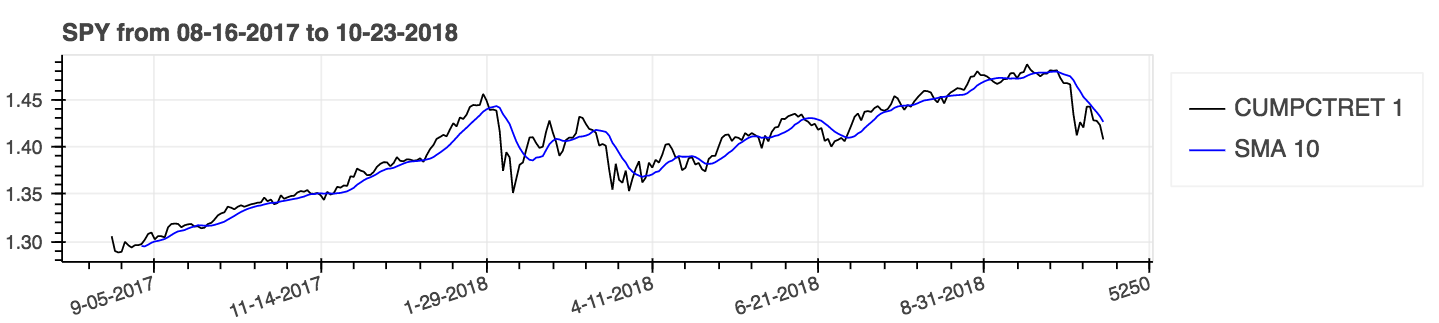
누적 결과에 대해서는 매개 변수를 사용하십시오. 누적 = true .
| 단순한 이동 평균 (SMA)을 가진 백분율 수익률 (누적) |
|---|
 |
| Z 점수 |
|---|
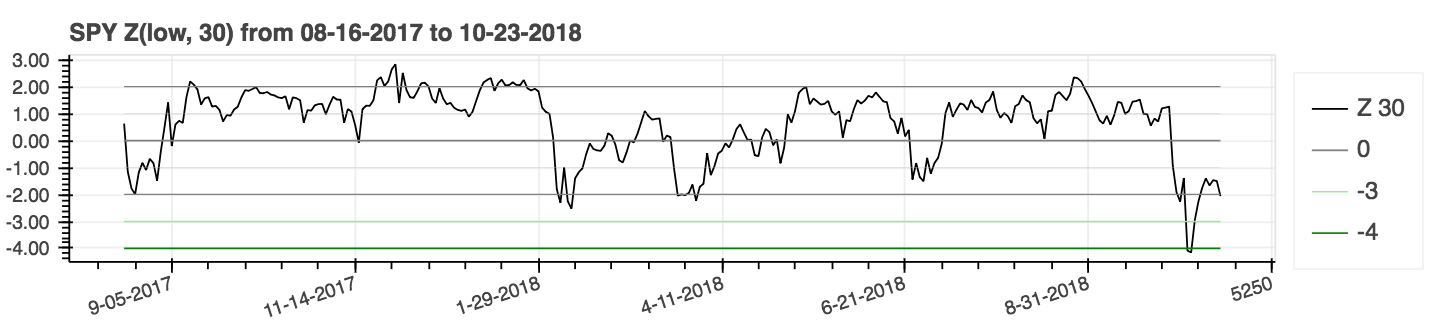 |
lookahead=False 설정하십시오.| 평균 방향 운동 지수 (ADX) |
|---|
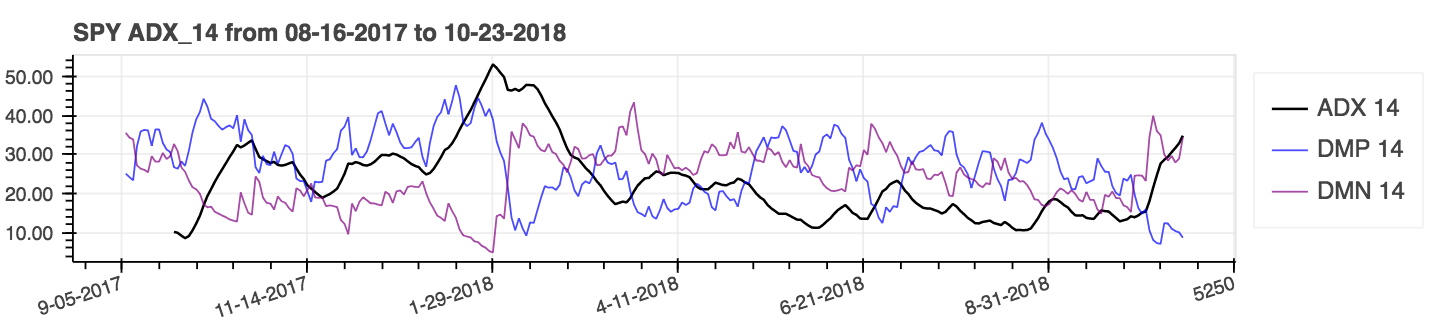 |
| 평균 True 범위 (ATR) |
|---|
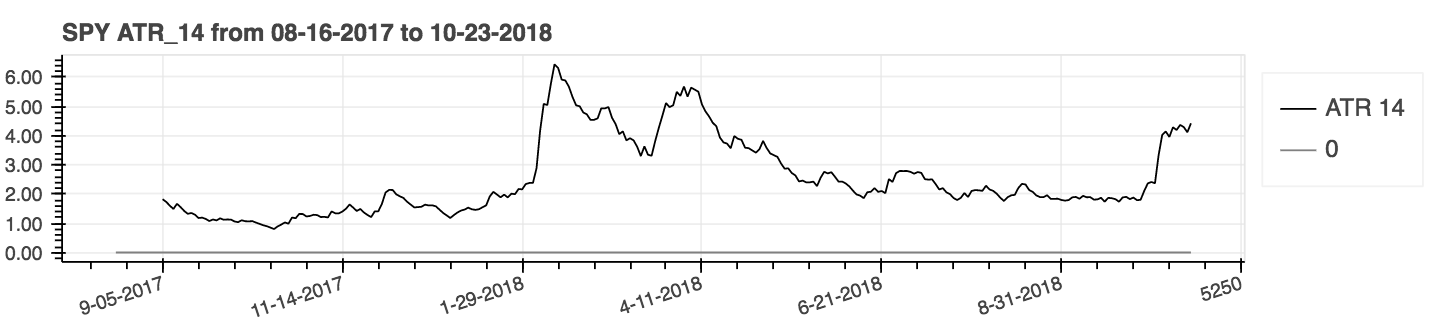 |
| 균형 대량 (Obv) |
|---|
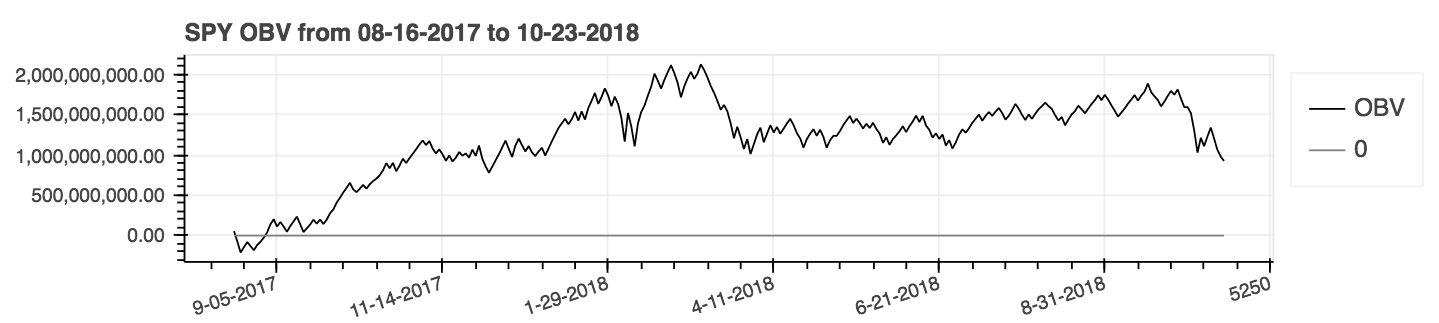 |
성능 지표 는 패키지에 새로 추가되었으며 결과적으로 신뢰할 수 없을 것입니다. 자신의 위험에 사용하십시오. 이 메트릭은 플로트 를 반환하며 데이터 프레임 확장의 일부가 아닙니다 . 그들은 표준 방식이라고합니다. 예를 들어:
 import pandas_ta as ta
result = ta . cagr ( df . close ) Vectorbt 의 포트폴리오 from_signals 메소드와 쉽게 통합하기 위해 ta.trend_return 메소드는 ta.tsignals 메소드로 대체되어 거래 신호 생성을 단순화했습니다. 포괄적 인 예는 예제 디렉토리의 Pandas TA와 함께 Jupyter Notebook Vectorbt 백 테스트 예제를 참조하십시오.
 import pandas as pd
import pandas_ta as ta
import vectorbt as vbt

df = pd . DataFrame (). ta . ticker ( "AAPL" ) # requires 'yfinance' installed

# Create the "Golden Cross"
df [ "GC" ] = df . ta . sma ( 50 , append = True ) > df . ta . sma ( 200 , append = True )

# Create boolean Signals(TS_Entries, TS_Exits) for vectorbt
golden = df . ta . tsignals ( df . GC , asbool = True , append = True )

# Sanity Check (Ensure data exists)
print ( df )

# Create the Signals Portfolio
pf = vbt . Portfolio . from_signals ( df . close , entries = golden . TS_Entries , exits = golden . TS_Exits , freq = "D" , init_cash = 100_000 , fees = 0.0025 , slippage = 0.0025 )

# Print Portfolio Stats and Return Stats
print ( pf . stats ())
print ( pf . returns_stats ())ta.ma() 와 함께 더 많은 이동 평균 선택으로 mamode Kwarg를 업데이트했습니다. 간단하게하기 위해 모든 선택은 단일 소스 이동 평균 입니다. 이것은 주로 mamode Kwarg가 있는 지표가 사용하는 내부 유틸리티입니다. 여기에는 Accbands , Amat , AOBV , ATR , BBands , BIAS , EFI , HILO , KC , NART , QQE , RVI 및 Thermo ; 기본 mamode 매개 변수는 변경되지 않았습니다. 그러나 필요한 경우 ta.ma() 도 사용자가 사용할 수 있습니다. 자세한 정보 : help(ta.ma)to_utc 를 추가했습니다. 참조 : help(ta.to_utc) 이제 Pandas TA Dataframe 속성으로 데이터 프레임 인덱스를 UTC로 쉽게 변환합니다. close > sma(close, 50) 와 같은 트렌드 시리즈가 주어지면 해당 추세의 트렌드, 거래 항목 및 무역 출구를 반환하여 asbool=True 설정하여 부울 거래 및 출구를 얻음으로써 Vectorbt 와 호환되도록합니다. help(ta.tsignals) help(ta.alma) 거래 계정 또는 자금. help(ta.drawdown) 참조help(ta.cdl_pattern)help(ta.cdl_z)help(ta.cti) 참조.help(ta.xsignals)help(ta.dm)help(ta.ebsw)help(ta.jma) 제거하려고 시도합니다.help(ta.kvo) 과 비교하여 시장의 가격 반전을 예측하도록 설계되었습니다.help(ta.stc)help(ta.squeeze_pro)df.ta.strategy() 에서 발표되었습니다. help(ta.td_seq)help(ta.tos_stdevall)help(ta.vhf) 참조. mamode mode 로 이름이 변경되었습니다. help(ta.accbands) 참조하십시오.mamode 옵션이있는 mamode 추가되었습니다. 새로운 인수 lensig TradingView의 내장 ADX 지표처럼 작동합니다. help(ta.adx) 참조하십시오.drift 인수와보다 설명적인 열 이름이 추가되었습니다.mamode 이제 " RMA "이며 TradingView와 동일한 mamode 옵션이 있습니다. help(ta.atr) 참조하십시오.ddoff . 또한 BB 퍼센트 (BBP)도 최종 열로 포함되었습니다. 기본값은 0입니다. help(ta.bbands) 참조하십시오.ln . 기본값은 False입니다. help(ta.chop) 참조하십시오.True 으로 tvmode 추가되었습니다. tvmode=False 인 경우 CKSP는 기본값을 가진 "새로운 기술 거래자"를 구현합니다. help(ta.cksp) 참조하십시오.talib Ta Lib의 버전을 사용하고 ta lib가 설치된 경우. 기본값은 사실입니다. help(ta.cmo) 참조하십시오.length 에 걸쳐 지속적으로 감소하는지 strict 점검합니다. 기본값 : False . percent 인수는 또한 기본값과 함께 추가되었습니다. help(ta.decreasing) 참조하십시오.length 동안 지속적으로 증가하는지 strict 점검. 기본값 : False . percent 인수는 또한 기본값과 함께 추가되었습니다. help(ta.increasing) .help(ta.kvo) 참조하십시오.as_strided 메소드 또는 최신 sliding_window_view 메소드를 사용할지 여부를 결정합니다. 이는 Google Colab의 문제를 해결해야하며 문제 #285 및 #329에서 논의 된 바와 같이 Tensorflow의 종속성뿐만 아니라 의존성 업데이트가 지연되었습니다.asmode MACD의 버전으로 사용합니다. 기본값은 False입니다. help(ta.macd) 참조하십시오.sar 과 일치하는 버그 수정 및 조정. 가속 계수를 초기화하기위한 새로운 인수 af0 . help(ta.psar) 참조하십시오.mamode 포함 시켰습니다. 기본값은 TA Lib와 일치하는 SMA 입니다. help(ta.ppo) 참조하십시오.13 및 기본 EMA를 가진 신호 MA 모드 mamode 있는 signal 추가되었습니다. help(ta.tsi) 참조하십시오.help(ta.vp) 참조하십시오.help(ta.vwma) 참조하십시오.anchor 라는 새로운 매개 변수가 추가되었습니다. 기본값 : "Daily"의 경우 "D". 추가 옵션은 타임 서리 오프셋 별칭을 참조하십시오. DateTimeIndex가 DateTimeIndex가 필요합니다 . help(ta.vwap) 참조하십시오.help(ta.vwma) 참조하십시오.Z_length 에서 ZS_length 로 변경했습니다. help(ta.zscore) 참조하십시오.원래 ta-lib | TradingView | 시에라 차트 | MQL5 | FM 실험실 | Pro Real Code | 사용자 42
패키지처럼 관대하다고 느끼거나 더 성숙한 패키지가되기를 원하십니까?


