cufflinks
1.0.0
ไลบรารีนี้เชื่อมโยงพลังของการวางแผนด้วยความยืดหยุ่นของแพนด้าเพื่อการพล็อตได้ง่าย
ห้องสมุดนี้มีอยู่ใน https://github.com/santosjorge/cufflinks
บทช่วยสอนนี้สันนิษฐานว่าข้อมูลรับรองผู้ใช้ที่วางแผนไว้ได้รับการกำหนดค่าแล้วตามที่ระบุไว้ในคู่มือการเริ่มต้นใช้งาน
สนับสนุนการวางแผน 4.x
Cufflinks ไม่สามารถใช้งานร่วมกับ plotly 3.x ได้อีกต่อไป
สนับสนุน Plotly 3.0
ผู้ช่วย iplot ใหม่ เพื่อดูรายการที่ครอบคลุมของพารามิเตอร์ cf.help ()
 # For a list of supported figures
cf . help ()
# Or to see the parameters supported that apply to a given figure try
cf . help ( 'scatter' )
cf . help ( 'candle' ) #etcลบการพึ่งพาอาศัยกันใน ta-lib ห้องสมุดนี้ไม่จำเป็นอีกต่อไป การศึกษาทั้งหมดได้รับการเขียนใหม่ใน Python
QuantFigure เป็นคลาสใหม่ที่จะสร้างวัตถุกราฟที่มีการคงอยู่ พารามิเตอร์สามารถเพิ่ม/แก้ไขได้ที่จุดใดก็ตามซึ่งสามารถทำได้ง่ายเท่า:
 df = cf . datagen . ohlc ()
qf = cf . QuantFig ( df , title = 'First Quant Figure' , legend = 'top' , name = 'GS' )
qf . add_bollinger_bands ()
qf . iplot ()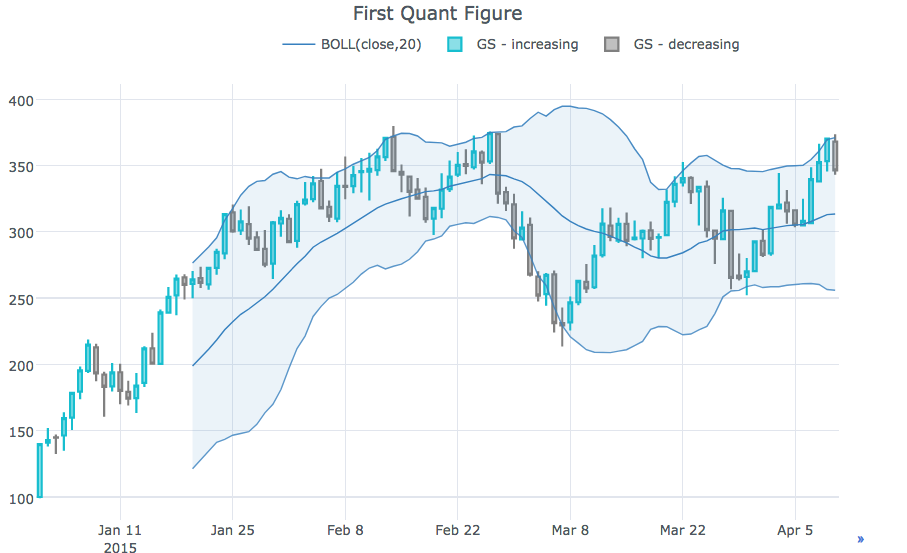
 qf . add_sma ([ 10 , 20 ], width = 2 , color = [ 'green' , 'lightgreen' ], legendgroup = True )
qf . add_rsi ( periods = 20 , color = 'java' )
qf . add_bollinger_bands ( periods = 20 , boll_std = 2 , colors = [ 'magenta' , 'grey' ], fill = True )
qf . add_volume ()
qf . add_macd ()
qf . iplot ()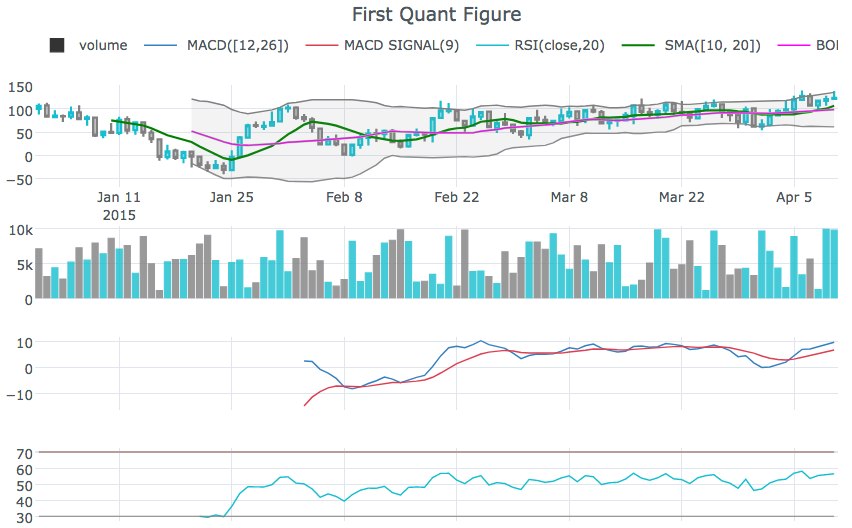
rangeslider เพื่อแสดงแถบเลื่อนช่วงวันที่ที่ด้านล่างcf.datagen.ohlc().iplot(kind='candle',rangeslider=True)rangeselector เพื่อแสดงปุ่มเพื่อเปลี่ยนช่วงวันที่ที่แสดงcf.datagen.ohlc(500).iplot(kind='candle', rangeselector={ 'steps':['1y','2 months','5 weeks','ytd','2mtd','reset'], 'bgcolor' : ('grey',.3), 'x': 0.3 , 'y' : 0.95})fontsize , fontcolor , textanglecf.datagen.lines(1,mode='stocks').iplot(kind='line', annotations={'2015-02-02':'Market Crash', '2015-03-01':'Recovery'}, textangle=-70,fontsize=13,fontcolor='grey')cf.datagen.lines(1,mode='stocks').iplot(kind='line', annotations=[{'text':'exactly here','x':'0.2', 'xref':'paper','arrowhead':2, 'textangle':-10,'ay':150,'arrowcolor':'red'}])Figure.iplot() เพื่อพล็อตตัวเลขcf.datagen.ohlc().iplot(kind='candle')iplotxrange , yrange และ zrange ใน iplot และ getLayoutcf.datagen.lines(1).iplot(yrange=[5,15])layout_update ใน iplot และ getLayout เพื่ออัปเดตค่า Layout ใด ๆ อย่างชัดเจนดูสมุดบันทึก ipython
cf.datagen.pie().iplot(kind='pie',labels='labels',values='values')datagen.ohlc()ohlc=cf.datagen.ohlc()ohlc.iplot(kind='candle',up_color='blue',down_color='red')ohlc=cf.datagen.ohlc()ohlc.iplot(kind='ohlc',up_color='blue',down_color='red')df=pd.DataFrame([x**2] for x in range(100))df.iplot(kind='lines',logy=True)cf.datagen.lines(1,5).iplot(kind='bar',error_y=[1,2,3.5,2,2])cf.datagen.lines(1,5).iplot(kind='bar',error_y=20, error_type='percent')cf.datagen.lines(1).iplot(kind='lines',error_y=20,error_type='continuous_percent')cf.datagen.lines(1).iplot(kind='lines',error_y=10,error_type='continuous',color='blue')cf.datagen.lines(1,500).ta_plot(study='sma',periods=[13,21,55])cf.datagen.lines(1,200).ta_plot(study='boll',periods=14)cf.datagen.lines(1,200).ta_plot(study='rsi',periods=14)cf.datagen.lines(1,200).ta_plot(study='macd',fast_period=12,slow_period=26, signal_period=9)cf.go_offline()cf.go_online()cf.iplot(figure,online=True) (เพื่อบังคับออนไลน์ในขณะที่อยู่ในโหมดออฟไลน์)fig=cf.datagen.lines(3,columns=['a','b','c']).figure()fig=fig.set_axis('b',side='right')cf.iplot(fig)cufflinks.set_config_file(theme='pearl')cufflinks.datagen.lines(5).iplot(theme='ggplot')cufflinks.datagen.lines(2).iplot(kind='barh',barmode='stack',bargap=.1)cufflinks.datagen.histogram().iplot(kind='histogram',orientation='h',norm='probability')cufflinks.datagen.lines(4).iplot(kind='area',fill=True,opacity=1)cufflinks.datagen.histogram(4).iplot(kind='histogram',subplots=True,bins=50)cufflinks.datagen.lines(4).iplot(subplots=True,shape=(4,1),shared_xaxes=True,vertical_spacing=.02,fill=True)cufflinks.datagen.lines(4,1000).scatter_matrix()cufflinks.datagen.lines(3).iplot(hline=[2,3])cufflinks.datagen.lines(3).iplot(hline=dict(y=2,color='blue',width=3))cufflinks.datagen.lines(3).iplot(hspan=(-1,2))cufflinks.datagen.lines(3).iplot(hspan=dict(y0=-1,y1=2,color='orange',fill=True,opacity=.4))cufflinks.set_config_file(world_readable=True)cufflinks.datagen.lines(2).iplot(kind='spread')cufflinks.datagen.heatmap().iplot(kind='heatmap')cufflinks.datagen.bubble(4).iplot(kind='bubble',x='x',y='y',text='text',size='size',categories='categories')cufflinks.datagen.bubble3d(4).iplot(kind='bubble3d',x='x',y='y',z='z',text='text',size='size',categories='categories')cufflinks.datagen.box().iplot(kind='box')cufflinks.datagen.surface().iplot(kind='surface')cufflinks.datagen.scatter3d().iplot(kind='scatter3d',x='x',y='y',z='z',text='text',categories='categories')cufflinks.datagen.histogram(2).iplot(kind='histogram')cufflinks.datagencufflinks.to_df(Figure)iplot(colorscale='accent') เพื่อพล็อตแผนภูมิโดยใช้เครื่องชั่งสี ที่เน้นเสียงiplot(colors=['pink','red','yellow'])

