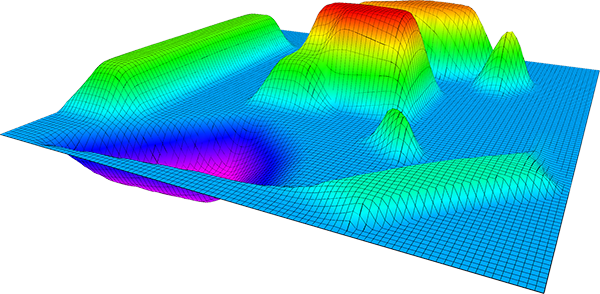
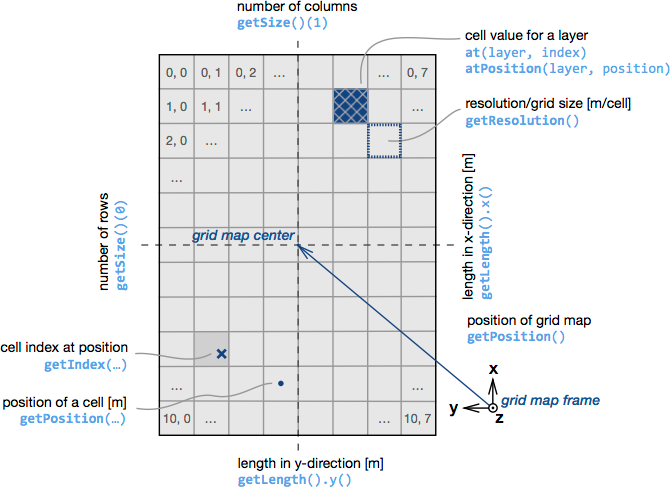
這是一個具有 ROS 介面的 C++ 函式庫,用於管理具有多個資料層的二維網格地圖。它專為移動機器人測繪而設計,用於存儲高程、方差、顏色、摩擦係數、立足點質量、表面法線、可遍歷性等數據。的高程測繪包。
特徵:
這是研究代碼,預計它會經常更改,並且否認對特定目的的任何適用性。
原始碼根據 BSD 3-Clause 許可證發布。
作者:彼得‧範考瑟
隸屬關係:ANYbotics
維修者:Maximilian Wulf,[email protected],Magnus Gärtner,[email protected]
貢獻者:Simone Arreghini、Tanja Baumann、Jeff Delmerico、Remo Diethelm、Perry Franklin、Magnus Gärtner、Ruben Grandia、Edo Jelavic、Dominic Jud、Ralph Kaestner、Philipp Krüsi、Alex Millane、Daniel Stonier、Elena Stumm、Ralph Kaermelinger、Christos利迪斯
該計畫最初是在蘇黎世聯邦理工學院(自主系統實驗室和機器人系統實驗室)開發的。
這項工作是 ANYmal Research 的一部分,ANYmal Research 是一個推進腿式機器人技術的社群。
如果您在學術背景下使用這項工作,請引用以下出版物:
P. Fankhauser 和 M. Hutter, “通用網格地圖庫:粗糙地形導航的實施和用例” ,載於機器人操作系統 (ROS) – 完整參考(第 1 卷),A. Koubaa(編輯),Springer , 2016。
 @incollection{Fankhauser2016GridMapLibrary,
  author = {Fankhauser, P{'{e}}ter and Hutter, Marco},
  booktitle = {Robot Operating System (ROS) – The Complete Reference (Volume 1)},
  title = {{A Universal Grid Map Library: Implementation and Use Case for Rough Terrain Navigation}},
  chapter = {5},
  editor = {Koubaa, Anis},
  publisher = {Springer},
  year = {2016},
  isbn = {978-3-319-26052-5},
  doi = {10.1007/978-3-319-26054-9{_}5},
  url = {http://www.springer.com/de/book/9783319260525}
}
目前維護這些分支:
ROS 1 的拉取請求應針對master 。 ROS 2 的拉取請求應以rolling為目標,如果不破壞 ABI,則將向後移植。
本書章節介紹了網格地圖庫,包括教學。
C++ API 記錄如下:
要像 Debian 軟體包一樣安裝網格地圖庫中的所有軟體包
sudo apt-get install ros-$ROS_DISTRO-grid-map
grid_map_core套件僅依賴線性代數函式庫 Eigen。
sudo apt-get install libeigen3-dev
其他軟體包也依賴 ROS 標準安裝( roscpp 、 tf 、 filters 、 sensor_msgs 、 nav_msgs和cv_bridge )。其他格式特定的轉換套件(例如grid_map_cv 、 grid_map_pcl等)取決於下面的套件概述中描述的套件。
要從原始程式碼構建,請將此存儲庫中的最新版本克隆到catkin工作區中,並使用以下命令編譯包
 cd catkin_ws/src
git clone https://github.com/anybotics/grid_map.git
cd ../
catkin_make
為了最大限度地提高效能,請確保在發布模式下建置。您可以透過設定指定建置類型
catkin_make -DCMAKE_BUILD_TYPE=Release
此儲存庫由以下套件組成:
GridMap類別和幾個輔助類別(例如迭代器)。該套件的實作沒有 ROS 依賴項。附加轉換包:
運行單元測試
catkin_make run_tests_grid_map_core run_tests_grid_map_ros
或者
catkin build grid_map --no-deps --verbose --catkin-make-args run_tests
如果您使用柔荑花工具。
grid_map_demos套件包含幾個演示節點。使用此程式碼來驗證網格地圖包的安裝並讓您開始自己使用該庫。
simple_demo示範了使用網格圖庫的簡單範例。該 ROS 節點創建網格地圖、向其中添加資料並發布它。若要在 RViz 中查看結果,請執行命令
roslaunch grid_map_demos simple_demo.launch
tutorial_demo是庫功能的擴充示範。啟動tutorial_demo
roslaunch grid_map_demos tutorial_demo.launch
iterators_demo展示了網格地圖迭代器的用法。啟動它
roslaunch grid_map_demos iterators_demo.launch
image_to_gridmap_demo示範如何將資料從影像轉換為網格地圖。開始演示
roslaunch grid_map_demos image_to_gridmap_demo.launch

grid_map_to_image_demo示範如何將網格地圖圖層儲存到影像。開始演示
rosrun grid_map_demos grid_map_to_image_demo _grid_map_topic:=/grid_map _file:=/home/$USER/Desktop/grid_map_image.png
opencv_demo演示了借助 OpenCV 函數進行地圖操作。開始演示
roslaunch grid_map_demos opencv_demo.launch

resolution_change_demo展示如何借助 OpenCV 影像縮放方法來變更網格圖的解析度。查看結果,使用
roslaunch grid_map_demos resolution_change_demo.launch
filters_demo使用 ROS 過濾器鏈來處理網格地圖。從地形圖的高程開始,示範使用多個濾鏡來展示如何計算表面法線、使用修復來填充孔洞、平滑/模糊地圖以及使用數學表達式來檢測邊緣、計算粗糙度和可遍歷性。過濾器鏈設定在filters_demo_filter_chain.yaml檔案中配置。啟動演示
roslaunch grid_map_demos filters_demo.launch
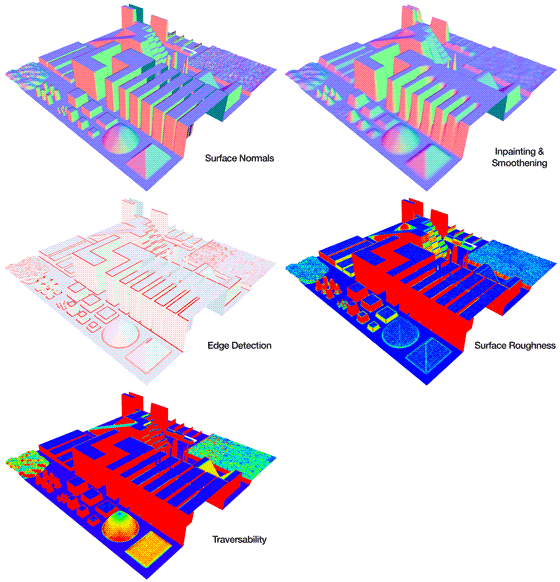
有關網格地圖過濾器的更多信息,請參閱 grid_map_filters。
interpolation_demo顯示了結果表面上不同插值方法的結果。啟動demo,使用
roslaunch grid_map_demos interpolation_demo.launch
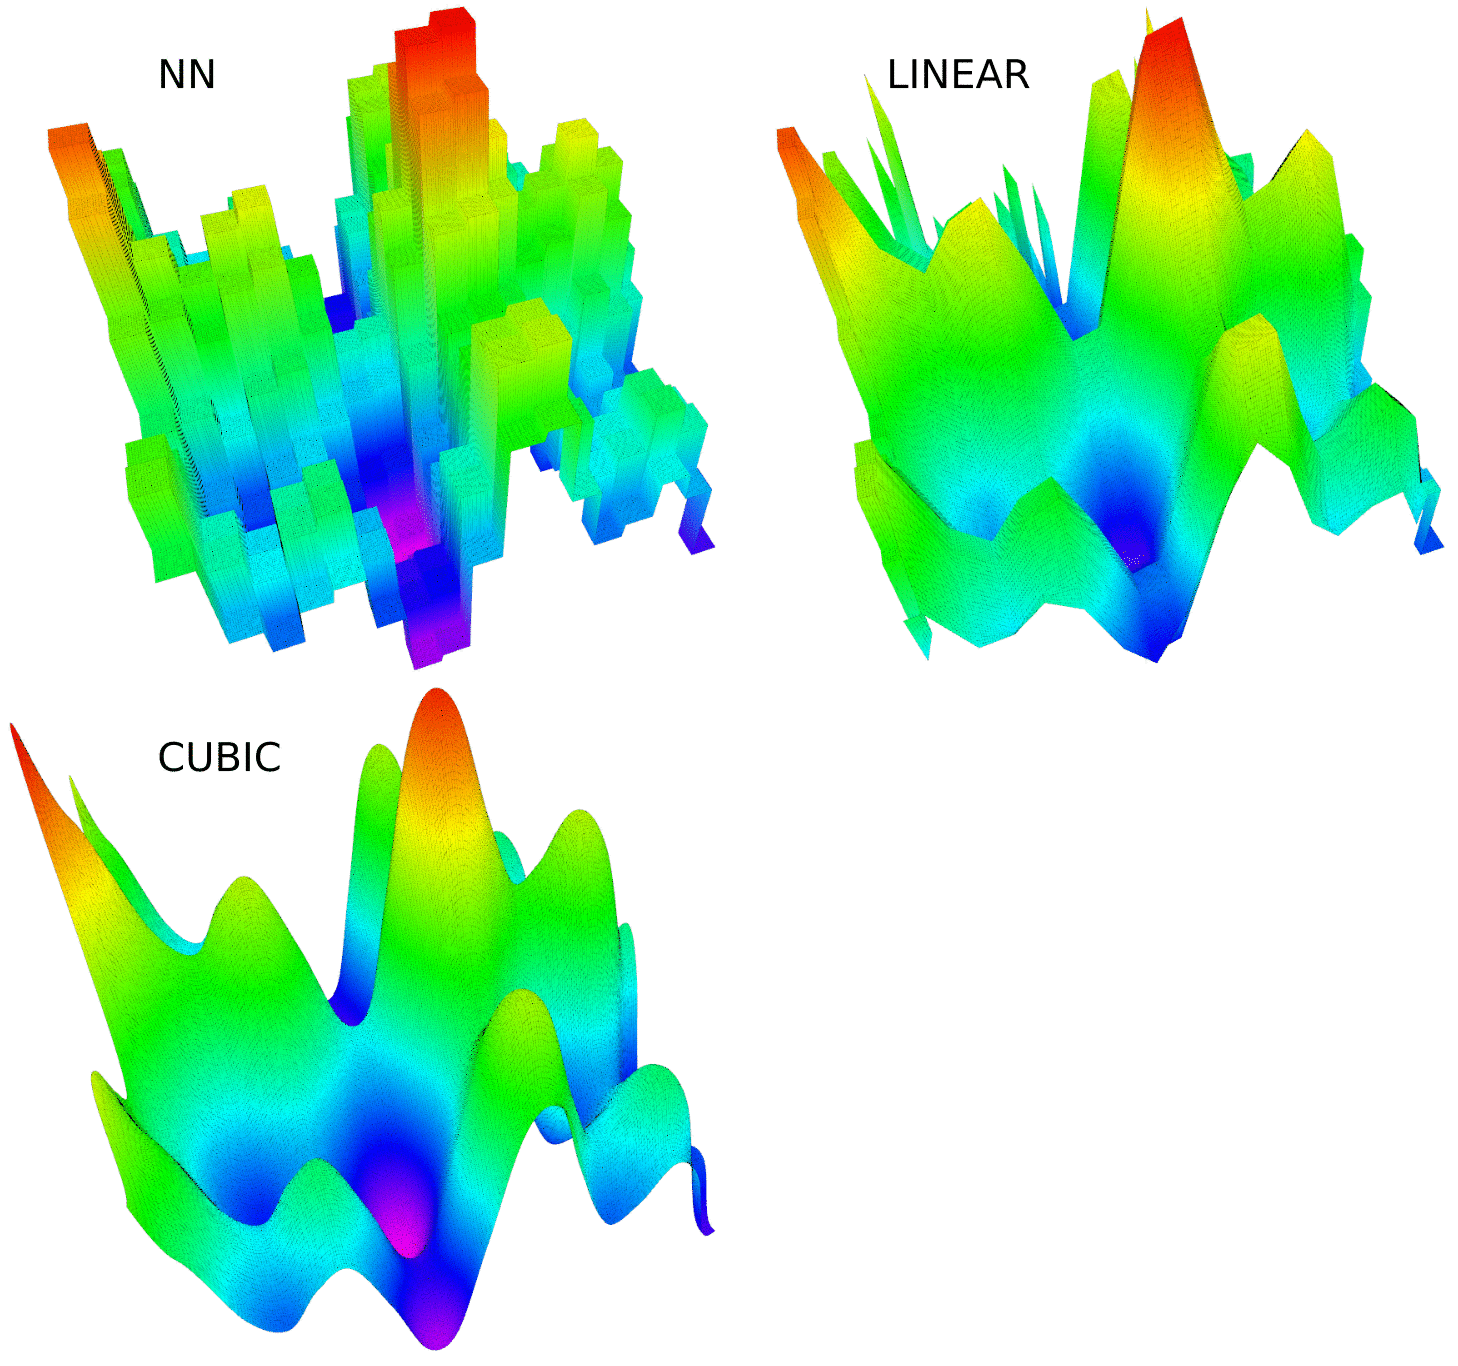
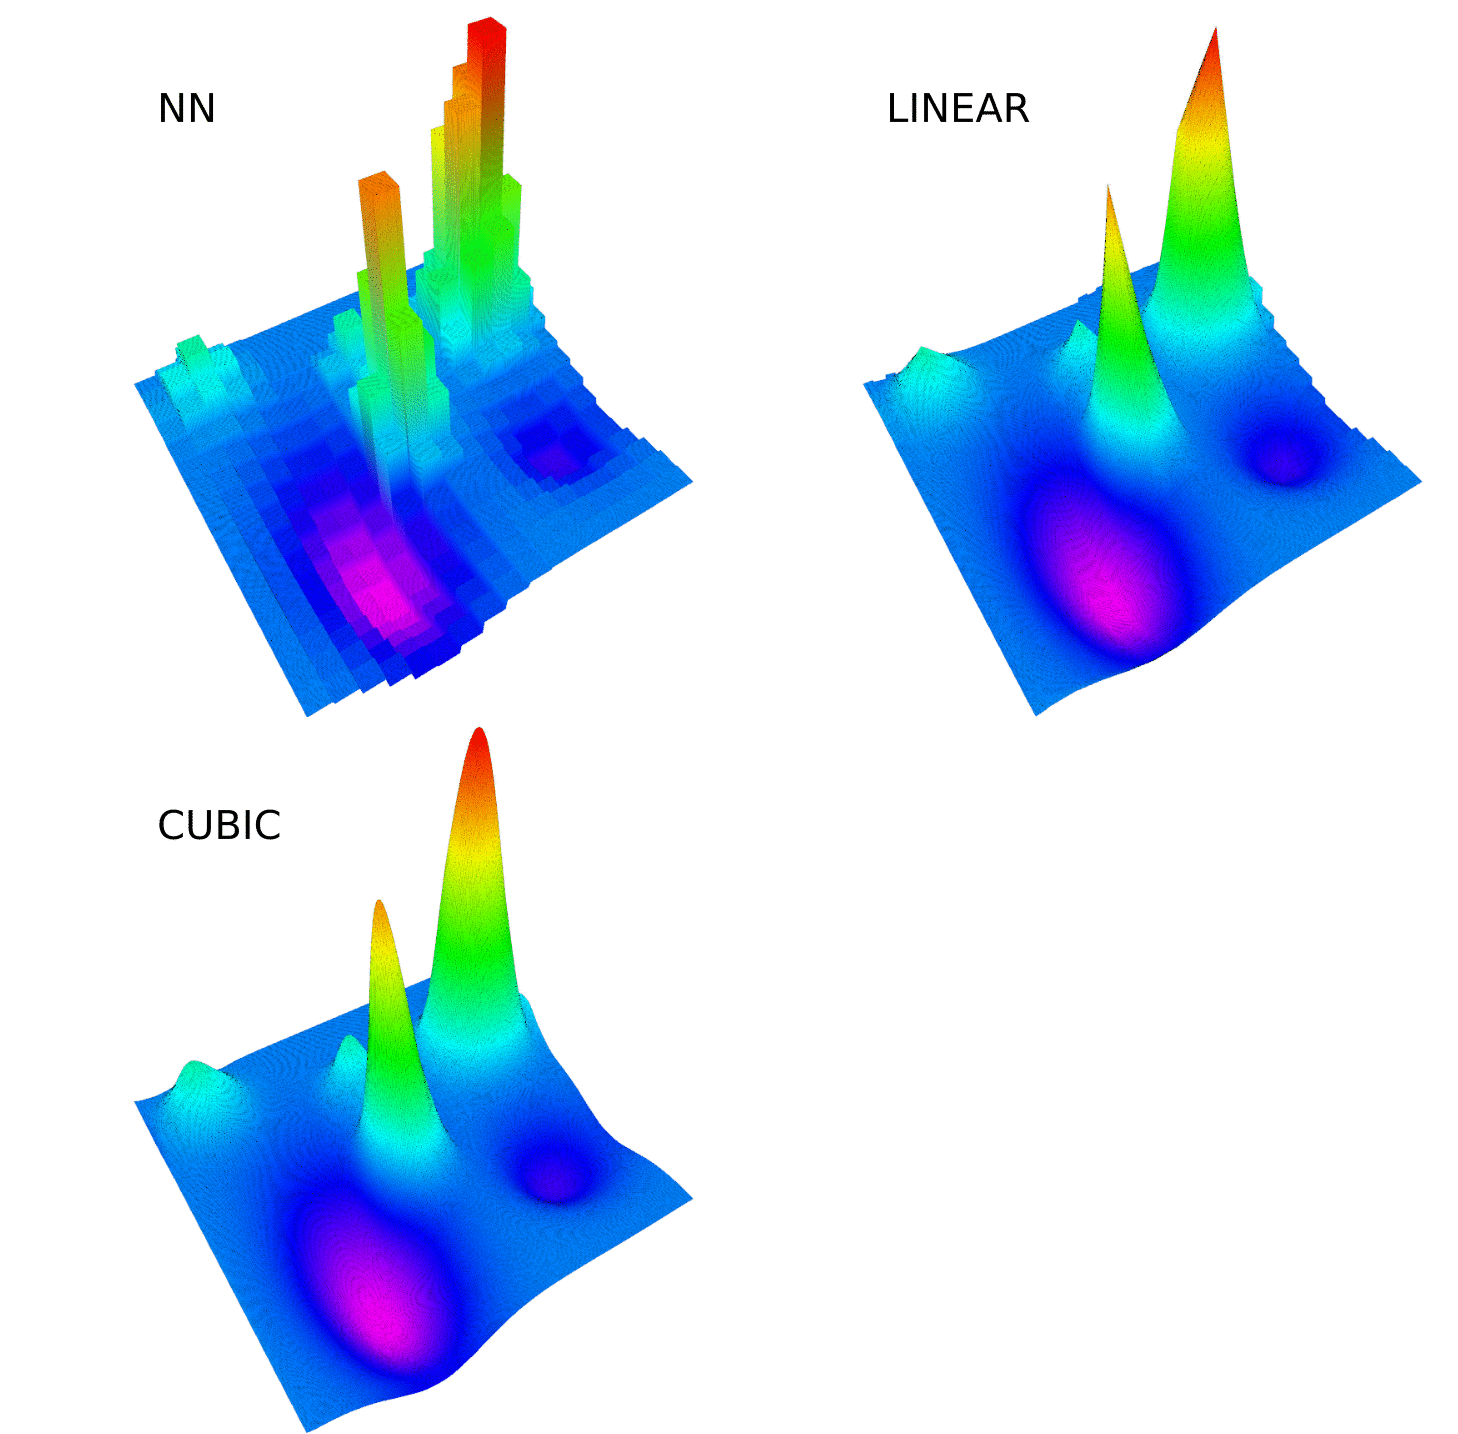
使用者可以在interpolation_demo.yaml檔案中使用不同的世界(表面)和不同的插值設定。可視化以綠色和黃色顯示地面實況。插值結果以紅色和紫色顯示。此外,此演示還計算最大和平均插值誤差,以及單一插值查詢所需的平均時間。
網格地圖有四種不同的插值方法(按照精度增加和複雜性增加的順序):
有關更多詳細信息,請查看CubicInterpolation.hpp文件中列出的文獻。

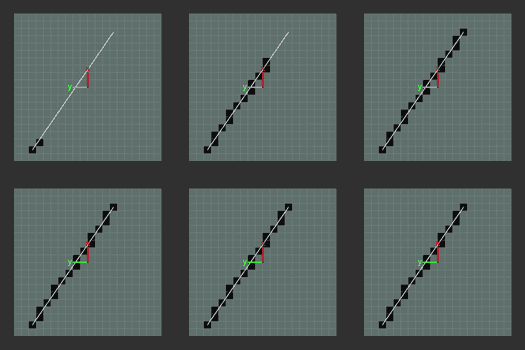
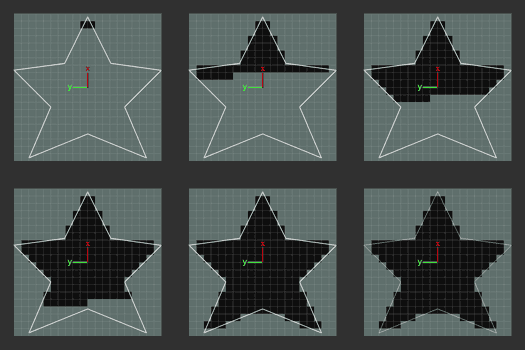
為了方便起見,網格地圖庫包含各種迭代器。
| 網格圖 | 子圖 | 圓圈 | 線 | 多邊形 |
|---|---|---|---|---|
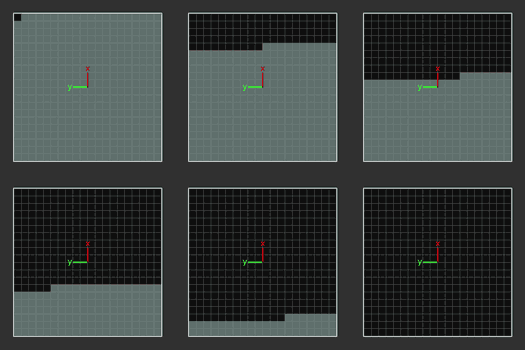 | 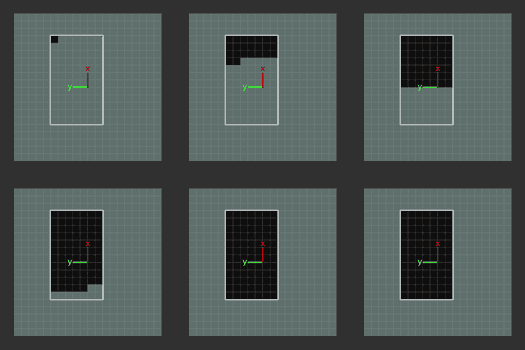 | 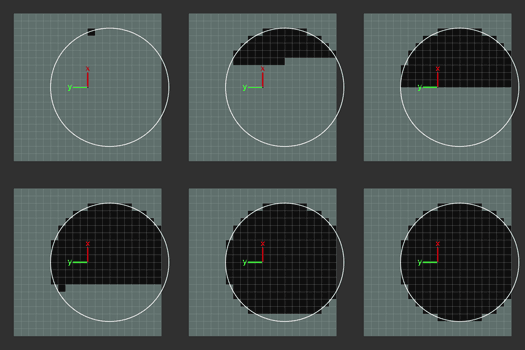 |  |  |
| 橢圓 | 螺旋 | |||
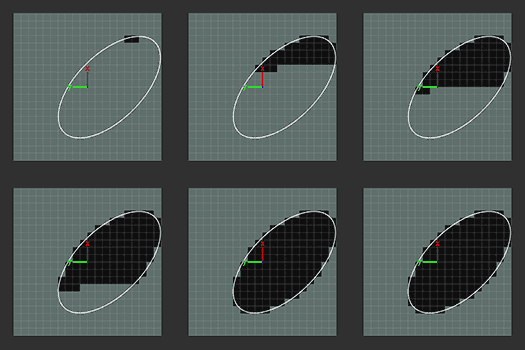 | 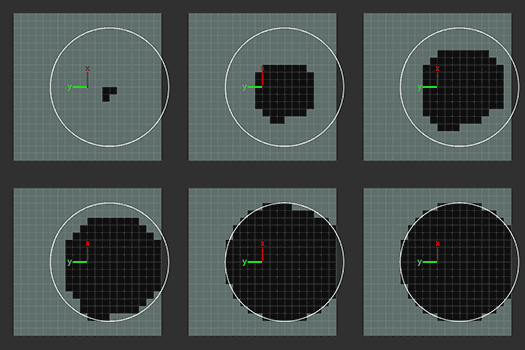 |
在for迴圈中使用迭代器很常見。例如,使用GridMapIterator迭代整個網格地圖
 for (grid_map::GridMapIterator iterator(map); !iterator.isPastEnd(); ++iterator) {
    cout << "The value at index " << (*iterator).transpose() << " is " << map.at("layer", *iterator) << endl;
}
其他網格地圖迭代器遵循相同的形式。您可以在iterators_demo節點中找到有關如何使用不同迭代器的更多範例。
注意:為了在使用迭代器時獲得最大效率,建議在for循環之外使用grid_map::Matrix& data = map["layer"]在本地儲存對網格圖資料層的直接存取:
 grid_map::Matrix& data = map["layer"];
for (GridMapIterator iterator(map); !iterator.isPastEnd(); ++iterator) {
    const Index index(*iterator);
    cout << "The value at index " << index.transpose() << " is " << data(index(0), index(1)) << endl;
}
您可以在grid_map_demos套件的iterator_benchmark節點中找到迭代器效能的基準測試,該節點可以使用以下命令執行
rosrun grid_map_demos iterator_benchmark
請注意,雖然迭代器很方便,但使用內建 Eigen 方法通常是最乾淨、最有效的。以下是一些範例:
為圖層的所有儲存格設定常數值:
map["layer"].setConstant(3.0);
新增兩層:
map["sum"] = map["layer_1"] + map["layer_2"];
縮放圖層:
map["layer"] = 2.0 * map["layer"];
最大限度。兩層之間的值:
map["max"] = map["layer_1"].cwiseMax(map["layer_2"]);
計算均方根誤差:
  map.add("error", (map.get("layer_1") - map.get("layer_2")).cwiseAbs());
  unsigned int nCells = map.getSize().prod();
  double rootMeanSquaredError = sqrt((map["error"].array().pow(2).sum()) / nCells);
有兩種不同的方法可以更改地圖的位置:
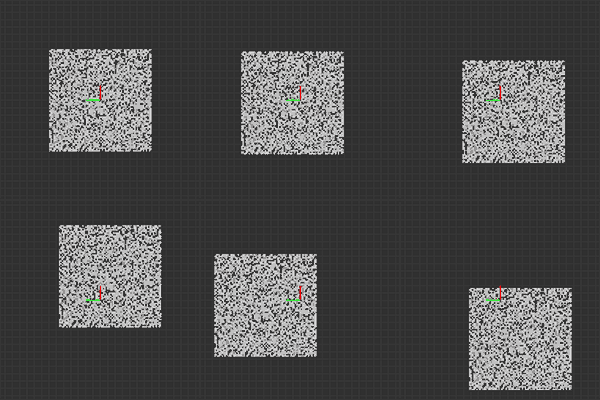
setPosition(...) :更改地圖的位置,而不更改地圖中儲存的資料。這會更改資料和地圖框之間的對應關係。
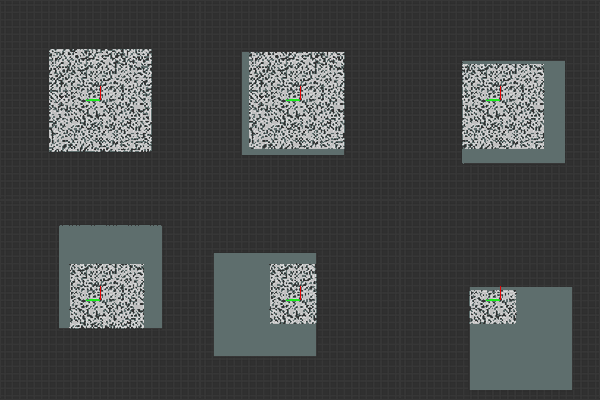
move(...) :將網格地圖擷取的區域重新定位到靜態網格地圖框架。使用它可以移動網格地圖邊界,而無需重新定位網格地圖資料。負責所有資料處理,使網格地圖資料在網格地圖框中保持靜止。
注意:由於循環緩衝區結構,相鄰索引可能不會在地圖框中接近。此假設僅適用於透過 getUnwrappedIndex() 獲得的索引。
setPosition(...) | move(...) |
|---|---|
 |  |
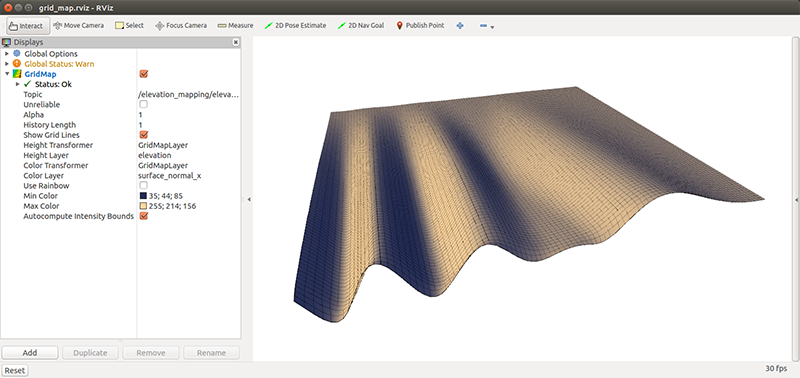
此 RViz 外掛程式將網格地圖圖層視覺化為 3D 曲面圖(高度圖)。可以選擇單獨的圖層作為顏色資訊的圖層。
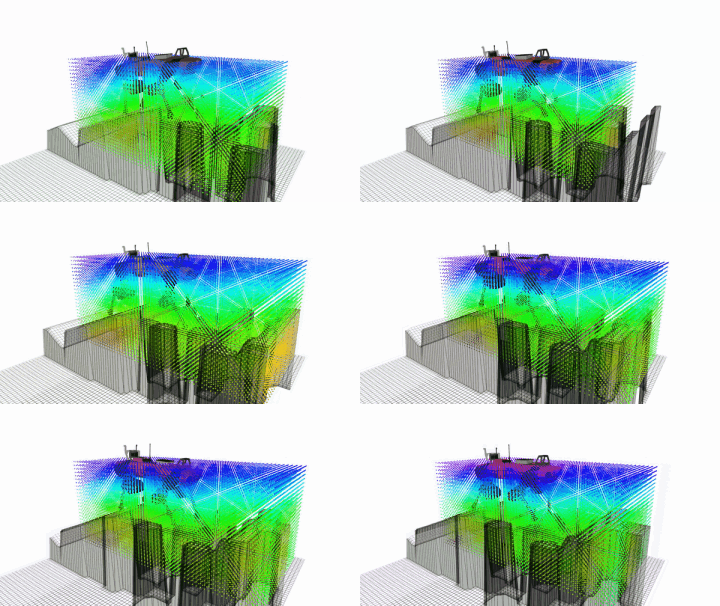
該軟體包提供了一種有效的演算法,可將高程圖轉換為密集的 3D 有符號距離場。 3D 網格中的每個點都包含到地圖中最近點的距離以及梯度。
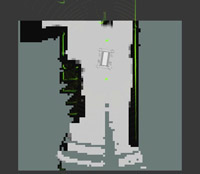
此節點訂閱 grid_map_msgs/GridMap 類型的主題並發布可在 RViz 中視覺化的訊息。視覺化工具發布的主題可以使用 YAML 參數檔案進行完全配置。可以添加任意數量的具有不同參數的可視化。這裡有一個教學演示設定檔的範例。
| 點雲 | 向量 | 佔用網格 | 網格單元 |
|---|---|---|---|
 |  |  |  |
grid_map_topic (字串,預設值:“/grid_map”)
要視覺化的網格地圖主題的名稱。請參閱下面有關可視化工具的描述。
/grid_map (grid_map_msgs/GridMap)
要可視化的網格圖。
發布的主題使用YAML參數檔案進行設定。可能的主題有:
point_cloud (感測器訊息/PointCloud2)
將網格圖顯示為點雲。使用layer參數選擇要轉換為點的圖層。
  name: elevation
  type: point_cloud
  params:
   layer: elevation
   flat: false # optional
flat_point_cloud (sensor_msgs/PointCloud2)
將網格圖顯示為「平面」點雲,即所有點都處於相同高度z 。借助Color Transformer可以輕鬆地在 RViz 中可視化 2D 地圖或影像(甚至視訊串流)。參數height決定了平面點雲所需的z位置。
  name: flat_grid
  type: flat_point_cloud
  params:
   height: 0.0
注意:為了從空/無效單元格中省略平面點雲中的點,請指定應使用setBasicLayers(...)檢查有效性的圖層。
vectors (visualization_msgs/標記)
將網格地圖的向量資料視覺化為視覺標記。使用layer_prefix參數指定保存向量的x 、 y和z分量的層。參數position_layer定義用作向量起點的層。
  name: surface_normals
  type: vectors
  params:
   layer_prefix: normal_
   position_layer: elevation
   scale: 0.06
   line_width: 0.005
   color: 15600153 # red
occupancy_grid (nav_msgs/佔用網格)
將網格地圖的圖層視覺化為佔用網格。使用layer參數指定要視覺化的圖層,並使用data_min和data_max指定上限和下限。
  name: traversability_grid
  type: occupancy_grid
  params:
   layer: traversability
   data_min: -0.15
   data_max: 0.15
grid_cells (nav_msgs/GridCells)
將網格地圖的圖層視覺化為網格單元。使用layer參數指定要視覺化的圖層,並使用lower_threshold和upper_threshold指定上限和下限。
  name: elevation_cells
  type: grid_cells
  params:
   layer: elevation
   lower_threshold: -0.08 # optional, default: -inf
   upper_threshold: 0.08 # optional, default: inf
region (可視化訊息/標記)
顯示網格地圖的邊界。
  name: map_region
  type: map_region
  params:
   color: 3289650
   line_width: 0.003
注意:顏色值採用 RGB 形式作為串聯整數(每個通道值 0-255)。以綠色為例(紅色:0,綠色:255,藍色:0),可以像這樣產生值。
grid_map_filters套件包含幾個過濾器,可以套用網格地圖來對圖層中的資料執行計算。網格地圖過濾器基於 ROS 過濾器,這意味著可以將過濾器鏈配置為 YAML 檔案。此外,還可以透過 ROS 插件機制編寫並提供其他過濾器,例如grid_map_cv套件中的InpaintFilter 。
grid_map_filters套件中提供了幾個基本過濾器:
gridMapFilters/ThresholdFilter
如果條件層超過上限或下限閾值(一次只有一個閾值),則將輸出層中的值設為指定值。
  name: lower_threshold
  type: gridMapFilters/ThresholdFilter
  params:
    condition_layer: layer_name
    output_layer: layer_name
    lower_threshold: 0.0 # alternative: upper_threshold
    set_to: 0.0 # # Other uses: .nan, .inf
gridMapFilters/MeanInRadiusFilter
計算層中每個像元半徑內的平均值。
  name: mean_in_radius
  type: gridMapFilters/MeanInRadiusFilter
  params:
    input_layer: input
    output_layer: output
    radius: 0.06 # in m.
gridMapFilters/MedianFillFilter
計算層中每個NaN單元的半徑補片內(有限值)的中位數。 (可選)對已經有限的值應用中位數計算,這些點的補片半徑由現有_值_半徑給出。請注意,僅當 fill_mask 對於該點有效時才會執行填滿計算。
  name: median
  type: gridMapFilters/MedianFillFilter
  params:
    input_layer: input
    output_layer: output
    fill_hole_radius: 0.11 # in m.
    filter_existing_values: false # Default is false. If enabled it also does a median computation for existing values.
    existing_value_radius: 0.2 # in m. Note that this option only has an effect if filter_existing_values is set true.
    fill_mask_layer: fill_mask # A layer that is used to compute which areas to fill. If not present in the input it is automatically computed.
    debug: false # If enabled, the additional debug_infill_mask_layer is published.
    debug_infill_mask_layer: infill_mask # Layer used to visualize the intermediate, sparse-outlier removed fill mask. Only published if debug is enabled.
gridMapFilters/NormalVectorsFilter
計算地圖中圖層的法線向量。
  name: surface_normals
  type: gridMapFilters/NormalVectorsFilter
  params:
    input_layer: input
    output_layers_prefix: normal_vectors_
    radius: 0.05
    normal_vector_positive_axis: z
gridMapFilters/NormalColorMapFilter
基於法線向量層計算新的顏色層。
  name: surface_normals
  type: gridMapFilters/NormalColorMapFilter
  params:
    input_layers_prefix: normal_vectors_
    output_layer: normal_color
gridMapFilters/MathExpressionFilter
解析和評估具有網格地圖圖層的數學矩陣表達式。有關表達式的文檔,請參閱 EigenLab。
  name: math_expression
  type: gridMapFilters/MathExpressionFilter
  params:
    output_layer: output
    expression: acos(normal_vectors_z) # Slope.
    # expression: abs(elevation - elevation_smooth) # Surface roughness.
    # expression: 0.5 * (1.0 - (slope / 0.6)) + 0.5 * (1.0 - (roughness / 0.1)) # Weighted and normalized sum.
gridMapFilters/SlidingWindowMathExpressionFilter
解析並評估網格地圖圖層上滑動視窗內的數學矩陣表達式。有關表達式的文檔,請參閱 EigenLab。
  name: math_expression
  type: gridMapFilters/SlidingWindowMathExpressionFilter
  params:
    input_layer: input
    output_layer: output
    expression: meanOfFinites(input) # Box blur
    # expression: sqrt(sumOfFinites(square(input - meanOfFinites(input))) ./ numberOfFinites(input)) # Standard deviation
    # expression: 'sumOfFinites([0,-1,0;-1,5,-1;0,-1,0].*elevation_inpainted)' # Sharpen with kernel matrix
    compute_empty_cells: true
    edge_handling: crop # options: inside, crop, empty, mean
    window_size: 5 # in number of cells (optional, default: 3), make sure to make this compatible with the kernel matrix
    # window_length: 0.05 # instead of window_size, in m
gridMapFilters/DuplicationFilter
複製網格地圖的圖層。
  name: duplicate
  type: gridMapFilters/DuplicationFilter
  params:
    input_layer: input
    output_layer: output
gridMapFilters/DeletionFilter
從網格地圖中刪除圖層。
  name: delete
  type: gridMapFilters/DeletionFilter
  params:
    layers: [color, score] # List of layers.
此外, grid_map_cv套件還提供以下過濾器:
gridMapCv/InpaintFilter
使用 OpenCV 修復/填滿圖層中的孔。
  name: inpaint
  type: gridMapCv/InpaintFilter
  params:
    input_layer: input
    output_layer: output
    radius: 0.05 # in m
| 動力學 | 旋律 | 意念 | |
|---|---|---|---|
| 網格圖 | |||
| 文件 |
| 動力學 | 旋律 | 意念 | |
|---|---|---|---|
| 網格圖 | |||
| 網格圖核心 | |||
| grid_map_costmap_2d | |||
| 網格圖CV | |||
| 網格地圖演示 | |||
| 網格地圖過濾器 | |||
| 網格地圖載入器 | |||
| 網格地圖訊息 | |||
| grid_map_octomap | |||
| 網格圖pcl | |||
| 網格地圖ros | |||
| grid_map_rviz_plugin | |||
| 網格地圖sdf | |||
| 網格地圖視覺化 |
請使用問題追蹤器報告錯誤並請求功能。